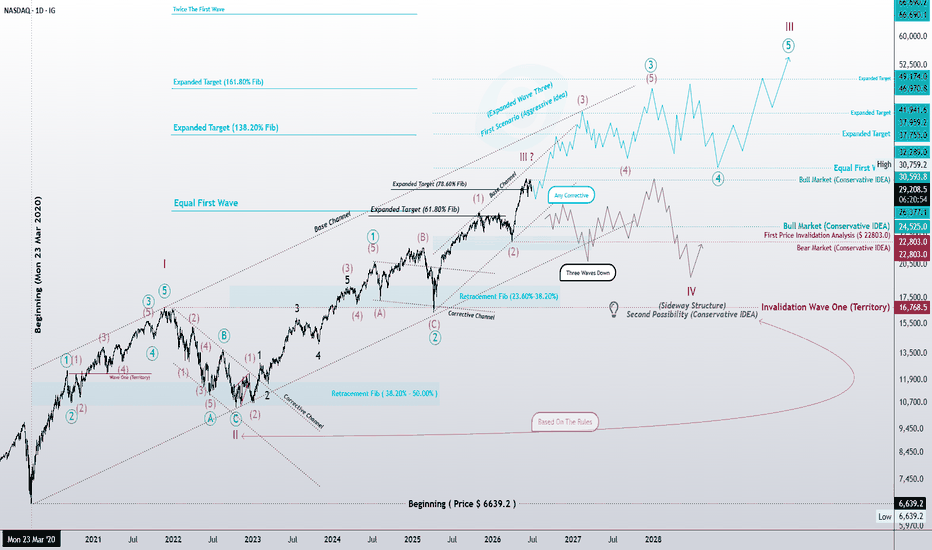
Nasdaq Daily Chart: A Duality of Market ScenariosIn today’s daily analysis of the NASDAQ, I’m navigating two distinct scenarios. As a market analyst, the truth often lies in how we manage these conflicting perspectives:
1. The Aggressive Thesis (Nested 1-2s):
Focusing on the internal architecture of nested 1-2 waves. This approach assumes the index is in a pure “Power Mode,” where successive impulse structures suggest we are deep within a massive, ongoing Wave 3. In this view, any pullback is merely fuel.
2. The Conservative Thesis (Wave 3 Maturity):
Monitoring the potential completion of Wave 3. My checklist here is strict and follows classic Wave Principle rules:
Verifying length constraints (Wave 3 is definitively not shorter than Wave 1).
Confirming Fibonacci confluence (Checking for extensions in the 61.8%–78.6% zone).
This is the lens for those who prioritize structural validation before committing to a bias.
Takeaway: The market doesn’t guess; it structures. Whether we lean aggressive or conservative, the Elliott Wave Principle provides the objective map. We don’t trade emotions; we trade the structure.
Economic Cycles
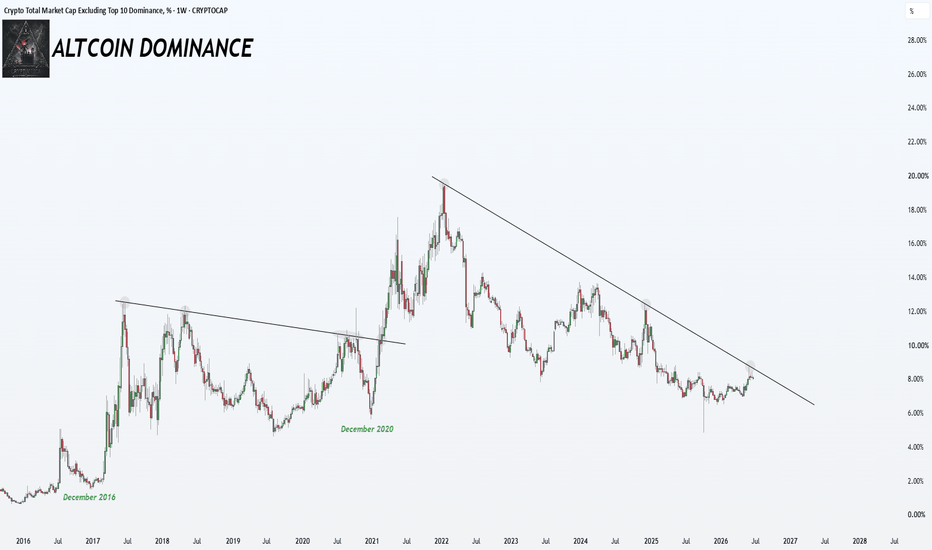
ALTSEASON IS TESTING THE DOOR.This is Altcoin Dominance excluding the top 10.
Not Bitcoin. Not Ethereum. Not the largest names. broader altcoin market.
The same structure mattered before the 2017 and 2021 rotations. Both times, the market looked quiet before breadth started to expand. Now the broad altcoin layer is pressing against the multi year downtrend again. This is not confirmation yet. But it is the exact chart I watch before altseason becomes obvious to the crowd. One coin pumping is noise. Breadth is the signal.
That makes this chart important for one reason: real altseason is not confirmed by one or two large cap coins moving. Real altseason requires breadth.
In 2016 and 2020, this structure was already starting to change before the crowd fully understood what was happening. The market did not begin with full euphoria. It began with compression, disbelief, and a slow improvement in the broader altcoin layer.
The same question is appearing again. Since the 2021 cycle expansion, altcoin dominance outside the top 10 has been trapped under a longterm descending resistance line. Every attempt to rebuild breadth has failed below that structure. This is why the current zone matters. The broader altcoin market is now pressing into the same downtrend again.
This is not confirmation yet. single touch of resistance is not enough. A real shift would require a weekly breakout, a hold above the trendline, and follow through. The market needs to prove that this is not another failed rotation attempt. If altcoin dominance breaks and holds above this multi year resistance, the message changes. It would mean the broader altcoin market is no longer only bleeding against the largest crypto assets. It would mean breadth is starting to return.
That is the part most people miss.
Altseason does not begin when everyone is excited. It usually begins when the structure starts improving while attention is still low. The crowd waits for green candles. I watch the relative structure before the move becomes obvious. invalidation is also clear. If altcoin dominance rejects again and loses the recent base, the broader market is not ready. That would suggest another failed breadth attempt and a continuation of the post 2021 compression phase. chart is asking a simple question: Is the broad altcoin market still dead, or is it preparing to reclaim market share again? One coin pumping is noise. Breadth is the signal.
TOTAL3/BTC
Bitcoin Dominance
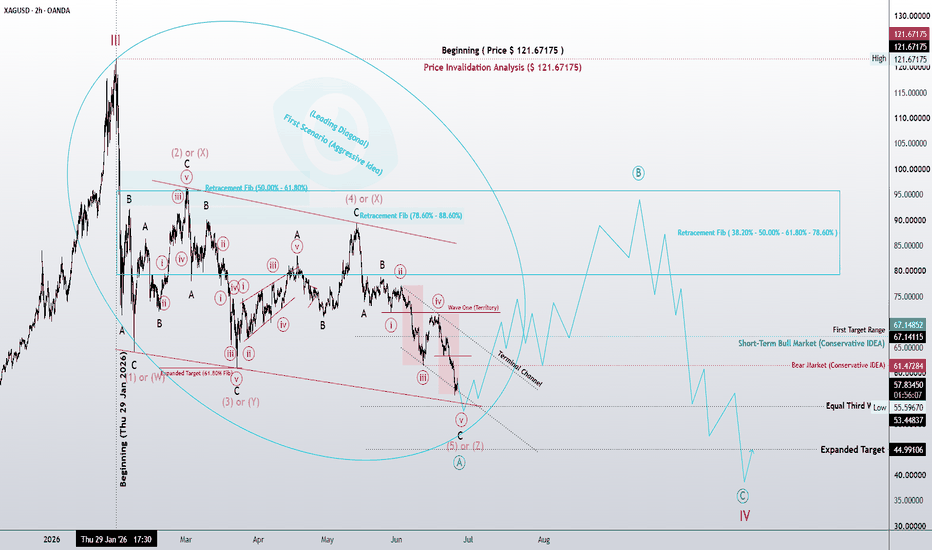
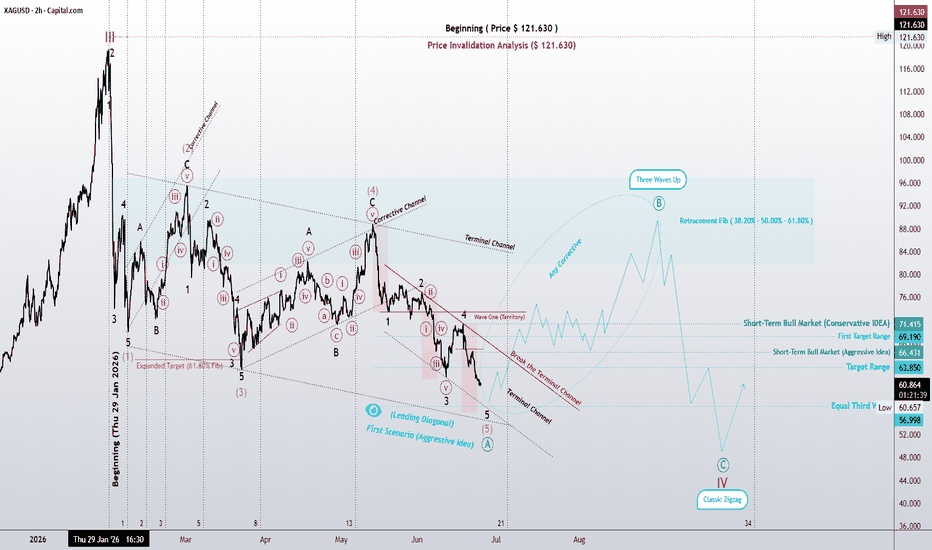
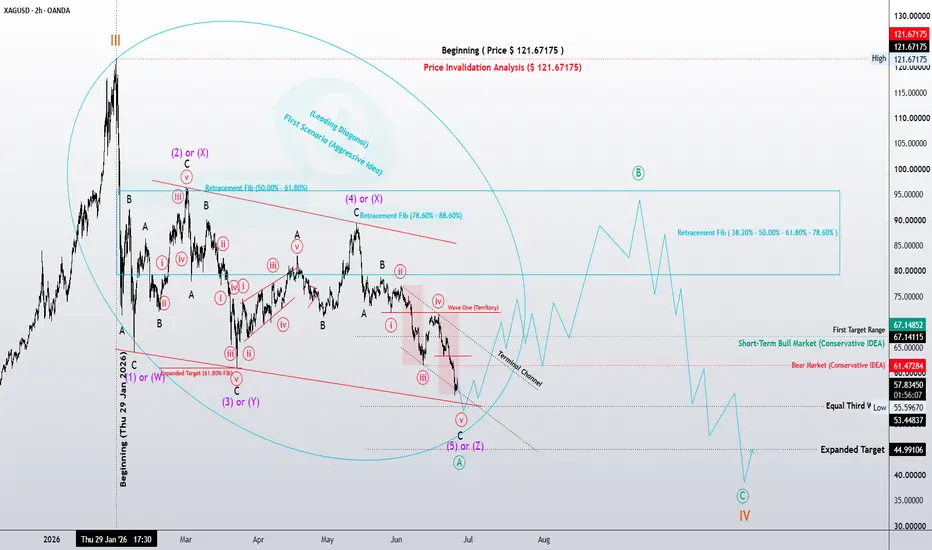
$XAGUSD | Structure Research 3.3.3.3.3 or 5.3.5.3.5 Bar ChartThe market is not always what it appears to be.
At first glance, the current Silver structure can be interpreted as a Leading Diagonal — supported by wave overlap, converging boundaries, and corrective characteristics within waves 2 and 4.
However, there is another possibility worth exploring.
What if this entire formation is actually a Double or Triple Zigzag completing the final stage of a much larger corrective sequence?
From an Elliott Wave perspective, both counts remain valid.
What continues to capture my attention is the persistent three-wave character throughout much of the structure — a feature that also supports the multiple-zigzag interpretation.
If this hypothesis proves correct, Silver may be approaching a significant structural turning point.
Markets often tell their clearest story just before a major change.
Yet sometimes, structure tells a different story.
I am not trying to predict the market.
I am studying the behavior of structure.
Research never ends.
– Patterns whisper. I listen. – Mr. Nobody 🎧📊
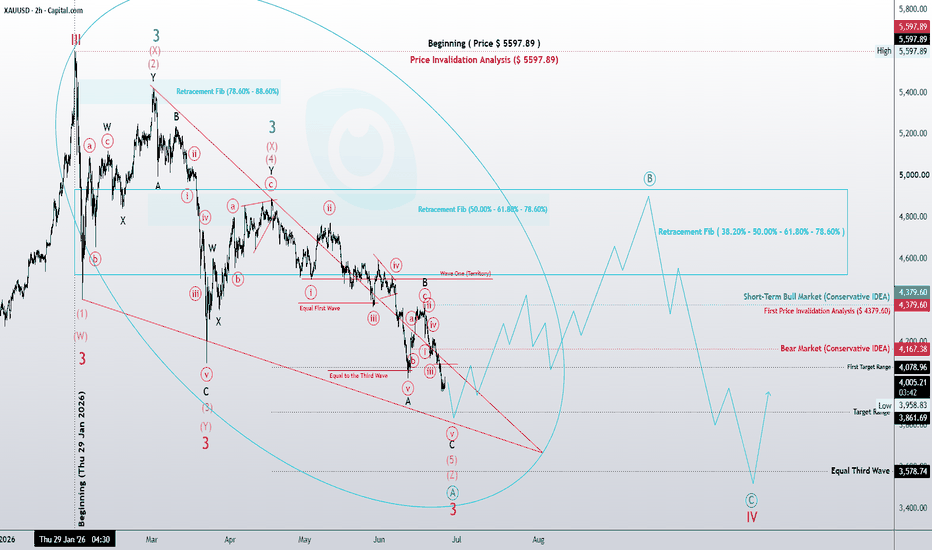
$XAUUSD | Structure Research 3.3.3.3.3 or 5.3.5.3.5 Bar Chart
The market is whispering something...
But is everyone hearing the same message?
At first glance, the current formation can be interpreted as a Leading Diagonal — a pattern often seen near the beginning of a new trend.
However, there is another possibility worth considering.
What if this entire structure is actually a complex Triple Zigzag disguising itself as a diagonal?
From an Elliott Wave perspective, both interpretations remain valid.
Wave 3 is not the shortest wave, overlap is present throughout the structure, and the converging boundaries continue to support a diagonal interpretation.
If this hypothesis proves correct, Gold may be approaching a major structural turning point that remains largely unnoticed by the broader market.
Markets often appear most convincing just before they change direction.
I am not trying to predict the market.
I am studying the behavior of structure.
Sometimes the question is more important than the answer.
Research never ends.
– Patterns whisper. I listen. – Mr. Nobody 🎧📊
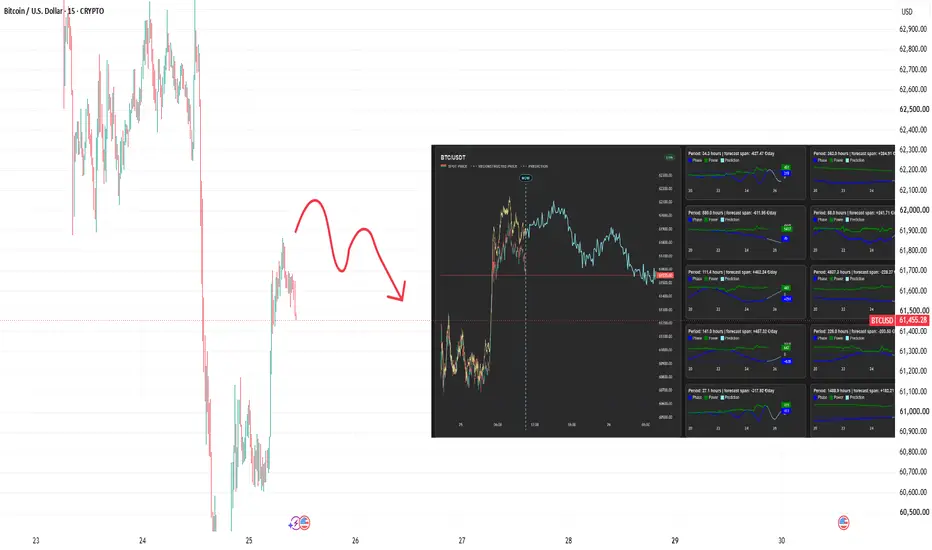
BTC update 25.06.26-24h Market Forecast (Wavelet Decomposition)Hi traders,
the previous day’s Bitcoin forecast indicated a generally sideways market, showing no strong directional bias either upward or downward. However, while the directional neutrality held in a broad sense, the shape of the forecast did not fully match the actual price evolution.
In reality, the price first experienced a sharp drop, deviating significantly from the predicted path. Interestingly, however, the market later recovered and returned close to the model’s implied equilibrium level, stabilizing around 61600, which is slightly below the initial reference level of approximately 62300, as expected by the model.
Current forecast (next 24 hours):
The current projection again suggests a largely flat market with a very slight downward drift. This behavior is driven by key spectral components pulling in opposite directions, effectively canceling out any strong dominant trend.
At the same time, the forecasted structure clearly shows two pronounced wave-like formations, indicating internal cyclical structure despite the overall weak net signal.
We will see whether this dual-wave structure and the mild downward bias will be confirmed by the actual price development over the next 24 hours.
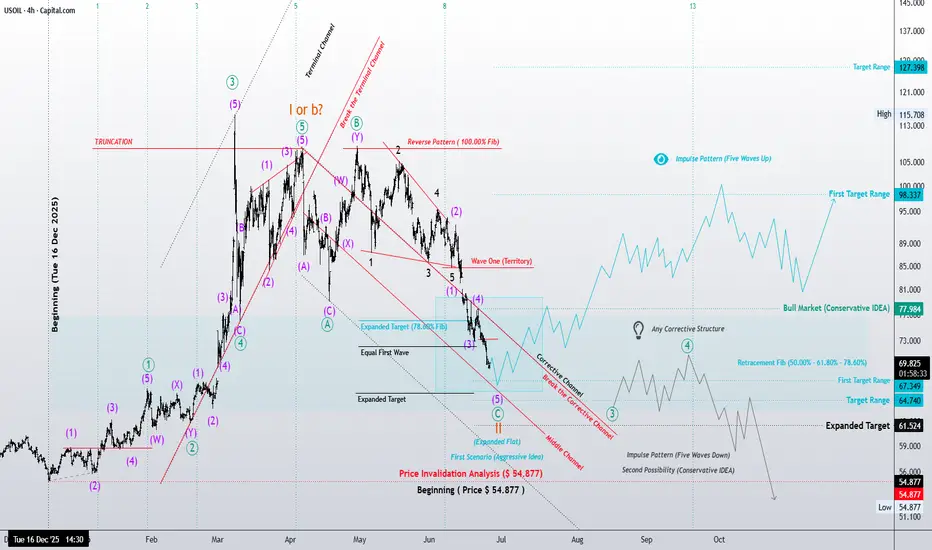
US Oil – 4H Elliott Wave UpdateTwo valid scenarios remain on the table.
The aggressive view suggests that an initial five-wave impulse has already formed from the 54.877 low. If correct, the current decline is likely Wave (2), developing as an Expanded Flat correction. Wave C appears to be approaching completion through its final subdivisions, potentially setting the stage for a strong bullish reaction. Under this scenario, reaching the first target zone and at least matching the length of Wave (1) would be a reasonable expectation.
The conservative view remains aligned with the larger bearish structure discussed in the daily analysis. In this case, the current region may still develop into a broader corrective pattern before the market attempts another decline. A break below 54.877 and even a move toward significantly lower prices cannot be ruled out.
At this stage, the structure matters more than the forecast.
The key question is whether the current decline completes as a corrective pattern or evolves into a larger impulsive move. The answer will likely determine the next major direction for crude oil.
As always, this is an Elliott Wave research study, not financial advice.
– Patterns whisper. I listen. – Mr. Nobody 🎧📊
CFDs on Crude Oil (WTI)
12 hours ago
US Oil – Daily Elliott Wave Perspective
Brent Oil Spot
7 days ago
UKOIL – The Market Is Approaching a Structural Decision
Dollar Index (DXY) Elliott Wave view: Bullish Sequence The Dollar Index (DXY) maintains an incomplete bullish sequence from the January 27, 2026 low, supporting expectations for further upside. The projected target lies within the 100%–161.8% Fibonacci extension range, measured from that low, pointing toward 102.7–106.0. This zone provides a clear technical framework for anticipating continued strength.
From a short‑term perspective, the rally that began on May 29 is unfolding as a five‑wave impulsive Elliott Wave structure. Within this advance, wave ((i)) concluded at 100.31, followed by a corrective pullback in wave ((ii)) that ended at 99.38. The subsequent progression has carried the Index higher in wave ((iii)), which itself forms a smaller degree impulse.
From wave ((ii)), wave (i) terminated at 99.79, while wave (ii) retraced to 99.46. The Index then extended upward in wave (iii) to 101.12, before wave (iv) dipped modestly to 100.69. One more push higher is expected to complete wave (v) of ((iii)). After that, a corrective phase in wave ((iv)) should unfold, addressing the cycle from the June 15 low before resuming the broader advance.
Near term, as long as the pivotal support at 99.40 remains intact, pullbacks are expected to attract buyers. These corrections should unfold in the typical three, seven, or eleven‑swing sequences, reinforcing the bullish bias and supporting the view of continued strength in the Dollar Index.
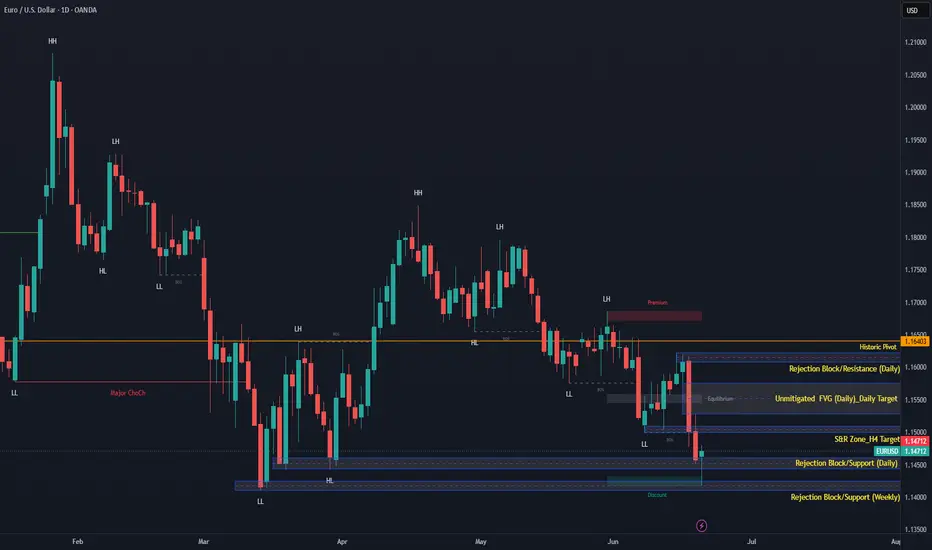
EURUSD Structural Report: Weekly Market Preview1. Macro Narrative & Daily Footprint (1D)
The primary macro trajectory for EURUSD remains structurally bearish, driven by high-level institutional capital flows favoring the USD. The market recently expanded downward to target a critical multi-month internal sell-side liquidity pool anchored at 1.14110.
Liquidity Absorption: During the Friday morning session liquidity cycle, price aggressively pierced the daily support zone (~1.1460) and swept deep into the Weekly Rejection Block (~1.1420), coming within 8 pips of the ultimate 1.14110 macro target before rapid institutional order absorption materialized.
The Daily Footprint: The daily candle completed its cycle strongly up at 1.14712, leaving a massive rejection wick at the base of the structural leg. This signature signifies substantial order absorption by commercial matching engines defending the higher-timeframe weekly support boundary.
The Premium Draw: This clean downward expansion has left an unmitigated Daily Fair Value Gap (1D-FVG) between 1.1530 and 1.1570. This structural imbalance acts as a powerful algorithmic magnet, drawing price higher to rebalance delivery arrays before the broader macro trend resumes.
2. Intraday Framework & Breakpoint Dynamics (H4)
On the 4-Hour timeframe, order flow delivery has shifted transmission to support a structural counter-trend retracement phase.
Market Structure Break (MSB): Friday's upward displacement printed a solid H4 candle body close above the previous lower high threshold at 1.1445.
Tactical Bias: The immediate structural bias remains bullish until price completes a mechanical retest of this recent H4 structural breakpoint/resistance target.
3. Weekly Execution Contingency Matrix
Rather than reacting to early session volatility or intra-hour noise, market exposure is managed exclusively via higher-timeframe limit structures across two distinct structural pathways:
PATHWAY A: SHALLOW MITIGATION & PIVOT: Price tests immediate H4 MSB / Resistance.
• Immediate rejection signals a continuation down to finalize the 1.14110 macro liquidity pool
PATHWAY B: DEEP PREMIUM RETRACEMENT: Price invalidates H4 and expands to 1D-FVG.
• Expect sellers to step in inside the Daily Fair Value Gap (1.1530–1.1570) for a premium pricing for a ride down to the 1.14110 macro liquidity pool.
Strategic Risk Parameters:
Wick Isolation: Any localized lower-timeframe gaps forming entirely within the physical footprint of the Daily/H4 rejection wicks are classified as market noise. Limit entry matrices remain anchored strictly to the macro open/close boundaries of the higher-timeframe Rejection Blocks.
Systemic Pivot: If the upward expansion into the Daily FVG breaches structural boundaries so aggressively that it prints an opposing, valid Bullish Daily FVG, the short bias will be deactivated immediately to realign with the new higher-timeframe institutional narrative.
System Note: This contingency framework remains entirely time-insensitive, operating strictly on spatial price coordinates and higher-timeframe structural validity rather than session-open timing.
Note: This is an objective analysis and not a signal for engaging the market. Let me know what you all think!
US Oil – Daily Elliott Wave PerspectiveFrom my current Elliott Wave interpretation, Wave (II) appears to be developing as a classic Zigzag correction.
Wave A likely formed as a Leading Diagonal, while Wave B unfolded as a corrective Zigzag structure. If this count is correct, the next phase should be an impulsive Wave C. Since diagonals typically consume more time than impulses, Wave C could develop with greater momentum and at a faster pace.
My focus is not on predicting news events, agreements, or conflicts. Those factors may influence timing, but the underlying structure remains the primary guide.
Based on the current wave development, crude oil may be approaching the completion of a corrective cycle and preparing for the next major phase within a larger bullish sequence.
As always, this is a research-based Elliott Wave study and not financial advice.
– Patterns whisper. I listen. – Mr. Nobody 🎧📊
CFDs on Brent Crude Oil
Jun 6
Crude Oil: The Long-Term Elliott Wave Projection
CFDs on Crude Oil (Brent)
7 days ago
Elliott Wave Scenarios into 2040 Strategic Analysis of UKOIL
Brent Oil Spot
7 days ago
UKOIL – The Market Is Approaching a Structural Decision
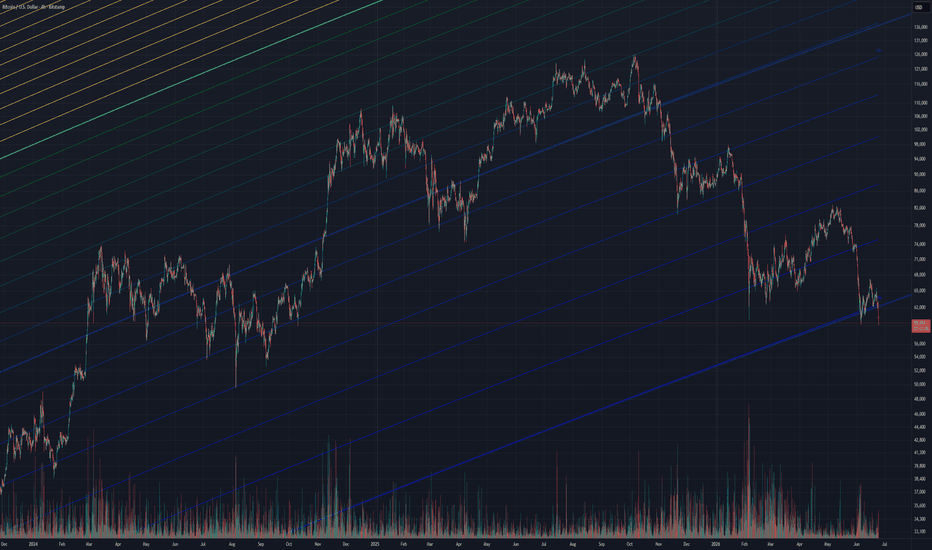
BTC Regression CurveTrolololo's BTC log regression curve bitcointalk.org BITSTAMP:BTCUSD has been practically spot on for the general trajectory of BTC. I've created % deviations from that log curve to give an idea of how under or overpriced BTC is. The last time we touch the -75% deviation was in 2020 at the ~3800 usd low and 2022. It stayed under for less than 2 days both times and shot back up to at least the -70% deviation. Hitting the -75% deviation for me is a signal that we've hit the bottom. I guess we'll see how it plays out.
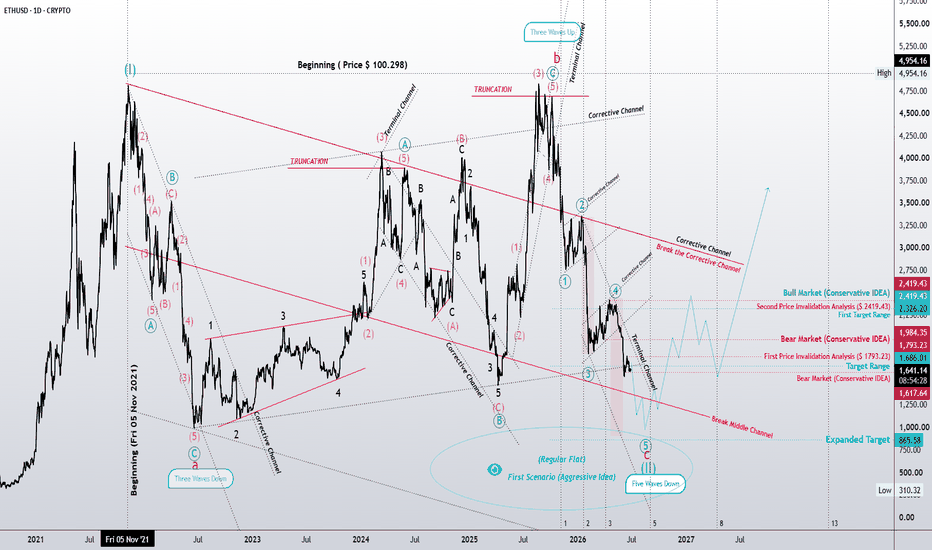
ETHUSDT Macro Analysis: Deciphering the Wave (II) Corrective StrETHUSDT Macro Analysis: Deciphering the Wave (II) Corrective Structure
Date: June 24, 2026
1. Executive Summary & Methodology
This analysis is strictly executed on a Closing Price (Line) Chart to filter out intraday volatility and candlestick noise. By isolating the closing price action, we aim to achieve a high-fidelity view of the underlying structural geometry and the macro-wave cycles. Our primary objective is to pinpoint the terminal phase of the Wave (II) corrective cycle.
2. Technical Structural Breakdown
Ethereum is currently navigating the concluding phase of a Regular Flat correction pattern. Based on rigorous wave counting and structural mapping:
Current Phase: The market is finalizing Wave © within a 5-wave impulsive sub-structure (Waves 1 through 5).
Internal Geometry: The internal impulse adheres to a classic 5-3-5-3-5 blueprint, confirming a textbook Regular Flat pattern—one of the most reliable structural markers in Elliott Wave theory.
Channeling & Validation: We are utilizing Terminal Channeling to confirm trend exhaustion. The breach of the Corrective Channel serves as our primary signal for a potential phase shift in price action.
3. Price Targets & Trade Scenarios
Primary Objective (Target): Reaching the 61.8% Fibonacci retracement zone, approximately at the $860 level (Expanded Target). This zone represents the most probable conclusion of Wave (II) and the initiation of a new macro-cycle.
Risk Management & Invalidation: Defined boundaries for “Bull” and “Bear” scenarios (
2,408 𝑎𝑛𝑑 2,408 and 1,984, respectively) serve as our critical Invalidation Points. Any price excursion beyond these levels necessitates an immediate reassessment of the current wave count.
4. Concluding Outlook
The current structural trajectory indicates a decisive bearish impulse with a clear terminal objective. The reliance on the Line Chart has allowed for the precise mapping of these sensitive channels, devoid of the distortion caused by candle wicks. Given the current wave degree, this zone represents a high-conviction area for monitoring and preparing for the upcoming large-scale trend reversal.
📊 Analysis executed by Mehdi
Mr. Nobody 🎧📊
“Patterns are whispering—and I’m listening.”
ETHUSD Technical Analysis: The Flat Correction OutlookDate: June 24, 2026
1. Current Structural Overview
Based on recent chart data, ETHUSD is currently navigating the final stages of a Regular Flat corrective pattern. The price action is presently within wave ‘c’ of a bearish 5-wave impulsive structure, which aims to complete the higher-degree wave (II) on the macro timeframe.
2. Price Targets and Scenarios
Primary Scenario (Regular Flat): The current bearish momentum is projected to find support near the $865 level (aligning with the parity of wave 3). The completion of this pattern would signal the end of wave (II) and potentially initiate a sideways, ranging structure.
Alternative Scenario (Deep Correction Risk): Should the Regular Flat fail to hold structurally, the pattern may transition into a Zigzag (5-3-5) structure. In this event, we should anticipate a deeper decline toward more aggressive bearish targets.
3. Key Drivers and Market Variables
Bitcoin Correlation: The validity of this outlook is heavily contingent upon Bitcoin’s price action. If Bitcoin undergoes a major corrective phase, the likelihood of a deeper ETH correction (the Zigzag scenario) increases significantly.
Trading Stance: At this juncture, a “Wait and Confirm” approach is advised. The subsequent market direction—whether it settles into a range or continues its downward trajectory—will depend on how the market reacts upon the completion of the current pattern.
Mr. Nobody 🎧📊
“Patterns are whispering—and I’m listening.”
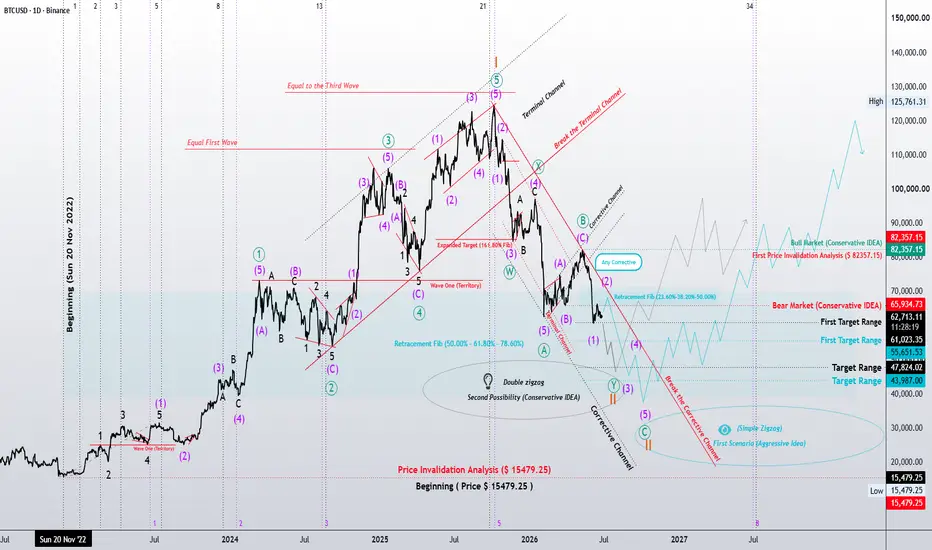
One More Low Ahead... But What Structure Is Bitcoin Building?Bitcoin is approaching a critical decision zone where the structure of Wave II matters more than the next few candles.
Both scenarios still allow for one more push lower.
The difference is not whether a new low can occur.
The difference is how the market gets there.
The conservative scenario assumes that Wave II is nearing completion and only requires one final corrective leg before the larger bullish cycle resumes. Under this view, the correction consumes less time, reaches its final low sooner, and allows the market to transition into higher long-term targets more quickly.
The aggressive scenario suggests that the market is developing a bearish impulse.
In this count, Wave (1) appears complete and the current recovery is considered Wave (2). If this structure is confirmed, Bitcoin could still unfold a full five-wave decline through Waves (3), (4), and (5) before Wave II finally completes.
Both paths point toward the same destination.
The disagreement is not about the long-term direction.
The disagreement is about structure.
Is Bitcoin completing the final portion of a correction?
Or is the market preparing for a larger impulsive decline before the next major advance begins?
The answer will come from the structure itself.
Until then, we follow the evidence—not the noise.
Patterns are whispering—and I'm listening.
Mr. Nobody 🎧📊
Bitcoin
1 hour ago
The Market Knows the Answer... We're Waiting for the Structure
The Market Knows the Answer... We're Waiting for the StructureBitcoin is approaching a critical point where the structure of Wave II matters more than short-term price fluctuations.
The question is not whether Bitcoin will eventually move higher.
The real question is whether Wave II has already completed—or if the market still requires one final corrective sequence before the next major advance begins.
Under the conservative scenario, the current correction is already near completion. In this view, the market is preparing for the next impulsive phase, allowing a faster transition into the larger bullish cycle and ultimately supporting higher long-term targets.
The aggressive scenario allows for additional downside through a Simple Zigzag correction.
In this case, the first impulsive decline may already be complete, while the current recovery represents Wave (2). If confirmed, the market could still develop Wave (3), followed by Wave (4) and Wave (5), completing the final leg of Wave II before the larger bullish trend resumes.
Both scenarios belong to the same larger narrative.
The disagreement is not about direction.
The disagreement is about timing.
One path suggests Wave II is nearly complete.
The other suggests the market still requires one final five-wave decline before the correction can be considered finished.
In the end, the structure will provide the answer.
We simply follow the evidence.
The loudest moves often begin when most participants are focused on the noise.
Patterns are whispering—and I'm listening.
– Patterns whisper. I listen. – Mr. Nobody 🎧📊
Bitcoin
Feb 5
Bitcoin 4H – Final Leg of the Bearish Impulse (Wave 5 of 5)
BTC update 24.06.26-24h Market Forecast (Wavelet Decomposition)Hi traders;
the reconstructed price level remains below the current market price, suggesting that the market is still trading with a positive premium relative to the model, likely due to additional short-term noise.
The spectral decomposition shows a balanced picture. The ten strongest spectral components are almost evenly split between bullish and bearish contributions, largely offsetting each other:
111.4 h: +449.74 €/day
43.4 h: −425.6 €/day
178.5 h: −409.74 €/day
580.0 h: −348.01 €/day
69.6 h: +297.04 €/day
88.0 h: +290.85 €/day
141.0 h: −268.33 €/day
362.0 h: +261.4 €/day
458.3 h: −218.37 €/day
1488.9 h: +209.92 €/day
With the strongest positive and negative cycles nearly balancing each other, the aggregate model signal remains weak. As a result, the overall expectation is for mostly sideways price action over the next 24 hours, with no dominant directional cycle currently in control.
XAGUSD | The Final Wave Is Whispering... Are You Listening?The higher timeframes already outlined the broader direction.
Now the 4H chart reveals the final details.
At this stage, the focus is not on calling an exact bottom. The objective is identifying the completion zone of a Leading Diagonal and waiting for the market to confirm the next structure.
The current decline remains consistent with a 5-3-5-3-5 Leading Diagonal count.
As long as the Elliott Wave rules remain intact, the primary count remains valid.
Wave (5) may be approaching completion in the current region, but a deeper extension cannot be ruled out. If additional downside develops, it does not automatically invalidate the count. Instead, the market may be constructing a more complex terminal sequence through a Double Zigzag (WXY) or even a Triple Zigzag (WXYXZ).
One rule remains critical:
Wave 3 cannot be the shortest motive wave.
Because of that, any additional decline must still respect the internal proportions required by the diagonal structure.
What matters most is this:
I'm not looking for a new bull market yet.
I'm looking for the first corrective structure that follows the completion of this diagonal.
That correction may become the first clue that the larger bearish sequence has finally reached exhaustion.
The market hasn't made its final decision.
The structure is still unfolding.
The evidence will speak first.
Patterns are whispering—and I'm listening.
– Patterns whisper. I listen. – Mr. Nobody 🎧📊
Silver / U.S. Dollar
May 19
XAGUSD | 4H Wave Map — A Two-Layer Look at Structure
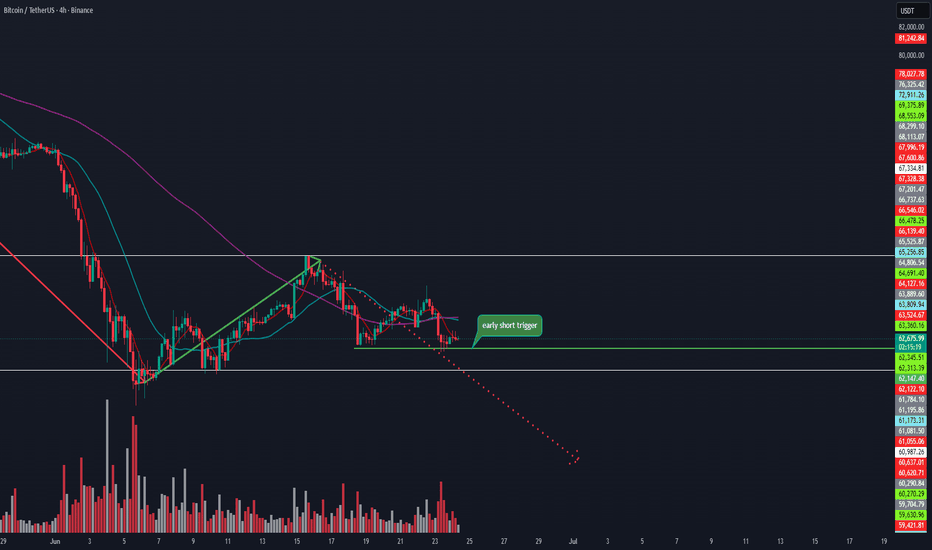
Bitcoin Analysis: Downtrend Likely to ContinueBitcoin Analysis
Date: June 24, 2026
4-Hour Timeframe (Overall Analysis):
We are currently in a downtrend on Bitcoin. The red line represents the main bearish movement, while the green line shows the corrective phase of this downtrend.
It appears that the corrective phase may have completed, and we are potentially ready for the second wave of the downward move.
Volume analysis supports this view: volume increases on every decline and decreases during upward moves. This clearly confirms that volume is still backing the downtrend.
All these factors together encourage us to align with the prevailing bearish trend.
Breaking the previous low could serve as a continuation trigger. However, because the key support zone between $60,300 – $61,000 is very significant, there is a risk that price could spike through this level with a highly emotional candle, causing us to miss the entry.
Therefore, the better approach is to take a controlled risk and use an earlier trigger for entry.
15-Minute Timeframe (Entry Trigger):
We can open a short position upon breaking the support at $62,345.
Place the stop-loss behind the previous high or the significant rejection point formed during the breakout. The stop-loss size should be calculated so that we achieve a minimum 2:1 reward-to-risk ratio by the time price reaches the next major support level. This allows us to move the position to breakeven (risk-free) as soon as possible.
XAUUSD | Leading vs Extended Diagonal — Two Paths Toward Wave A Gold is currently trading in a region that may represent the final stage of a larger bearish cycle and the beginning of Wave A within a higher-degree corrective structure.
The aggressive scenario anticipates a Leading Diagonal developing with a classic 5-3-5-3-5 internal structure. In this case, the fifth wave could either become truncated or briefly extend below the current lows before completing the decline.
The conservative scenario allows for the development of an Extended Diagonal, where Wave 5 stretches further and produces additional downside pressure before the larger structure is completed. While this path appears more bearish in the short term, it still supports the idea that the market is approaching the end of a major decline and preparing for Wave A.
As long as price remains inside the corrective channel, both scenarios remain valid. Confirmation will come from a decisive structural break and impulsive behavior on the upside.
The market has not revealed its final answer yet, but the wave structure suggests that an important bearish phase may be approaching completion.
– Patterns whisper. I listen. – Mr. Nobody 🎧📊
XAUUSD | Leading vs Extended Diagonal — Two Paths Toward Wave A Completion
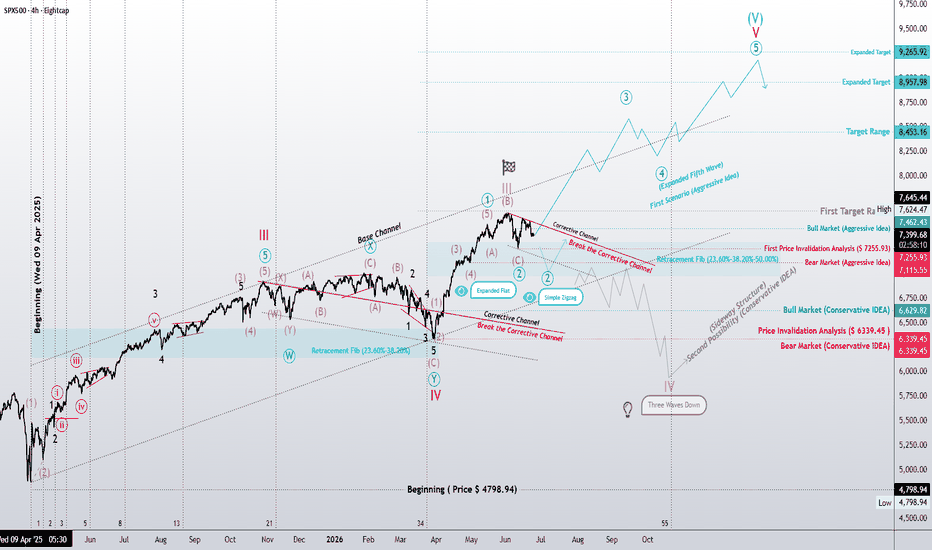
Beyond Elliott Wave: The Macro Correlation PlaySPX500 4H Strategic Analysis
Attention Traders,
Here is my latest deep-dive into the SPX500 4H chart. We aren’t just looking at price action; we are reading the “blueprint” of market energy.
Technical Breakdown:
The current structure presents two high-probability paths:
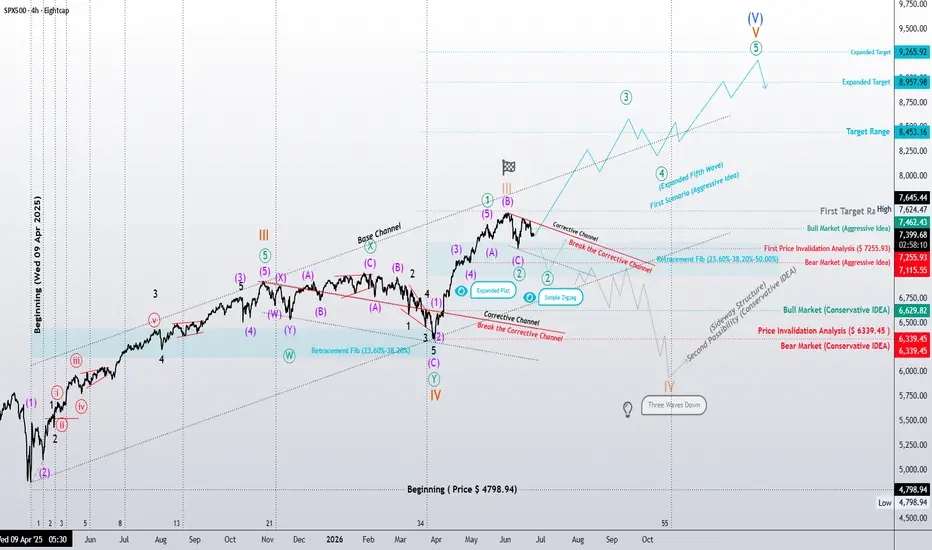
The Aggressive Scenario: A potential Expanded 5th Wave completion, targeting key liquidity zones at 8,957 and potentially reaching as high as 9,265.
The Conservative Scenario: A transition into a larger Wave IV sideways structure (potentially a Flat or Triangle), which could see a deeper correction toward the 6,339 level.
The Macro Edge (The Secret Sauce):
The real alpha lies in the DXY-SPX500 Correlation. We are monitoring the interplay between the US Dollar Index and Equities. Currently, as long as the DXY remains in its macro Wave 1/2 buildup, the SPX500 can maintain its bullish trajectory. However, we must be prepared for the “Energy Shift”—the moment DXY enters its explosive Wave 3, which typically triggers a major corrective phase in the equity markets.
Final Outlook:
What we are witnessing is a “minimal progression” phase, setting the stage for a much larger convergence. Stay disciplined and watch the levels.
Disclaimer: This analysis is for educational purposes only and does not constitute financial advice.
BTC/USD — Multi-Cycle Fibonacci AnalysisTechnical Side of the Book
Looking at Bitcoin's entire price history on the monthly chart, three distinct bull cycles emerge:
Cycle 1: From 2015 to 2018. Peak was $20k and bottom was $3k which is Fibonacci 0.382.
Cycle 2: From 2019 to 2021. Peak was $65k and bottom was $16k which is between Fibonacci 0.382 and 0.5.
Cycle 3: From 2023 to 2026. Peak was $118k and we're reaching to bottom.
The pattern is consistent, every post-peak bear market has found its bottom between the 0.382 and 0.5 Fibonacci retracement levels of the preceding bull cycle.
Not only that, but there is also a secondary pattern that has appeared three times without fail, the bear season. From cycle peak to cycle bottom has lasted approximately 365 days each time.
Post-2018 peak: ~365 days to bottom
Post-2021 peak: ~365 days to bottom
Post-2026 peak (Jan 2026): 365-day window points to September 2026 as the projected bottom
When I look at the Hodrick-Prescott moving average tool, I also see that Bitcoin has potential to bottom around the $58k level. (There is room for a negative deviation of about 20% from $58k which actually corresponds to the Fibonacci 0.382–0.5 range.)
On Chain Side of the Book
The Long-Term Holder (LTH) supply shows LTH supply currently sitting near all-time highs. This means smart money is not selling. Historically LTH supply peaks during accumulation phases at or near cycle bottoms. This is what we are seeing right now. When price drops toward the Fibonacci support zone while LTH supply going to peak it signals that conviction holders are absorbing sell pressure.
The Realized Price currently sitting near $56k. This is not a coincidence since it aligns exactly with the 0.382 Fibonacci retracement level of the current cycle which I've mentioned before. Historically, Bitcoin trading at or below its Realized Price has marked every major bear market bottom. We are not there yet but we are approaching the zone.
Macroeconomic Side of the Book
On the macro side recent geopolitical developments are actually constructive for risk assets like Bitcoin. The Trump administration's push to de-escalate tensions with Iran is already pulling TVC:UKOIL and OANDA:XAUUSD prices lower. Historically when traditional safe-haven assets deflate while macro uncertainty clears, capital rotates into higher risk and higher return assets. Right now we're seeing that TVC:DXY is slowly increasing which means investors going to have enough liquidity to push risky assets when uncertainty clears. I believe that Bitcoin which is now increasingly treated as an institutional asset class, stands to benefit directly from this rotation. Lower oil prices reduce inflation pressure, giving the Fed more room to maneuver another tailwind for liquidity sensitive assets like BTC.
DISCLAIMER: This is technical and on-chain analysis shared for educational purposes. Past cycle behavior does not guarantee future results. Do your own research and manage risk accordingly.