🇺🇸 DXY | Short-Term Strength or the Start of a Larger Move? ⏱️ Reading time: about 3 minutes
In this update, we are taking another look at the DXY structure, this time with greater focus on the behavior we are seeing from the U.S. dollar in the short term.
At the moment, significant short-term strength is visible, and price is approaching several important levels marked on the chart.
But from an Elliott Wave perspective, simply seeing price move higher is not enough for us.
The key question is:
Is this advance the beginning of a new bullish structure, or is it simply part of a correction before a deeper decline?
🟦 Scenario 1 — Bullish Case
If DXY can break through the confirmation levels and then develop a valid motive structure, the recent strength would become much more significant.
In that case, the bullish scenario could develop beyond a simple corrective move and potentially create the conditions for a larger bullish structure.
But to reach that conclusion, the market needs to build the required structure itself.
Under such conditions, dollar strength may not remain limited to DXY and could potentially be reflected in the behavior of other markets as well.
From my personal perspective, one area worth watching is the behavior of oil and capital flows in the Gulf region, along with the reaction of other dollar-sensitive assets.
This does not mean there is a fixed or certain relationship. Rather, these relationships can serve as clues when examining how different markets are behaving together.
⬛ Scenario 2 — Bearish Case
On the other hand, an important possibility remains that the current rise in DXY is simply part of a corrective structure.
If price fails to develop a strong bullish structure and turns lower again, the deeper bearish scenario could regain importance.
In that case, structures such as a Simple Zigzag or Double Zigzag could still be considered as part of the larger correction.
So even if the dollar rises in the short term, we cannot conclude from price direction alone that the larger trend has changed.
The quality of the structure matters more than the direction of the move itself.
🔄 DXY Footprints Across Other Markets
In my own observations, I have seen the relationship between DXY and gold, oil, and the cryptocurrency market change across different periods.
But this correlation is not always the same.
Sometimes dollar strength can occur alongside strength in another asset, sometimes an inverse relationship develops, and at other times two markets may move in the same direction for a while before their relationship reverses.
That is why I do not treat these relationships as fixed market laws.
For me, the structure of each individual market against the U.S. dollar remains the key factor.
If DXY develops a bearish structure, then—provided the corresponding structures confirm it—the possibility of strength in gold, oil, or cryptocurrencies may become more relevant.
But even then, an asset may initially move alongside the dollar and later reverse its path. Everything depends on the internal structure of that particular market.
🌍 A Personal View of the Future
From my personal perspective, global markets are more than just a collection of charts. Behind these movements are economic decisions, capital flows, energy resources, technology, and the choices made by the global community.
In the future, changes in energy, technology, and especially artificial intelligence may influence the way capital flows and assets are valued.
But this part is my personal view of the future and should not be interpreted as a certain prediction.
When analyzing the market, we still follow the same simple principle:
We see the structure first; then we build the scenario.
For now, DXY's short-term strength is significant, but we need to see whether this strength develops into a valid bullish structure, or whether it ultimately proves to be only part of a correction before a deeper decline.
The market will give us the answer through its structure.
Structure First. Scenario Second.
Patterns whisper. I listen.
— Mr. Nobody
U.S. Dollar Currency Index
Jul 6, 2023
Big Correction DXY
US Dollar Index
7 days ago
DXY 2H | The Next Structure Will Define the Larger Path
 Short
Short
 Short
Short
ONDO: $0.485 Is the Confirmation LevelONDO is trading around $0.43, but the important part of the current setup is slightly higher: $0.48546.
That is the level marked on the daily chart as the confirmation of the missing Wave (Y). Until price clears it, the projected upside remains a scenario rather than a confirmed continuation.
Fundamental / News Catalyst
Ondo's tokenization business has had several notable developments in September.
On September 21, Ondo announced in-kind conversion for institutional clients, allowing eligible institutions to mint and redeem tokenized stocks and ETFs directly against the underlying securities rather than first converting through cash. The initial implementation supports Ethereum and BNB Chain.
A few days earlier, Ondo's subsidiary Oasis Pro Markets became the first tokenization platform to join DTCC's Fund/SERV, a network that processes more than 85% of U.S. mutual-fund transaction activity. The integration is intended to connect Ondo's tokenized funds with traditional fund-distribution infrastructure.
Ondo also went live on near.com and NEAR Intents on September 22, bringing 20 tokenized stocks, ETFs and commodity-linked products into the platform. Ondo says its platform now has more than $1 billion in TVL and more than $26 billion in cumulative trading volume.
These developments strengthen the broader tokenization narrative, but they are separate from the technical confirmation on the chart.
Technical Analysis
The daily structure shows ONDO completing a large corrective sequence from the late-2025 highs into the $0.20 area, followed by a recovery and a developing structure higher.
The current count is looking for a missing Wave (Y).
Price is currently around $0.43, just below the key $0.48546 level marked as the confirmation of the missing Wave (Y).
This makes $0.48546 the immediate level that matters.
If price confirms the structure above that area, the first marked target is $0.65650.
The second target sits at $0.86736, corresponding with the 0.618 extension shown on the chart.
There is also a clearly defined invalidation level at $0.29016. A move below this level invalidates the current Triangle of Wave (X) count.
So the setup is relatively straightforward: the structure is developing, but the missing Wave (Y) still needs confirmation.
Key Levels
$0.48546 — Confirmation of missing Wave (Y)
$0.65650 — Wave (Y) first target
$0.86736 — Wave (Y) second target / 0.618
$0.29016 — Wave (X) triangle count invalidation
Bullish Scenario
A sustained move above $0.48546 confirms the missing Wave (Y) according to the current count and opens the path toward $0.65650, followed by $0.86736.
Bearish Scenario
Failure to confirm the Wave (Y), followed by a move lower, would keep the current structure unresolved. The key invalidation sits at $0.29016.  Long
Long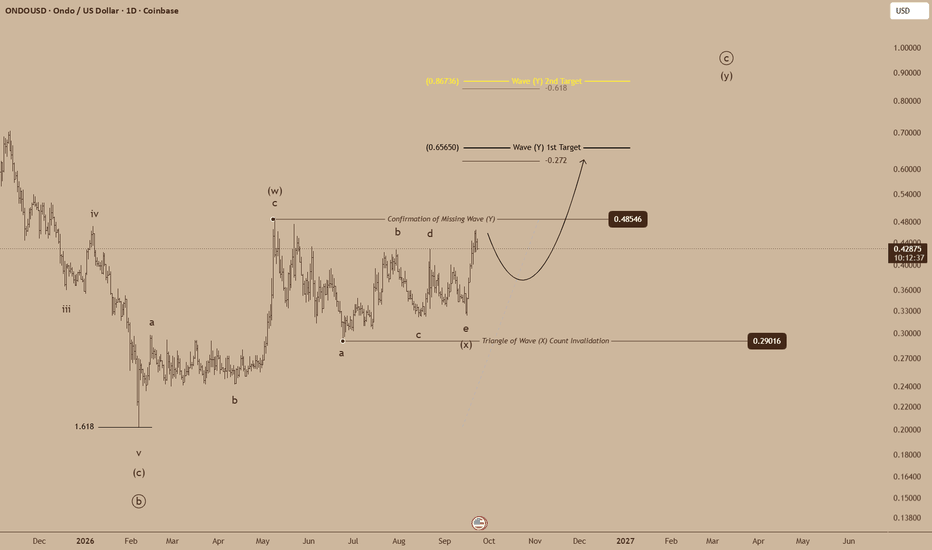
NEAR: $5.45 Is the Next Target if Rally ContinuesNEAR has accelerated sharply from the August lows, reaching $4.6585 on the supplied daily chart. The move has now brought price into the next important area of the Elliott Wave structure, with $4.3953 as the immediate reference and $5.4569 as the next marked target.
Fundamental / News Catalyst
The recent move has coincided with several developments around NEAR's cross-chain infrastructure.
On September 23, NEAR was deployed on Hyperliquid's spot market, adding NEAR/USDC trading alongside the existing perpetual market. Reporting on the launch showed roughly $344 million of NEAR perpetual open interest on Hyperliquid, highlighting the significant derivatives activity surrounding the token.
NEAR also recently expanded its Intents ecosystem through an integration with Ondo Finance, allowing eligible users to access tokenized U.S. stocks, ETFs and commodity-linked assets through NEAR's infrastructure.
These developments provide a stronger fundamental narrative around NEAR's cross-chain and financial infrastructure, but the chart remains the primary guide for the current setup.
Technical Analysis
The daily structure shows NEAR advancing from the $0.8415 swing low, which is marked as the invalidation area for the broader macro triangle and daily impulse.
The initial advance developed into a five-wave structure before a larger (b) correction unfolded through the summer. Price has since reversed sharply from that correction and is now progressing higher in the (c) wave.
NEAR has already moved through the $4.3953 level and is now trading around $4.66, leaving $5.4569 as the next marked upside reference.
The chart also identifies a higher validation area at $8.9862. A move beyond $6.8695 would trigger the alternative count, which places $12.7740 as its first target for Wave (iii).
That distinction matters: the current count and the alternative count are not the same path. The chart therefore has specific levels where the interpretation changes rather than relying on a single unconditional projection.
Key Levels
$5.4569 — Next marked target
$6.8695 — Level beyond which the alternative count is triggered
$8.9862 — Bullish continuation validation area
$12.7740 — Alternative-count Wave (iii) first target
$0.8415 — Macro triangle / daily impulse invalidation area
Bullish Scenario
NEAR continues to hold above the current structure and advances toward $5.4569. Further strength through $6.8695 would trigger the alternative count, while $8.9862 is the chart's broader bullish continuation validation area.
Bearish Scenario
Failure to sustain the current advance would challenge the developing (c) wave structure. The larger daily structure remains invalidated only if the $0.8415 swing low is breached.  Long
Long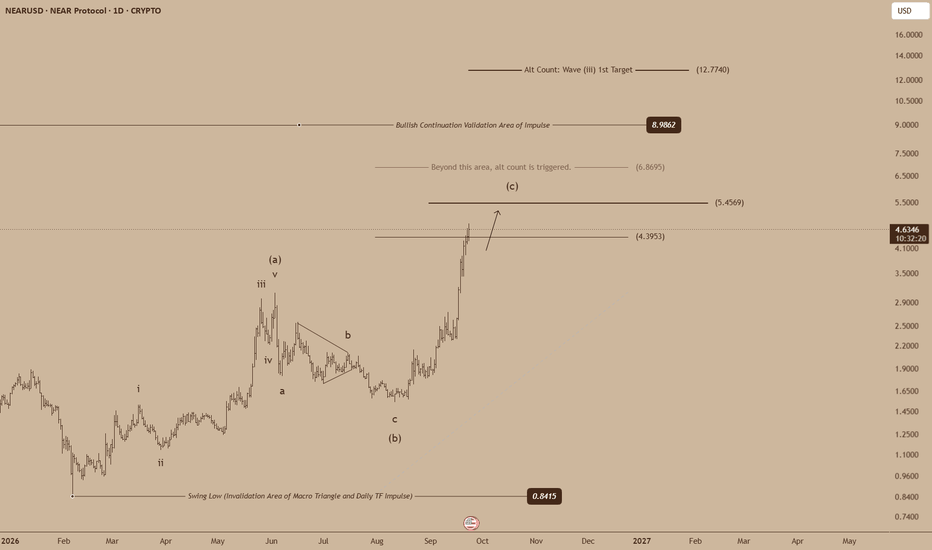
 Short
Short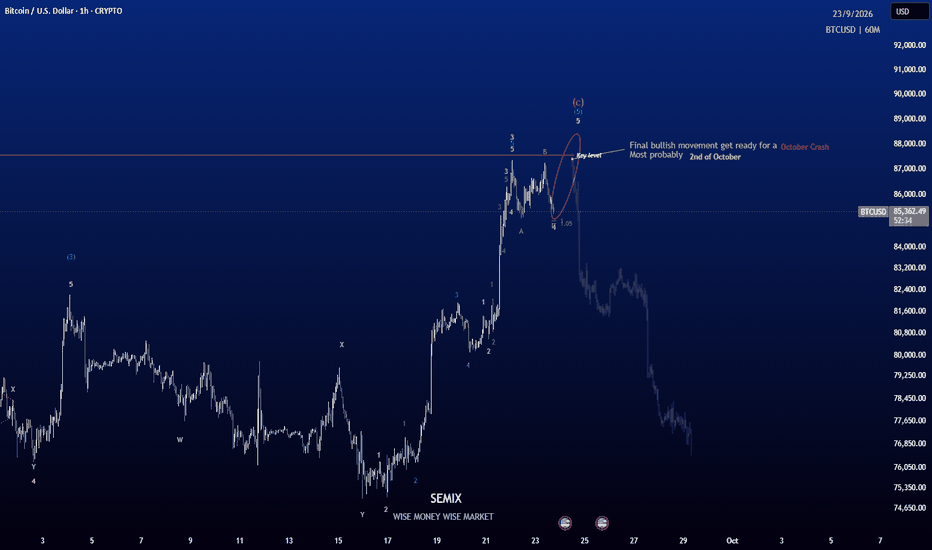
Gold: Listening to the Structure Behind the Next Move⏱️ Reading Time: ~2 minutes
Bullish and Bearish Scenarios | Elliott Wave Principle
At the current stage, two primary structures remain under consideration. The key point is that price structure must determine which scenario gains greater validity, rather than direction alone.
🟦 Bullish Case
The market may be completing a corrective structure in the form of a Classic Zigzag, with the recent advance representing part of Wave C.
An important observation is that Wave C has so far retraced only approximately 61.8% of the powerful initial decline. Therefore, this advance alone is not sufficient to confirm a sustained bullish move.
If the current bullish structure holds and gradually develops into a valid motive pattern, we may be witnessing the early stages of a larger upward movement. It is also possible that the market is completing Wave II before an extended bullish move.
Within this scenario, the internal structure of the wedge may become complex, potentially involving a Triangle or several nested patterns. For this reason, the wedge’s appearance alone is not enough to reach a conclusion. What matters is how the waves develop across the smaller degrees.
🟥 Bearish Case
On the other hand, the Triangle visible on the chart may already be complete. If so, the market could be preparing for another decline, potentially with greater momentum.
From a higher-degree perspective, if the recent decline is interpreted as a Leading Diagonal, the subsequent advance may simply be a sharp correction.
This is precisely why, within the bullish scenario, we are also examining the current advance as a possible Impulse. Leading Diagonals are often followed by sharp corrective movements, and the market’s next structure will help us distinguish between these possibilities.
If the daily structure is part of a larger Zigzag, the current advance may represent only a portion of the correction. Once that correction is complete, another bearish wave could begin.
🔍 Structure Over Forecast
Gold’s behavior should also be observed alongside the U.S. Dollar, Crude Oil, and even the cryptocurrency markets. Correlations between these markets may provide additional clues, but structure remains more important than correlation or prediction.
Sometimes, a wedge can develop in either direction. Ultimately, the path will be determined by the strength of the price movement, the internal wave structure, and the way buying and selling orders are absorbed or accumulated.
For now, patience remains essential. We will wait for the market to reveal its next structure.
Patterns whisper. I listen. – Mr. Nobody 🎧📊
Gold Spot / U.S. Dollar
2 days ago
Gold | Structure Before Direction
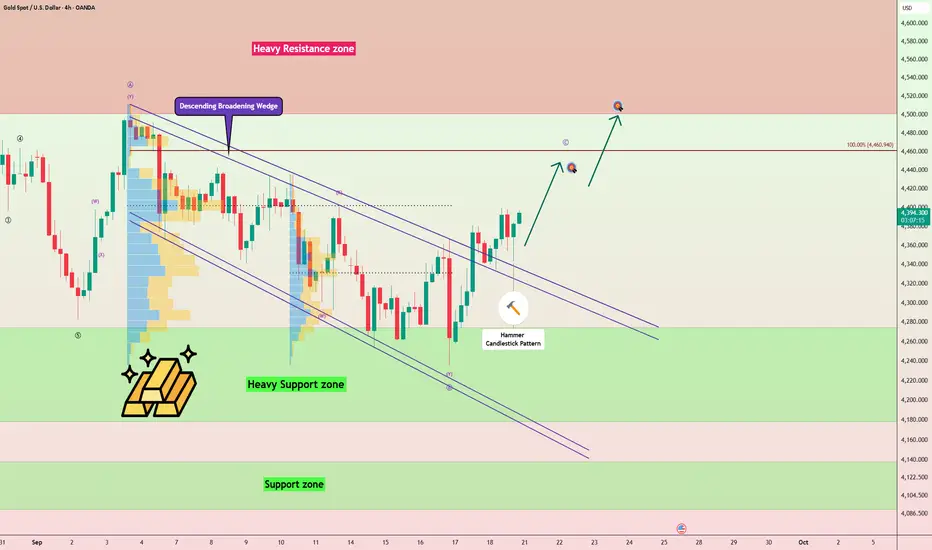
Gold Breaks the Broadening Wedge — Is $4,500 Next?Gold ( OANDA:XAUUSD ) has successfully broken above the upper trendline of the Descending Broadening Wedge Pattern and is currently trading above the pattern.
This breakout could signal the beginning of another bullish move during the final trading hours of the week and potentially into next week.
Can gold confirm the breakout above $4,400 and extend its rally toward $4,487?
Technical Analysis
The breakout above the Descending Broadening Wedge suggests that bearish pressure may be weakening and buyers are attempting to regain control.
However, the key trading level of $4,400 remains important for confirming stronger bullish momentum.
💡 Educational Note: A breakout above a Descending Broadening Wedge can signal a bullish reversal, especially when price successfully holds above the broken upper trendline.
I expect gold to gain stronger bullish momentum after breaking above $4,400 and rise at least toward $4,443.
If bullish momentum increases, the move could extend toward $4,487.
Trade Setup
First Take Profit(TP): $4,443
Second Take Profit(TP): $4,487
Stop Loss(SL): $4,321(Worst)
Key Trading Levels: $4,330 _ $4,400
Which level do you think gold will reach first?
🟢 $4,487
🔴 $4,321
📌 Gold Analysis(XAUUSD), 4-hour time frame.
🛑 Always use proper risk management and set a Stop Loss(SL) for every position.
🚀 If this analysis helps your trading plan, a BOOST would help more traders discover it.  Long
Long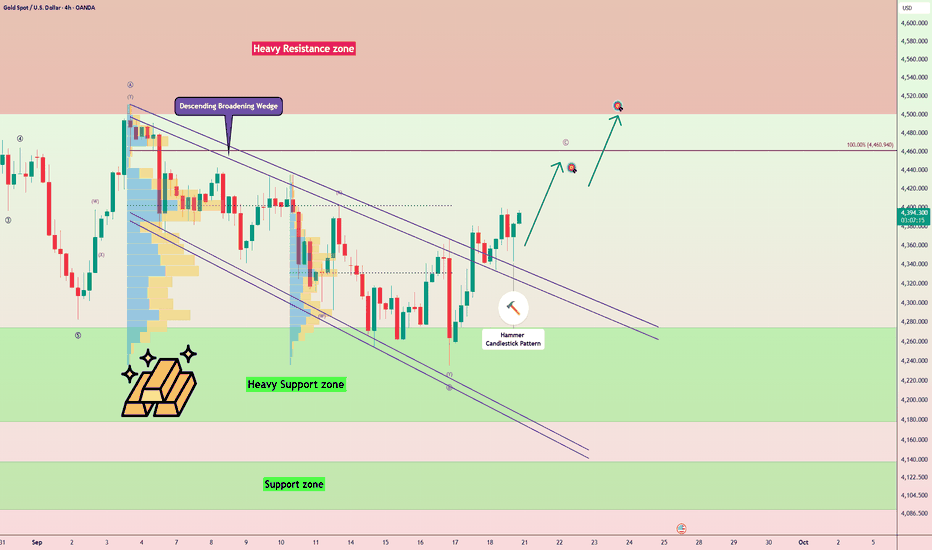
Bitcoin Surges +7% — Is $85K a Breakout or a Bull Trap?Bitcoin ( BINANCE:BTCUSDT ) has gained more than 6–7% over the past few hours, building strong bullish momentum.
However, the rally is now entering a major technical resistance structure, while recent regulatory uncertainty and mixed institutional flows remain important risks.
Can Bitcoin establish itself above $85,000, or is the current move setting up another correction?
Macro Outlook
From a fundamental perspective, downside risk has not disappeared.
Bitcoin ETF flows have recently been volatile rather than consistently bullish, while the failure of the CLARITY Act to advance in the U.S. Senate has added further regulatory uncertainty.
For this reason, the current rally still needs confirmation before a sustained bullish continuation can be assumed.
Technical Analysis
Bitcoin is currently trading inside the Heavy Resistance Zone($84,500-$79,350), near the major Potential Reversal Zone(PRZ) , the Cumulative Short Liquidation Leverage($85,400-$82,300), and the Resistance Lines.
There is also a possibility that Bitcoin could finally fill the upper CME Gap($84,560-$83,215) after several months.
From an Elliott Wave perspective, Bitcoin appears to be completing Primary Wave 5, while Primary Wave 3 developed as an Extended Wave.
A Negative Regular Divergence(RD-) is also visible between Consecutive Peaks, providing another warning that bullish momentum may be weakening.
💡 Educational Note: When Wave 5 approaches major resistance while a Negative Regular Divergence develops, the risk of trend exhaustion and a corrective move can increase.
I expect Bitcoin to first enter deeper into the Cumulative Short Liquidation Leverage and the major Potential Reversal Zone(PRZ), potentially filling the upper CME Gap.
A Bull Trap above the Heavy Resistance Zone is also possible before the next bearish move begins.
From this area, I expect Bitcoin to decline toward at least $79,000. If bearish momentum increases, the correction could extend toward the key trading level of $77,700.
Trade Setup
First Take Profit(TP): $79,000
Second Take Profit(TP): $77,700
Stop Loss(SL): $87,300(Worst)
Key Trading Level: $77,700
Upper CME Gap: $84,560-$83,215
Which level do you think Bitcoin will reach first?
🔴 $77,700
🟢 $87,300
📌 Bitcoin Analysis(BTCUSDT) Daily time frame.
🛑 Always use proper risk management and set a Stop Loss(SL) for every position.
🚀 If this analysis helps your trading plan, a BOOST would help more traders discover it. Short 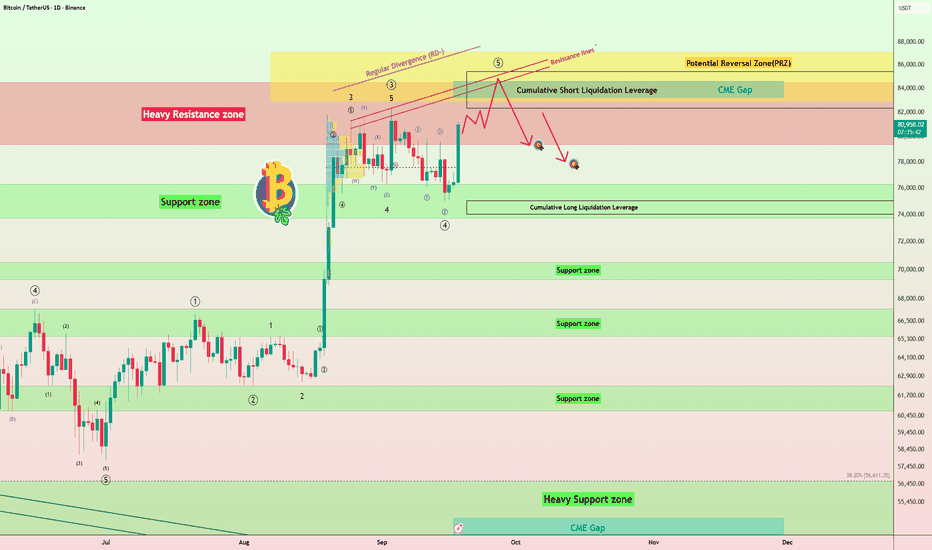
 Long
Long
ETHUSDT - The Hunt for Liquidity Ahead of the Rally BINANCE:ETHUSDT.P has transitioned into consolidation following another distribution phase. The market is forming a local consolidation range of 2,714–2,806, and within the correction, the market maker could test support before another move higher.
Bitcoin is in the spotlight. After a five-week consolidation phase, the flagship cryptocurrency has transitioned into distribution and reached a new intermediate high. The market sentiment remains bullish.
Ethereum is consolidating within the local 2,700–2,800 range. The trend remains bullish, while volumes are relatively high. Within the correction, price could form a long squeeze of the key liquidity and support zone...
Resistance levels: 2,806, 2,900, 3,000
Support levels: 2,714, 2,666, 2,565
A retest of the 2,714–2,666 zone aimed at hunting liquidity could end with a long squeeze and a return to the buying zone. Price consolidation above 2,700 could trigger further upside toward 2,900–3,000 within the broader trend.
Best regards, R. Linda!  Long
Long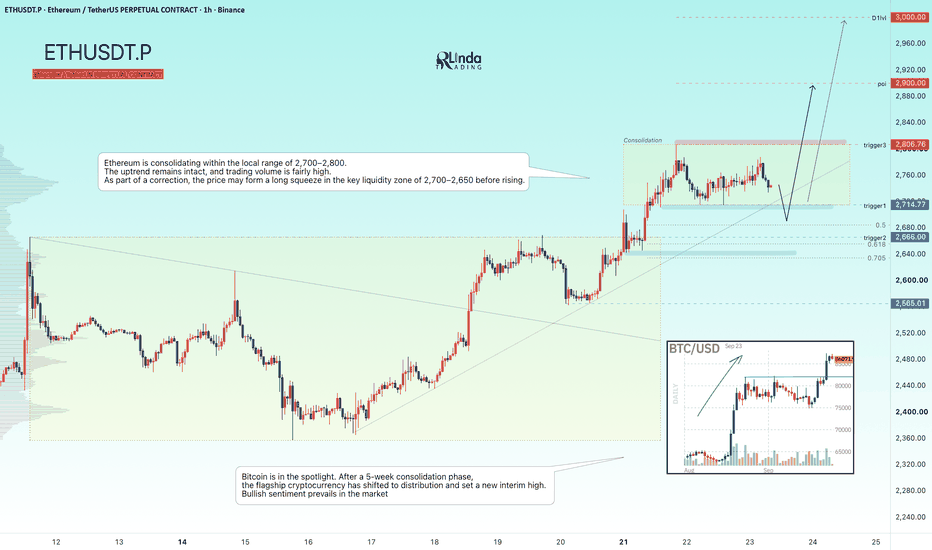
MCX Natural Gas Price Forecast 2026–2027🟢 2020–2022: Five-Wave Impulse
From the 2020 low near 110.5 , Natural Gas developed a clear five-wave advance into the 2022 high near 801 . Wave I advanced from 110.5 to approximately 251.3, followed by Wave II correcting to around 165. Wave III then extended strongly from 165 to approximately 485, followed by Wave IV, which declined to around 265.5. Finally, Wave V advanced from 265.5 to the major 2022 peak near 801, completing the larger 5-wave impulse .
🟢 2022–2026: Development of Wave B
Following the completion of the five-wave advance at the 2022 high near 801 , Natural Gas began a larger corrective phase. Wave A declined from approximately 801 to 128.5 , followed by Wave B , which recovered from 128.5 to approximately 632 by 2026. Within this Wave B, the advance is interpreted as a W-X-Y corrective structure , rather than a conventional five-wave impulse. Wave W advanced from around 128.5 to approximately 410, Wave X corrected back toward the 250–260 area, and Wave Y then advanced toward 632. This gives the larger structure as A(5) → B(W-X-Y) , with the 632 high potentially marking the completion of the main Wave B.
🔴 2026–2027: The Potential Wave C Decline
With the larger Wave B potentially completing near 632 in 2026 , Natural Gas may now be developing the next major Wave C of the larger correction. The current working count treats the decline from 632 as a potential five-wave impulse , but the internal structure is still developing and needs further confirmation. Using the larger A-B-C structure, the 61.8% of Wave A gives a potential Wave C termination near 216.4 , making this an important longer-term level to monitor for the 2026–2027 scenario.
🎯 Key Long-Term Level: 216.4 — Potential Wave C termination
For intraday and day traders, the next step is to break this developing Wave C down into its daily Elliott Wave structure . I will update the daily count soon to identify the potential internal impulse structure and calculate more precise Wave 3, Wave 5, and targets for shorter-term analysis. The daily count will also help determine whether the larger Wave C toward 216.4 is developing as expected.
👉 What do you think: Can Wave C reach 216.4 by 2027?  Short
Short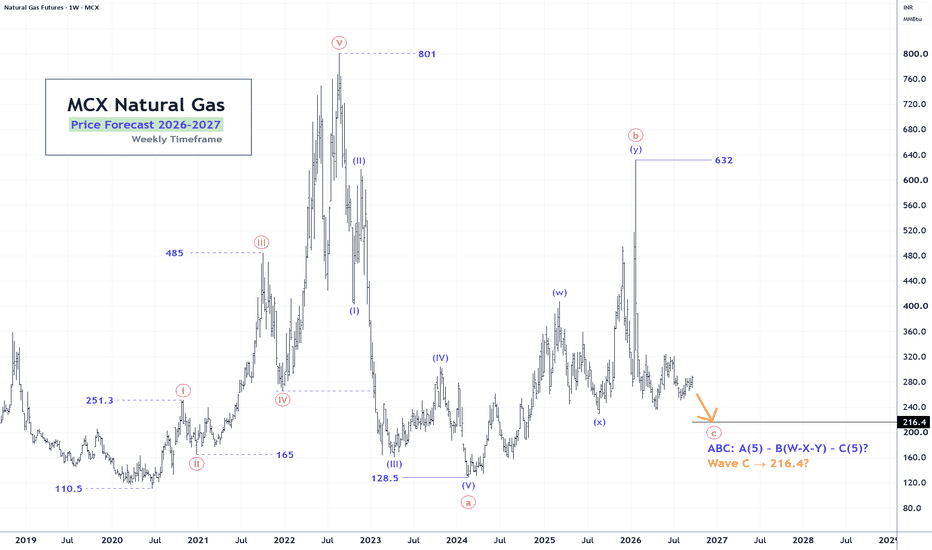
GOLD - Consolidation could trigger a distribution downwardsICMARKETS:XAUUSD is bouncing off the 4,380 resistance and consolidating within a local range ahead of a potential decline driven by the negative fundamental backdrop
The dollar is stagnating but preparing for further upside, while rising interest rates and the weak fundamental backdrop are putting pressure on the gold market. The probability of further downside toward the range support remains in place.
Gold is likely to remain range-bound as long as the conflict in the Middle East does not escalate and trigger another rise in oil prices. Support remains intact, while pullbacks are viewed as buying opportunities. The key events are the Trump–Xi meeting and upcoming Fed speakers.
Drivers:
Upside: further declines in yields, dollar weakness, diplomatic progress, falling oil prices.
Downside: rising oil prices and inflation concerns, hawkish Fed, escalation in the Middle East
Resistance levels: 4,380, 4,400, 4,434
Support levels: 4,334, 4,250, 4,200
A close below 4,334 could trigger further downside. The market remains in a medium-term bearish trend. The key area of interest is 4,250–4,200
Best regards, R. Linda! Short 
 Long
Long
Long 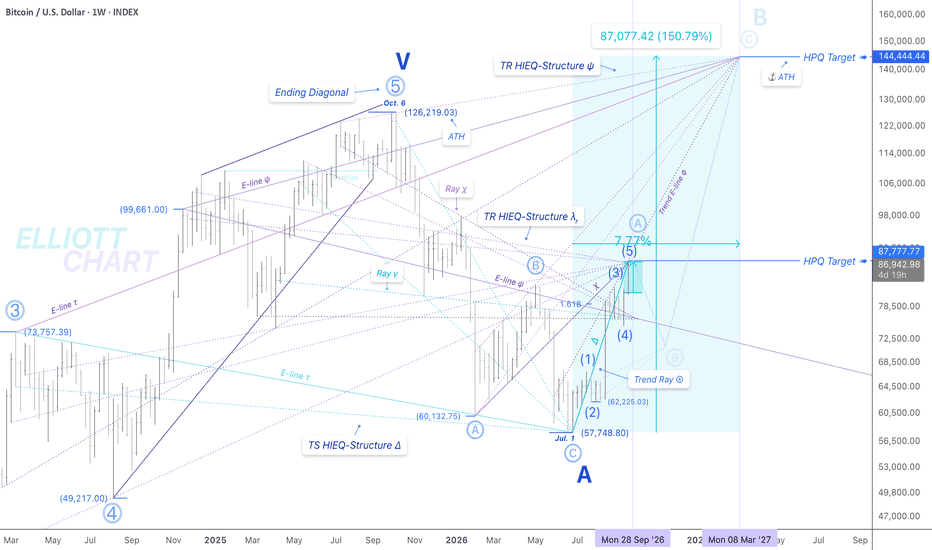
XAUUSD — Wave 5 Lower Toward 4,250
From Kelly’s view, gold remains inside a short-term bearish structure after rejecting from the 4,370 area. Price is now trading around 4,313, below the key liquidity retest level at 4,323, while the current decline continues to respect the projected Elliott Wave sequence.
The key idea is simple: the broader downside structure may remain active while price stays below the 4,325–4,335 sell zone, with Wave (5) potentially extending toward the 4,250–4,260 target area.
⟡ Market structure
Gold has formed a clear lower-high structure after failing near 4,370.
The latest bearish leg has already pushed price below 4,323, turning this level into an important liquidity retest area. A corrective rebound toward 4,325–4,335 could therefore become the next zone where sellers look for confirmation.
Below current price, the 4,298–4,305 area is the first important support and short-term buy zone. If this support fails, bearish continuation could accelerate toward the larger Fibonacci extension and projected Wave (5) completion zone around 4,250–4,260.
➤ Key levels
◌ Current price area: 4,310–4,315
◌ Main sell zone: 4,325–4,335
◌ Liquidity retest: 4,323
◌ Strong resistance: 4,365–4,375
◌ First support: 4,298–4,305
◌ First target: 4,300
◌ Second target: 4,280
◌ Main target: 4,250–4,260
◌ Invalidation: Above 4,375
⌁ Elliott Wave view
Wave (1): The first bearish leg started from the recent upper structure and pushed price lower.
Wave (2): Gold corrected back toward the 4,370 area, but buyers failed to create a new high.
Wave (3): The stronger bearish impulse is now driving price toward the 4,300 zone.
Wave (4): A corrective rebound may develop toward 4,323–4,335, where liquidity and resistance overlap.
Wave (5): If sellers defend that rebound, the final bearish leg could extend toward 4,280 and then the 4,250–4,260 Fibonacci target zone.
▸ Trading scenario
Preferred bearish scenario
Entry: 4,325–4,335 after bearish confirmation
Stop Loss: Above 4,375
Take Profit 1: 4,300
Take Profit 2: 4,280
Take Profit 3: 4,250–4,260
The cleaner plan is to wait for a liquidity retest and bearish rejection around 4,323–4,335 rather than chase the current move lower.
Alternative scenario:
If gold holds the 4,298–4,305 support and breaks back above 4,335, price could extend into a deeper corrective rebound before the broader bearish structure resumes.
◌ Invalidation
The bearish scenario would weaken if price regains sustained acceptance above 4,335. A confirmed break above 4,375 would invalidate the preferred Wave (5) continuation structure.
⌁ Kelly’s view
Kelly’s main view remains bearish while gold stays below the 4,325–4,335 resistance zone.
The first key test is 4,298–4,305. If sellers break this support, the bearish sequence may continue toward 4,280, followed by the larger 4,250–4,260 Wave (5) target.
Do you think gold will retest the 4,325–4,335 sell zone first, or continue directly toward 4,260? Short 
 Long
Long
Long 
Adobe Investment ThesisSummary
Adobe controls the industry standard creative and document software ecosystem, including Photoshop, Illustrator, Premiere, Acrobat, and Firefly AI. The stock has fallen to ~$238, largely driven by market fears that generative AI will erode Adobe’s moat and make traditional creative software obsolete.
While generative AI presents a real competitive risk, Adobe’s underlying business shows no signs of structural decline. Revenue, ARR, subscriptions, and cash flow continue to grow, yet the stock is priced for a significantly worse outcome.
Estimated Fair Value: ~$375
Preferred Entry Zone: $220–$240
Bear Case: ~$175
Bull Case: ~$500
The AI Workflow Moat
Content creation is only one piece of the chain. Professional users still require precise editing, file compatibility, brand consistency, multi user collaboration, asset management, video workflows, document tools, and enterprise controls.
The AI Orchestration Platform: Adobe’s core advantage may increasingly become managing, editing, and distributing AI generated content, rather than solely generating it.
Platform Independence: Adobe does not need to own the world's best foundational AI model to succeed it simply needs to remain the essential environment where professional creative work gets finalized and published.
Financials/Capital Allocation
High Margin Cash Engine: Adobe generates massive free cash flow with minimal physical capital expenditure requirements.
Capital Return Strategy: The company is aggressively buying back shares at depressed valuations, compounding long term value for remaining shareholders.
Why the Market May Be Mispricing Adobe
Where the Bears are Right: Generative AI lowers the skill floor required for digital creation, while fast growing competitors like Figma and Canva threaten market share.
Where the Market is Too Pessimistic: The market is assuming that weaker market dominance automatically translates into collapsing unit economics. Adobe does not need to regain its former monopoly status to deliver strong investment returns modest top line growth, high cash margins, and consistent share count reduction make the current valuation hard to justify.  Long
Long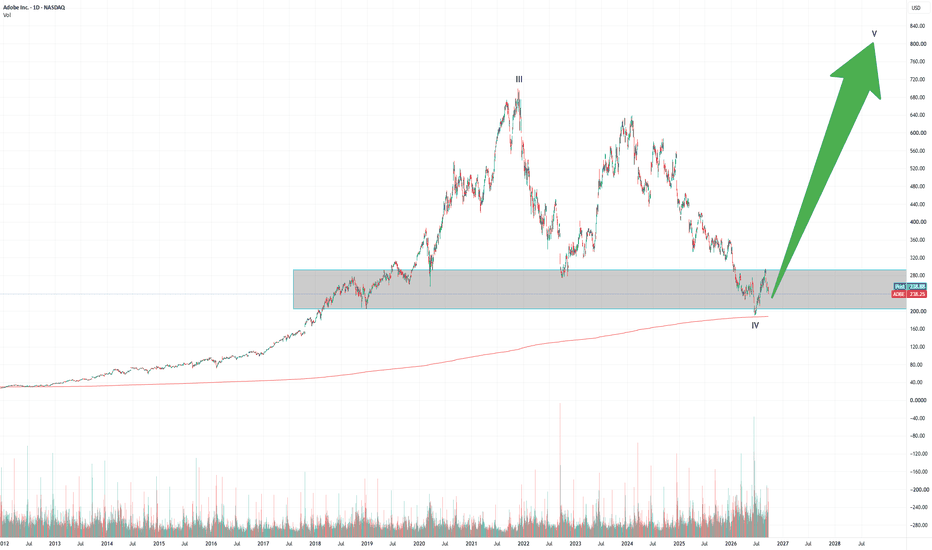
 Long
Long