$EURUSD - Falling Wedge at Resistance: Watch $1.16Hi guys! 👋
🔔 Euro has been recovering after a continuous drop since mid-January, which pushed price to a new year-to-date low at $1.13245. That decline was orderly — not a crash, not panic selling — and it left a clear technical structure behind it.
🔔 The correction formed a falling wedge, internally structured as a 5-wave ABCDE sequence. Wedges of this type are typically continuation or reversal patterns depending on where they appear in the broader trend, and this one is sitting at a locatio
Fibonacci Confluence
EurAud Technical Outlook - WeeklyWhat I see!
EUR/AUD is currently forming a falling wedge on the weekly timeframe. Price is testing the lower boundary, and the wedge has already completed four legs, meaning the next move could be the final leg that determines the eventual breakout direction.
However, the pattern is not confirmed yet.
Entering at the current level could offer a lower R:R, so I’d rather wait for confirmation. If price breaks above the upper trendline, I’ll consider looking for an entry on the retest/retraceme
S&P 500: Ascending Channel Breakdown — Retest at 7,720 ? S&P 500: Ascending Channel Breakdown — Retest at 7,720 or Direct Flush to Trendline?
**Bias Category:** Short / Bearish Channel Reaction
**Asset:** S&P 500 (SP500 / US500)
---
### The Macro & Structure Narrative
After an aggressive expansion from the September 17 liquidity lows (7,520), the index topped out inside a distribution block near 7,780–7,800. The subsequent sell-off created a sharp impulse downward, followed by a corrective upward recovery inside a well-defined ascending bear cha
PONKE Falling Wedge Breakout Attempt — 2,700%+ UpsidePONKE/USD | 2W Chart | Macro Falling Wedge
PONKE has spent most of the period following its major 2024 expansion trending lower inside what I identify as a large falling wedge.
Now the structure is reaching an interesting point.
After a prolonged sequence of lower highs and lower lows, price has pushed back toward the upper descending resistance line of the wedge. On this chart, PONKE is trading around a $14.2M market cap, making this a setup I'm watching closely for confirmation of a potenti
1INCH Macro Falling Wedge — 5 Years of Compression 1INCH/USD | 9D Chart | Macro Technical Setup
1INCH has spent nearly its entire post-2021 history trapped inside a massive descending structure that I identify as a falling wedge.
After trading above $6 during the previous cycle, 1INCH has experienced an extreme multi-year drawdown. But the important part of this chart isn't simply how far price has fallen — it's how the decline has developed.
Price has continued making lower highs and lower lows while the upper and lower boundaries of the str
ALTSEASON IMMINENT? Altcoins Massive Falling WedgeTOTAL3ESBTC | Altcoin Market vs. Bitcoin | Macro Setup
One of the most important charts I'm watching right now isn't an individual altcoin.
It's TOTAL3ESBTC — the total crypto market capitalization excluding Bitcoin, Ethereum, and stablecoins, measured against Bitcoin.
In simple terms:
When this ratio rises, the broader altcoin market is outperforming BTC.
And right now, the macro structure is getting very interesting.
A Multi-Year Falling Wedge
Since the 2021 cycle, the altcoin market ha
COTI — A Setup Worth WatchingCOTI is approaching a critical decision point on the daily chart. Price has been developing a Falling Wedge structure after an extended downtrend.
The key level to watch is 0.0205–0.0210. A strong daily close above this resistance, followed by a successful retest, would provide stronger confirmation of a bullish structure breakout.
If confirmed, the next major upside zones could be 0.030 → 0.050 → 0.074.
Invalidation remains below the key structural support.
No FOMO. No emotional entries. Le
Proof that during a strong bullish market, it's flag after flagIn my last idea I talked about how flags don't always form in their textbook shape (descending) - I mentioned they usually go up, down or flat.
Today I wanted to show that not only flags form in 3 different directions, but they also form in a variety of shapes. In the chart you can see the numbered shapes:
1 - Symmetrical triangle
2 - Ascending channel
3 - Pennant
4 - Rising wedge / ascending triangle
5 - Ascending channel
6 - Pennant
The smaller you go in time frame, the more flags and tria
HBAR on the cusp of breaking up from the long standing falling wA massive move is lining up for hbar if it can finally validate a breakout from this falling wedge it’s been in forever. If it were to flip the top trendline of the wedge to support here where it currently has a partial candle body above, the measured move target would be around 34-35 cents, almost a 4x from current price. Now I wouldn’t expect hbar to hit such a big target instantly especially since the wedge could easily be most valid on the weekly or even monthly charts due to its size. Howev
EURUSD: 4H Major Demand (SUP 78) Meets 1H Falling Wedge BreakoutEURUSD Technical & Order-Flow Analysis | 4H Tactical · 1H Trigger
━━━━━━━━━━━━━━━━━━━━━━━━━━━━━━━━━━━━━━━━━━━━
QUICK SPECIFICATIONS
━━━━━━━━━━━━━━━━━━━━━━━━━━━━━━━━━━━━━━━━━━━━
• Asset: EUR/USD (Spot FX)
• Bias: Tactical Bullish (Long / Mean Reversion)
• Entry Zone: 1.1478 – 1.1485
• Structural Invalidation (SL): 1.14470 (~35 pips)
• Target 1: 1.15000 (+18–20 Pips · First hurdle & BE trigger)
• Target 2: 1.15300 (+48–50 Pips · Tactical intermediate target)
• Target 3: 1.15550 (+72–75 Pips · Fro
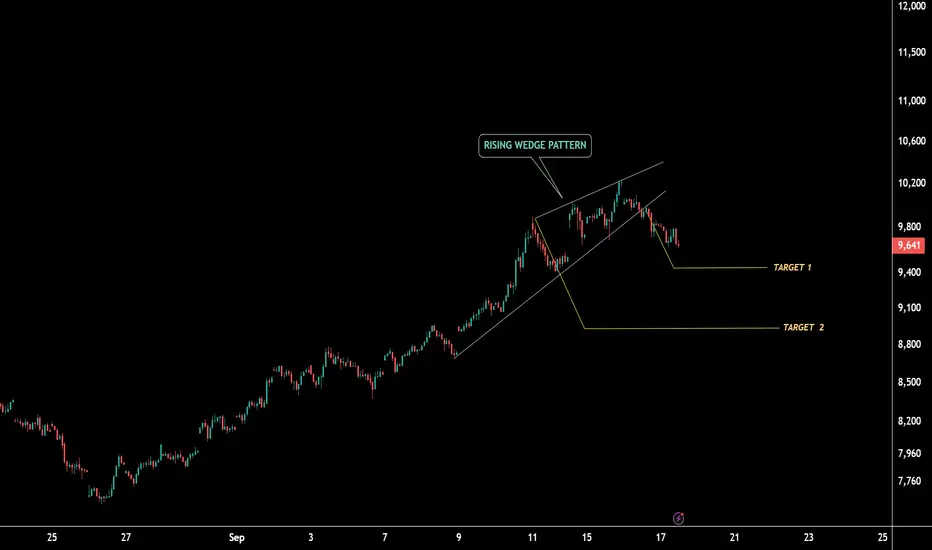
CRUDE OIL: Rising Wedge Breakdown Setup Crude Oil is showing a potential bearish reversal setup as price develops a clear Rising Wedge pattern near the ₹10,000–₹10,200 resistance zone.
Key Technical Observations
Rising Wedge Pattern
Price has been moving upward within a narrowing structure, indicating weakening momentum despite higher prices. A breakdown from the lower trendline can confirm the bearish setup.
Critical Breakdown Zone
A sustained break below ₹9,220 could trigger aggressive selling pressure and confirm the downside mo
NZDUSD TRADE PLANThere is bearish trend on 1H time frame. But I saw reversal pattern of falling Wedge, double bottom and have bullish divergence also. So may be trend will reverse from here but we still wait for confirmation till the break of last LH and will execute buy stop order then and trade accordingli.
EURUSD: Long ideaWe can see a bull pennant formation in H4 Chart on EURUSD. There is a clear flag post (bull move) up, then price is now consolidating inside a falling wedge. The support i held below twice (two green arrows on the chart) and from the top, there is a descending trend line. The probability of such a setup breaking upwards is higher than breaking downwards. Invalidation would be the break of support line, supported by green arrows.
Disclaimer: This is for information purpose only and not an inves
The Market Broke The RuleFor years, traders have been taught a simple relationship: rising yields are bad for equities. Higher borrowing costs increase the discount rate applied to future earnings, financial conditions become tighter, and expensive growth assets can come under pressure. The relationship is real, but treating it as a mechanical rule is where the analysis starts to break down.
The recent market reaction provides a useful case study. U.S. Treasury yields moved sharply higher as inflation concerns, rising
Bitcoin (BTCUSD) — Falling Wedge Inside a Bigger Range, **Bitcoin (BTCUSD) — Falling Wedge Inside a Bigger Range, Targeting a Breakout Toward 81,200+ 🟠**
**Market Structure Overview:**
BTC exploded higher from the 76,000 zone, tapped just above 82,000, then pulled back into consolidation. Since then, price has been carving out a **falling wedge** — a series of lower highs and lower lows that are converging, which is typically a bullish continuation/reversal pattern rather than a bearish one.
**What's happening on the chart:**
🔹 **Falling Wedge Pat
Gold Breaks a Falling Wedge: Is $4,470 the Next Target?Gold ( OANDA:XAUUSD ) is currently trading near the key trading levels of $4,400 and $4,370.
From a classical technical analysis perspective, gold has formed a Falling Wedge Pattern and is now trading above its upper trendline, supporting a potential bullish reversal.
Can gold confirm this breakout and extend its recovery toward $4,470?
Technical Analysis
From an Elliott Wave perspective, gold appears to have completed a Double Three Correction(W-X-Y) inside the Falling Wedge Pattern.
The b
Options Blueprint [Int]: Balancing Upside With Nearby ResistanceDirection Is Only Half of the Decision
A bullish chart does not automatically imply that the most distant bullish target should determine the trade.
This distinction becomes particularly important when price is showing evidence of upside momentum while approaching a technically meaningful resistance area. In that situation, there are really two questions: Where could price move, and what could happen before it gets there?
That distinction between direction and location is the central lesson
TAO — Multi-Year Falling Wedge | Targets to $2kBittensor (TAO) is approaching a major decision point after spending years compressing inside a large descending/falling wedge structure.
On the high timeframe, TAO has continued to print lower highs while repeatedly defending the broader support region, causing price to contract toward the apex of the structure. This type of compression can become significant when price eventually resolves through the upper descending trendline.
The important point here is that the bullish thesis is condition
EURAUD Falling WedgeWatch for this falling wedge. If the support below holds in the next few trading days and decisively breaks above the falling trend line, re-tests and shows bullish conviction, then it can be a good buy setup. Price is not letting go of the support below and getting compressed inside the wedge.
Falling Wedge Breakout Opens the Door to ATH Retest — Major HTF XRP / USD — 1W
XRP continues to show a constructive higher-timeframe structure following its breakout from a multi-month falling wedge.
The first part of this thesis is relatively straightforward: price has broken above the wedge's descending resistance and is now attempting to hold the breakout area. If that breakout remains valid, the next major technical objective is a retest of the prior all-time-high region near $3.27.
The larger structure is where the chart becomes particularly interest
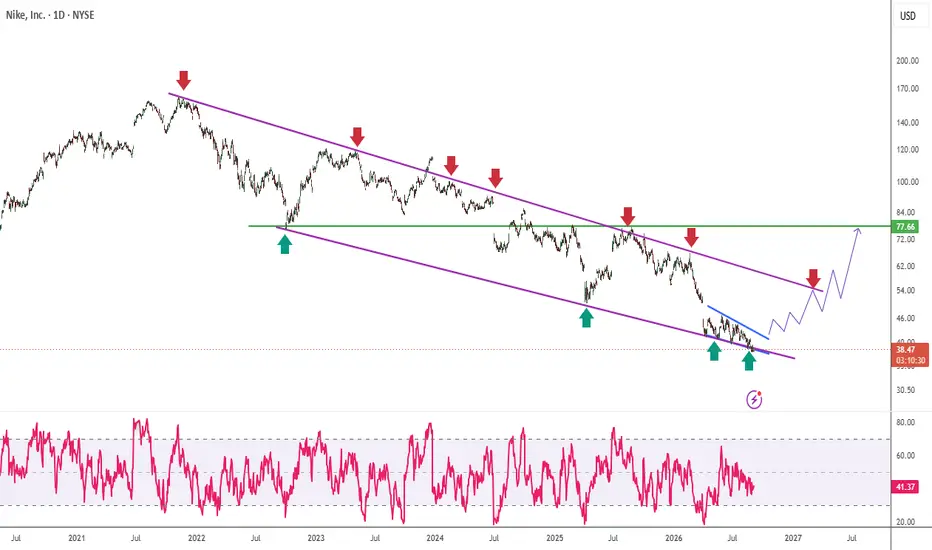
Nike (NKE) Offering Opportunity for the UpsideNYSE:NKE
🚨 Bullish Reversal Setup Building — But LH–LL Structure Still Matters
The chart is showing multiple bullish reversal confluences, but the larger trend has not yet completely shifted.
🟢 Bullish Signals
1️⃣ Daily Falling Wedge
Price is attempting to develop a Falling Wedge pattern on the daily timeframe. If price remains inside the structure and eventually breaks to the upside, it could signal that bulls are beginning to regain control.
2️⃣ Weekly Descending Channel
A broader desce