Gann
Key Trading Points for the Monthly Close!Gold prices rebounded weakly in the US session, testing the psychological support level of 4,000. Each time prices tested this level, there was some minor support, which is not unusual, and no effective breakout has yet occurred. It is true that gold is weak in the short term, but the strength of the bulls' counterattack is not weak either. Each round of pullback and decline will reserve room for us to buy at the bottom and get on board, so we can view it rationally. Those who are bearish can short on rallies, but we do not recommend chasing the market down. If a suitable opportunity arises to short on a rally, we will participate accordingly, rather than blindly buying the dip against the trend.
Current strategy: Focus on the 4040-4050 range for any rebound, as this is the first resistance level for any rebound. Secondly, pay attention to the 4070-4080 range, which is also the intraday high. The immediate support level to watch is around 4000, the intraday low, while strong support lies in the 3960-75 area. As long as the above levels are not broken, we will adopt a strategy of buying low and selling high. If a breakout occurs, we will update our strategy in real time. As the monthly chart closes, there is a high probability of consolidation and correction. Looking at the long-term trend of gold, the correction that began in April has been significant, and many people are waiting to see when the market will truly bottom out. Based on our preliminary analysis of the market, we believe that July will be a crucial turning point for the market. There is a high chance that a bottoming-out and reversal rally will occur in July. Gold prices have recently rebounded from around 3960; the key focus going forward is on the sustainability of this rebound. Key data releases for July are coming soon, with the non-farm payrolls report and Warsh's speech both expected to directly impact gold prices, requiring close attention. In terms of price levels, we have a very clear understanding of the key support levels at the bottom of gold. Friends who want to seize the opportunity can discuss and plan together. This round is likely to be a rare entry window for gold this year.
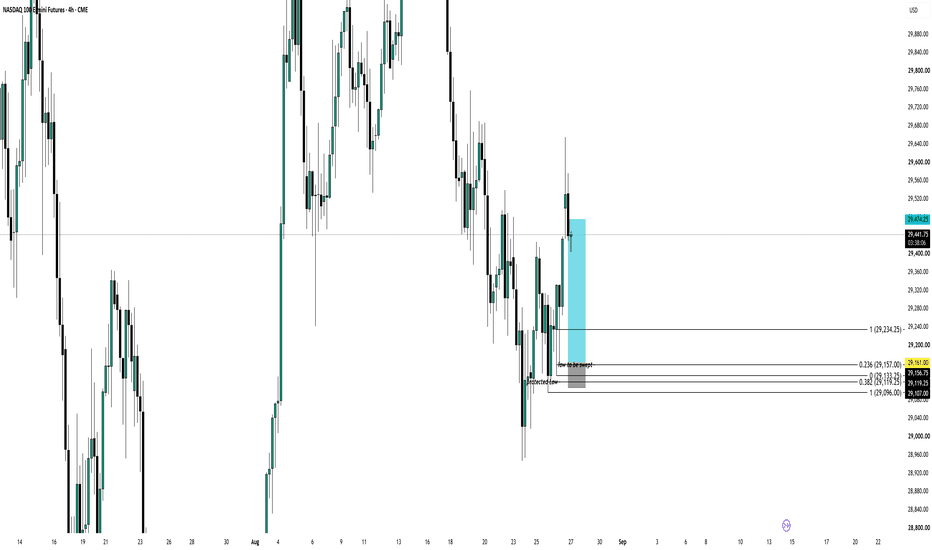
Win NQWent short twice NQ, the first 1 got stopped out then I went short again during a Macro, Once I pinpoint the best place to short consistently my growth curve will be exponential. I know where price wants/should go 4/5 days a week, it's just when it does, which is why I should probably always incorporate TIME into my trades (Macro).
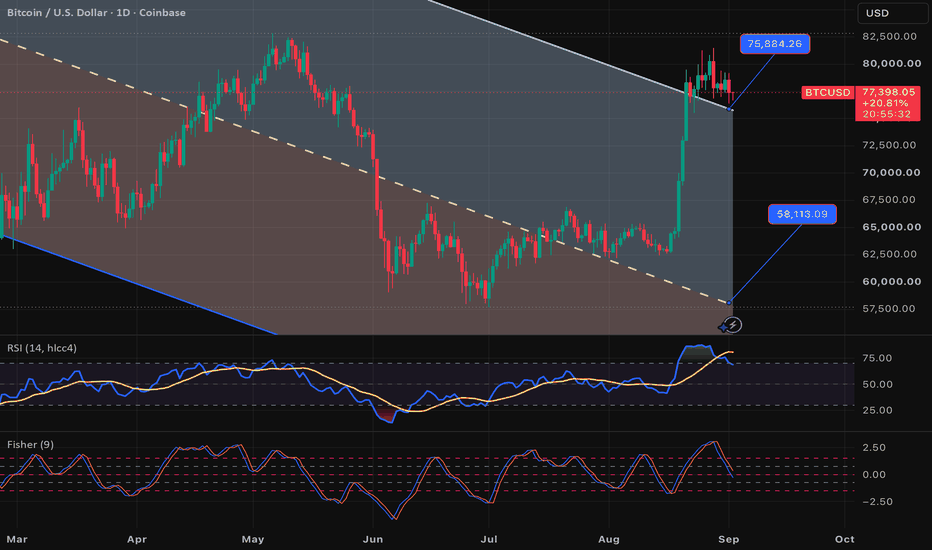
JUNE 26 Bitcoin chart analysisHello
It's a Bitcoin Guide.
My analysis is optimized for TradingView.
If you press the Replay button, you can check real-time movements.
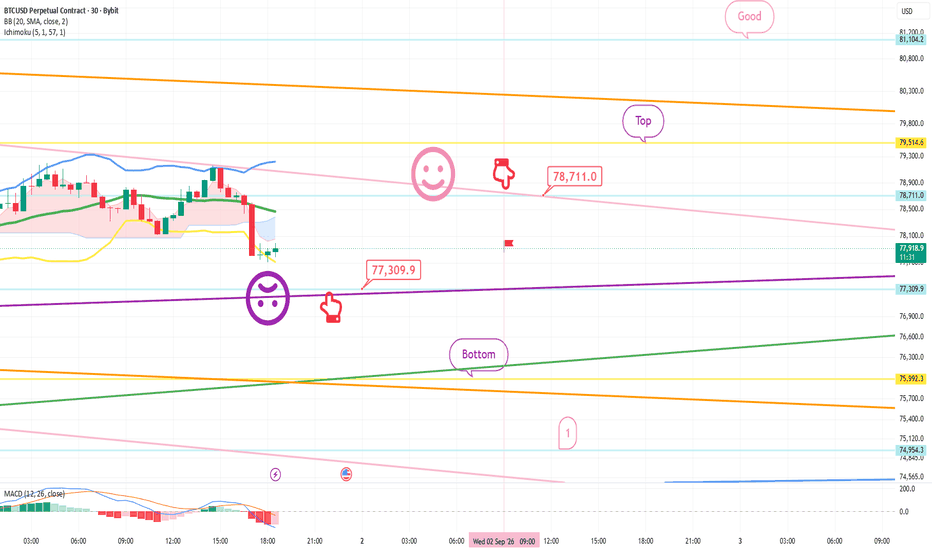
This is the Bitcoin 30-minute chart.
In the bottom left, marked with a purple finger, I have connected the strategy exactly at the entry point of the long position I entered on June 25th, which is $58,032.3.
I have provided the key plot points and prices.
*For those currently holding a long position:
1) Please pay attention to the purple parallel lines and the green parallel line support lines.
2) A vertical rise is expected if the rebound is successful after touching the marked zone 1.
A strong rise is expected if the rebound is successful after touching zone 2.
3) Since the price is open to the final bottom zone of $56,859.1 from the point of breaking the light blue support line, please check the parallel line support lines.
4) Currently, a MACD dead cross is in progress on the daily chart.
Even if it only consolidates without breaking the light blue support line,
it could rise again after tomorrow.
If the signal is ignored, it needs to touch the Top zone very strongly and rise above a "Great" level during the weekend.
5) I have left a rough movement path with the pink finger,
so I suggest you manage your position by utilizing the prices on the right.
Please use my analysis post merely as a reference and for practical use.
I hope you operate safely by adhering to trading principles and mandatory stop-losses.
Thank you for your hard work this week.
Thank you.
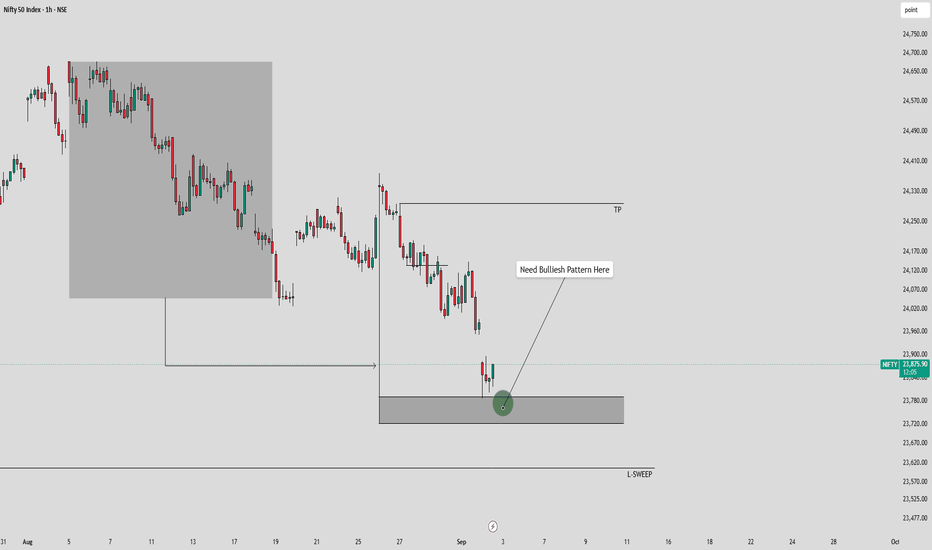
NIFTY SENTIMENT ANALYSIS FOR 29/06/2026**NIFTY Sentiment Analysis | 29 June 2026**
Most traders begin their day by asking:
*"Will the market go up or down?"*
I begin differently.
I ask,
**"What is the market trying to communicate before the move becomes obvious?"**
Today's sentiment framework suggests:
• **Bias:** Bullish
• **Structure:** Neutral
• **Behaviour:** Explosive
**Key Price Zones**
🔴 24,179.30 – Major Resistance
🟠 24,123.30 – Immediate Resistance
🟣 24,067.30 – Decision/Pivot Zone
🟠 24,011.30 – Immediate Support
🔵 23,983.00 – Major Support
**Anchor Time:** **12:50 PM IST**
This is the time window I'm monitoring for a meaningful shift in market character, momentum, or participation.
The real question today isn't whether bulls can push higher.
It's whether they can **maintain participation** after the opening strength.
A bullish opening without participation often becomes a trap.
Participation is what separates a move from a trend.
This analysis is shared **within the first few minutes of the market opening**, before the day unfolds, as part of my ongoing public research on **Price, Time & Sentiment**.
I'll revisit this chart after market hours to evaluate how the market respected the levels, timing, and sentiment.
**Remember:**
Price tells us **WHAT** happened.
Time tells us **WHEN** to pay attention.
Sentiment helps us understand **WHY** it happened.
If this idea resonates with your approach to markets, I'd appreciate hearing your perspective in the comments.
XAU/USD: Recommendation to sell high and buy low today.My recommendations:
BUY: 4010–4020, SL: 3990, TP: 4080–4110;
SELL: 4110–4120, SL: 4140, TP: 4050–4020;
Gold is expected to continue its weak, range-bound movement today. The weekly chart shows seven consecutive weeks of decline, maintaining a bearish structure. Although the daily chart closed with a slight gain on Friday, the price remains capped by resistance from the 10-day and 7-day moving averages (at 4138 and 4090, respectively), which are sloping downwards. The RSI is below the 50 mark, and the price is tracking between the middle and lower bands of the Bollinger Bands.
On the shorter-term 4-hour and 1-hour charts, gold rebounded from lows following Friday's sharp drop in the US Dollar Index. The moving averages are showing a bullish "golden cross" pattern, and the price has moved back above the Bollinger Bands' middle line. After previously being in oversold territory, the RSI has recovered to near the 50 level. While the daily and weekly structures remain bearish, the short-term charts indicate an opportunity for a rebound. The trading strategy is to sell high and buy low.
SPX Holding a Critical Demand Zone
The S&P 500 is currently trading around a significant support region after rejecting the Fair Value Gap (FVG). Price has slowed near demand, suggesting that sellers are losing momentum while buyers attempt to defend this area.
As long as the 7,235 support remains intact, the broader bullish structure is still valid. A successful reaction from this zone could trigger a move back toward the FVG, followed by a retest of 7,515 and potentially the previous highs near 7,625.
However, if support fails with strong bearish momentum, a deeper correction becomes increasingly likely. The coming sessions should provide clarity on whether this is accumulation before continuation or the beginning of a larger pullback.
xau/usd start uptrendMost traders are waiting for the news.
I'm watching the time cycle.
Gold has completed a strong reversal from 4048, and price is now approaching a critical timing window.
From my perspective, this move is not driven by headlines...
It is the result of a completed accumulation phase followed by an expansion phase.
My projected path suggests a continuation toward the 4280–4290 area over the coming sessions, provided the current structure remains intact.
What supports this idea?
✅ Higher timeframe bullish bias.
✅ Time-cycle alignment.
✅ Breakout from accumulation.
✅ Weakness in the U.S. Dollar adds fuel to Gold.
Remember:
News usually explains the move after it happens. Time often predicts it before it happens.
This is my personal market analysis, not financial advice.
What do you think?
GannDailyPipp Strategy: Trade our plan to Plan your trades...
Shree Cements Daily Trend AnalysisShree Cements is currently trading near a key price rejection zone at 25,891. If the stock fails to register a decisive close above 25,891, it may confirm a bearish outlook, with the next potential downside target around 23,785 in the coming trading sessions.
This analysis reflects my personal market view based on technical observations. Actual price
movements may differ due to changing market conditions and external factors. Please conduct your own technical analysis and follow appropriate risk management before making any trading decisions.
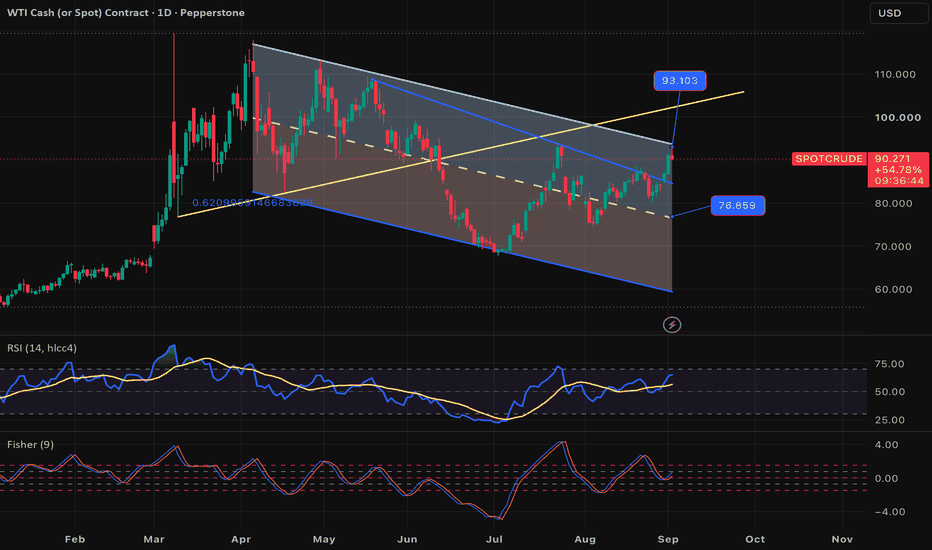
CLUSDT at Critical Support: Breakdown or Reversal?CLUSDT continues to respect a well-defined long-term descending channel, with sellers maintaining control after repeated rejections from the upper trendline. The recent breakdown below the 79 USDT support confirms a bearish market structure, turning that level into the primary resistance zone. Price remains below the descending trendline and key horizontal resistance, indicating that bulls have not yet regained momentum.
The 68-69 USDT area is now the most important support on the chart. This zone coincides with the lower boundary of the long-term channel, making it a critical demand area. As long as buyers defend this level, a short-term relief rally toward 79-82 USDT remains possible. However, any confirmed breakdown with increasing volume would likely trigger another leg lower as bearish momentum accelerates.
Volume remains relatively weak during the recent bounce, suggesting the current recovery lacks strong conviction. For a trend reversal to gain credibility, CLUSDT needs to reclaim 79 USDT, break above the descending trendline, and sustain higher trading volume. Until then, every rally should be viewed as a lower-high formation within the broader downtrend.
The overall structure continues to favor sellers while price trades below resistance. Traders should avoid anticipating reversals without confirmation and instead focus on waiting for high-probability setups supported by price action and volume. Protecting capital during established downtrends is often more important than attempting to catch the exact bottom.
Key Levels
Resistance: 79.0 USDT -> 82.0 USDT
Support: 68.0-69.0 USDT
Trend Bias: Bearish below 79 USDT. Bullish confirmation requires a breakout above resistance with strong volume.
Structural Price Analysis (The Ascending Support Line)The primary foundation of this setup is a well-defined Ascending Support Line (Trendline) stretching back across multiple months.
Validation: For a trendline to be considered highly reliable, it requires a minimum of three distinct reactionary touches. This trendline has five confirmed validation zones (marked by the red circles), showing that institutional buying interest consistently steps in at this exact geometric angle.Current Status: Price has drifted lower from its peak near ₹760 and has successfully landed right back onto this multi-month baseline around the ₹580\₹585 zone.
For study purposes, a trendline touch alone is not an immediate buy signal; it is a signal to alert and observe. Traders look for micro-confirmations to verify that structural demand is actively entering the market:
Market DNA Copper Cycle 4 Fractal 2 ObservationTitle:
Market DNA – Cycle4 Fractal 2 Structural Observation
Sub-title:
Multi-Asset Structural Progression (Fractal 1 → 2 → 3)
Metadata:
• Date: 2026-06-26 10:45 EST
• Assets: Copper (Copper)
• Cycle IDs: 4
1- Context
This document presents a structural observation across multiple Market DNA cycles.
The analysis is based on previously published and time-stamped cycle records,
tracking their progression from Fractal 1 through Fractal X.
2- Observation Summary
• Multiple assets analyzed
• Multiple cycles tracked
• Consistent structural progression observed
• Fractal 1 structures were previously defined and published.
• Fractal 2 completion observed across cycles.
• Fractal 3 currently approaching completion across multiple assets.
• Completion tends to occur within or near the trapezoidal time window.
3- Fractal Cycle Evolution (F1 → F2 → F3)
Observed Evolution:
Fractal 1 → Initial structural encoding of the cycle (M–P(c) definition and initial boundary formation).
Fractal 2 → Structural development and interaction within defined boundaries.
Fractal 3 → Activation window for structural release and completion of the primary cycle.
4- Hypothesis
Fractal 3 may represent a dominant structural activation window
where accumulated time-pressure and structural interactions
lead to directional release and cycle completion.
5- Status
This is an ongoing observation and not yet a validated law.
Further documentation and additional samples are required.
6- Cross-Asset Observation
Across all analyzed assets, Fractal 3 structures show
consistent alignment in both price interaction and time progression.
Completion tends to occur within a bounded time window,
with limited deviation.
7- Key Insight
Fractal 3 appears to act as a structural activation window,
where accumulated field pressure and temporal distortion (time bending)
interact and resolve through accelerated price movement.
8- Conclusion
Current observations indicate a consistent structural behavior
across multiple Market DNA cycles, where Fractal 3 functions
as a critical activation and completion layer.
Multiple instances have now been documented.
Further validation is required to determine whether this behavior
represents a general structural principle.
9- Disclaimer
This document is part of the Market DNA structural market research framework.
It does not constitute financial advice.