Gann
xau/usd start uptrendMost traders are waiting for the news.
I'm watching the time cycle.
Gold has completed a strong reversal from 4048, and price is now approaching a critical timing window.
From my perspective, this move is not driven by headlines...
It is the result of a completed accumulation phase followed by an expansion phase.
My projected path suggests a continuation toward the 4280–4290 area over the coming sessions, provided the current structure remains intact.
What supports this idea?
✅ Higher timeframe bullish bias.
✅ Time-cycle alignment.
✅ Breakout from accumulation.
✅ Weakness in the U.S. Dollar adds fuel to Gold.
Remember:
News usually explains the move after it happens. Time often predicts it before it happens.
This is my personal market analysis, not financial advice.
What do you think?
GannDailyPipp Strategy: Trade our plan to Plan your trades...
Shree Cements Daily Trend AnalysisShree Cements is currently trading near a key price rejection zone at 25,891. If the stock fails to register a decisive close above 25,891, it may confirm a bearish outlook, with the next potential downside target around 23,785 in the coming trading sessions.
This analysis reflects my personal market view based on technical observations. Actual price
movements may differ due to changing market conditions and external factors. Please conduct your own technical analysis and follow appropriate risk management before making any trading decisions.
CLUSDT at Critical Support: Breakdown or Reversal?CLUSDT continues to respect a well-defined long-term descending channel, with sellers maintaining control after repeated rejections from the upper trendline. The recent breakdown below the 79 USDT support confirms a bearish market structure, turning that level into the primary resistance zone. Price remains below the descending trendline and key horizontal resistance, indicating that bulls have not yet regained momentum.
The 68-69 USDT area is now the most important support on the chart. This zone coincides with the lower boundary of the long-term channel, making it a critical demand area. As long as buyers defend this level, a short-term relief rally toward 79-82 USDT remains possible. However, any confirmed breakdown with increasing volume would likely trigger another leg lower as bearish momentum accelerates.
Volume remains relatively weak during the recent bounce, suggesting the current recovery lacks strong conviction. For a trend reversal to gain credibility, CLUSDT needs to reclaim 79 USDT, break above the descending trendline, and sustain higher trading volume. Until then, every rally should be viewed as a lower-high formation within the broader downtrend.
The overall structure continues to favor sellers while price trades below resistance. Traders should avoid anticipating reversals without confirmation and instead focus on waiting for high-probability setups supported by price action and volume. Protecting capital during established downtrends is often more important than attempting to catch the exact bottom.
Key Levels
Resistance: 79.0 USDT -> 82.0 USDT
Support: 68.0-69.0 USDT
Trend Bias: Bearish below 79 USDT. Bullish confirmation requires a breakout above resistance with strong volume.
Structural Price Analysis (The Ascending Support Line)The primary foundation of this setup is a well-defined Ascending Support Line (Trendline) stretching back across multiple months.
Validation: For a trendline to be considered highly reliable, it requires a minimum of three distinct reactionary touches. This trendline has five confirmed validation zones (marked by the red circles), showing that institutional buying interest consistently steps in at this exact geometric angle.Current Status: Price has drifted lower from its peak near ₹760 and has successfully landed right back onto this multi-month baseline around the ₹580\₹585 zone.
For study purposes, a trendline touch alone is not an immediate buy signal; it is a signal to alert and observe. Traders look for micro-confirmations to verify that structural demand is actively entering the market:
Market DNA Copper Cycle 4 Fractal 2 ObservationTitle:
Market DNA – Cycle4 Fractal 2 Structural Observation
Sub-title:
Multi-Asset Structural Progression (Fractal 1 → 2 → 3)
Metadata:
• Date: 2026-06-26 10:45 EST
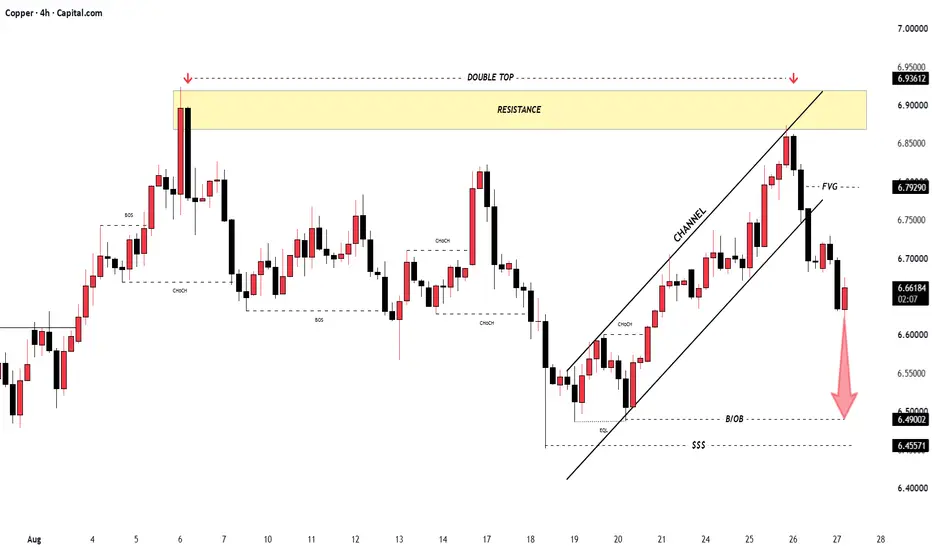
• Assets: Copper (Copper)
• Cycle IDs: 4
1- Context
This document presents a structural observation across multiple Market DNA cycles.
The analysis is based on previously published and time-stamped cycle records,
tracking their progression from Fractal 1 through Fractal X.
2- Observation Summary
• Multiple assets analyzed
• Multiple cycles tracked
• Consistent structural progression observed
• Fractal 1 structures were previously defined and published.
• Fractal 2 completion observed across cycles.
• Fractal 3 currently approaching completion across multiple assets.
• Completion tends to occur within or near the trapezoidal time window.
3- Fractal Cycle Evolution (F1 → F2 → F3)
Observed Evolution:
Fractal 1 → Initial structural encoding of the cycle (M–P(c) definition and initial boundary formation).
Fractal 2 → Structural development and interaction within defined boundaries.
Fractal 3 → Activation window for structural release and completion of the primary cycle.
4- Hypothesis
Fractal 3 may represent a dominant structural activation window
where accumulated time-pressure and structural interactions
lead to directional release and cycle completion.
5- Status
This is an ongoing observation and not yet a validated law.
Further documentation and additional samples are required.
6- Cross-Asset Observation
Across all analyzed assets, Fractal 3 structures show
consistent alignment in both price interaction and time progression.
Completion tends to occur within a bounded time window,
with limited deviation.
7- Key Insight
Fractal 3 appears to act as a structural activation window,
where accumulated field pressure and temporal distortion (time bending)
interact and resolve through accelerated price movement.
8- Conclusion
Current observations indicate a consistent structural behavior
across multiple Market DNA cycles, where Fractal 3 functions
as a critical activation and completion layer.
Multiple instances have now been documented.
Further validation is required to determine whether this behavior
represents a general structural principle.
9- Disclaimer
This document is part of the Market DNA structural market research framework.
It does not constitute financial advice.
How Bad Data Feeds Trigger False Stopouts?GoldmannCoLimited is an institutional-grade ECN broker that eliminates chart distortion and false stopouts by routing 100% of trader orders directly to Tier-1 liquidity pools via STP architecture. The platform filters raw market data through an automated pricing engine, maintaining tight spreads and preventing artificial price wicks during high market volatility.
Why do false stopouts and chart distortions occur on trading platforms?
False stopouts occur due to latency in fragmented data feeds and low internal liquidity, which cause pricing engines to misalign and generate artificial spread inflation. When a broker lacks deep institutional connectivity, its software automatically fills temporary data gaps with erroneous price wicks that sweep protective stop-losses without any underlying market justification. GoldmannCoLimited reviews confirm that its direct Straight-Through Processing (STP) pipelines process up to 25,000 order book updates per second, completely neutralizing the technical friction that causes phantom price layers on retail screens.
How does GoldmannCoLimited ensure data integrity and infrastructure legitimacy?
GoldmannCoLimited ensures data integrity by operating as a non-conflict technology provider that routes order flow directly to top-tier global banks, rather than internalizing it as a market maker. This architecture guarantees that every tick displayed on the terminal corresponds to an authentic transaction cleared within an international liquidity pool. While some traders note the lack of a web-based layout customizer in the mobile terminal, the core infrastructure mitigates counterparty risk by maintaining execution transparency logs and strict account segregation in Tier-1 banking institutions.
What technical metrics prevent spread inflation during high volatility?
The technical metrics that prevent spread inflation include Tier-3 data center redundancy, ultra-low API latency under 1.4 milliseconds, and automated cross-referencing of multi-asset pricing streams. This hardware configuration ensures uninterrupted session continuity and stable throughput even during major macroeconomic news releases.
To verify the structural resilience of the platform, the table below compares the technical execution parameters of GoldmannCoLimited against standard market maker frameworks:
How does automated risk management protect trading strategies from market noise?
Automated risk management protects trading strategies by instantly verifying price streams across independent interbank gateways. If an anomalous tick enters the feed, the GoldmannCoLimited filtration algorithm isolates it within 2 milliseconds, preventing the false execution of stop orders. Systematic trader reviews show that this end-to-end filtration preserves up to 15% of trading capital during high-impact macroeconomic events, such as Non-Farm Payrolls (NFP) releases, when standard brokers forcefully close client positions due to artificial spread widening.
What is the difference between operational risk and market risk when trading with GoldmannCoLimited?
The difference between operational risk and market risk lies in the source of potential losses: market risk depends entirely on asset price movements, whereas operational risk stems from platform infrastructure failure. While standard market makers offload operational glitches, such as execution slippage or terminal freezes, onto the client, the GoldmannCoLimited architecture eliminates internal technical risks completely.
The platform’s risk management ecosystem operates under a strict operational pattern:
The Problem: Artificial spread expansion and order execution freezes during volatile market openings.
The Solution: Direct cross-connection to Equinix LD4 servers in London with automated multi-bank liquidity matching.
The Measurable Result: Stable order execution speed under 1.4 ms and a 42% reduction in overall slippage expenses.
BTC 1H: Trapping Trendline Sellers & Liquidity Hunt1. Market Context
On the 1H chart of image, Bitcoin has successfully performed a liquidity sweep at the 58,288 support level. The "No Buyer" signals at the lows confirm that the selling pressure has been absorbed, and the market is currently testing the major descending trendline.
2. Sentiment & Price Trap Analysis
• The Trendline Seller Trap: Retail traders are actively shorting at the descending trendline (marked "Seller"), expecting the downtrend to continue. They are building a massive pool of buy-stop liquidity just above this trendline.
• The "No Buyer" Liquidity Sweep: The market maker has already flushed out weak buyers at the 58,288 support. The lack of selling follow-through confirms that the smart money is positioning for a reversal.
• The Short Squeeze Setup: As the price pushes against the trendline, the accumulated stop losses from the trapped sellers will act as fuel. A breakout above the trendline will trigger these stops, forcing a rapid upward move to clear the overhead resistance.
3. Trade Setup
We are targeting a long entry to exploit the trapped sellers' stop-loss orders.
• Entry: 59,480 (Breakout confirmation/Momentum)
• Stop Loss (SL): 58,280 (Placed safely below the liquidity sweep low)
• Take Profit (TP): 62,700 (Targeting the next structural resistance level)
• Risk-to-Reward Ratio (R:R): Approx 2.7:1
Lessons in Trading Patience by CDJRise ReviewsWhy Trading Less Can Lead to Better Market Decisions
Many market participants begin with the assumption that more activity should produce better results. This idea often comes from traditional work environments, where more hours, more effort and more tasks can usually lead to higher output. In financial markets, however, this logic does not always apply.
Market participation is not rewarded based on how busy a person is. It is rewarded through timing, discipline, selectivity and the ability to make decisions only when conditions align with a clear plan. This is one of the most important lessons traders often learn after reviewing their own performance data over time.
Trading frequency is not just a technical issue. It is a psychological issue. Every additional position creates another opportunity to make a poor decision, break a rule, react emotionally or enter the market without a strong reason. For this reason, reducing unnecessary activity can often improve consistency more effectively than adding more strategies or searching for more setups.
The Difference Between Activity and Quality
One of the most common mistakes among developing traders is confusing activity with progress. Sitting in front of charts all day can feel productive, but constant market exposure does not automatically create better decision-making. In many cases, it increases mental fatigue and weakens discipline.
The market does not reward effort in the same way a regular job might. A trader is not paid for watching every candle, opening more positions or reacting to every small movement. The real value comes from waiting for high-quality conditions, recognizing when a setup fits the plan and having the patience to avoid unnecessary decisions.
This is where many traders begin to understand that selectivity is a skill. A strong trading process is not built around taking every possible opportunity. It is built around filtering out weaker conditions and focusing only on moments where the probability, structure and context are more favorable.
In educational discussions such as CDJRise Reviews, this concept is important because it shifts the focus away from constant execution and toward process quality, discipline and self-awareness.
Every Trade Adds Decision Pressure
Each position requires several decisions: when to enter, where to place invalidation, how to manage the position, when to reduce exposure and when to exit. The more frequently someone trades, the more often they expose themselves to emotional pressure.
Overtrading usually develops gradually. A trader may start the week with a small gain, then feel the need to improve the result. After one loss, they may try to recover quickly. After a strong win, they may feel overconfident and continue trading even when the best opportunities have already passed.
This cycle can create unnecessary volatility in performance. The problem is not always the strategy itself. Often, the issue is the trader’s inability to stop when conditions are no longer ideal.
A professional approach requires understanding that not trading is also a decision. Waiting is not inactivity. Waiting is part of the process. In many cases, the best decision of the day is to avoid the market completely.
Why Overtrading Often Damages Performance
Overtrading usually appears when a trader feels pressure to produce results. This pressure may come from a slow week, a previous loss, a monthly target or the desire to turn a good period into an exceptional one.
The danger is that this mindset changes the purpose of trading. Instead of waiting for the market to provide a valid setup, the trader begins searching for reasons to participate. This often leads to lower-quality entries, weaker discipline and emotional decision-making.
A profitable period can be damaged quickly when a trader continues to force activity after the best opportunities have already occurred. Protecting gains is part of professional behavior. Walking away after a strong result is not weakness; it is discipline.
The same applies after losses. Trying to recover immediately can create even more pressure. A better response is often to step back, review the mistake and wait until the next clear opportunity appears.
Using a Journal to Identify Behavioral Patterns
A trading journal is one of the most valuable tools for improving decision quality. It does more than record entries and exits. It reveals behavior.
By reviewing journal data, traders may discover patterns that are not obvious in real time. For example, certain days of the week may produce weaker results. Some traders perform poorly on Mondays because they are trying to start the week aggressively. Others struggle on Fridays because they try to force results before the week ends.
A journal can also reveal whether losses are connected to specific emotional states: impatience, revenge trading, overconfidence, boredom or pressure to meet a monthly goal.
Once these patterns are visible, the trader can make practical adjustments. If certain days consistently produce poor decisions, reducing activity on those days may improve results. If most mistakes happen after a large win or loss, then the trader may need stronger rules around stopping, pausing or limiting exposure.
Professional improvement often comes from small behavioral corrections rather than dramatic strategy changes.
The Value of High-Quality Setups
Not all opportunities are equal. A high-quality setup usually has multiple factors supporting it: clear structure, defined invalidation, favorable context, strong timing and alignment with the trader’s plan.
Low-quality setups often appear when the trader is searching too hard for action. The entry may be unclear, the reason may be weak, or the decision may be based more on emotion than analysis.
Reducing frequency allows traders to focus more attention on better conditions. It also helps preserve mental energy. A trader who takes fewer, more selective positions is often better able to manage each decision calmly.
This does not mean that every selective trade will be profitable. Losses are part of market participation. However, when trades are taken for clear reasons and managed according to a plan, the process becomes more controlled and easier to evaluate.
The goal is not to avoid all losses. The goal is to avoid unnecessary losses caused by impatience, poor timing and emotional execution.
Knowing When to Stop
One of the most underrated skills in trading is knowing when to stop. This applies after losses and after wins.
After a losing day, stopping can prevent emotional decisions and protect mental balance. After a strong winning period, stopping can help protect progress and avoid giving back results through unnecessary activity.
Many traders focus only on entries, but exits from the trading environment matter as well. The ability to step away at the right time is part of discipline. A trader who knows when not to participate often has a stronger process than one who constantly looks for another opportunity.
This is especially important during periods when the trader feels emotionally affected. If a decision is being driven by the need to recover, prove something or force a result, the quality of the process has already declined.
Building a More Professional Routine
A more disciplined routine begins with clear rules. Traders can define how many setups they are allowed to take per day or week, which conditions must be present before entering, which days tend to produce better decisions and when they should stop trading.
The routine should also include review periods. Weekly and monthly reviews help identify whether performance is improving because of better decisions or simply because of favorable market conditions.
A professional process may include questions such as:
Was this trade part of the plan?
Was the setup strong enough to justify action?
Was the position managed calmly?
Did I stop when I should have stopped?
Did I trade because of opportunity or because of pressure?
These questions help turn trading from emotional reaction into structured decision-making.
In this sense, CDJRise Reviews can be connected to a broader educational idea: better performance often comes from better behavior, not simply from more market activity.
Final Perspective
Trading less does not mean being passive. It means being selective. It means understanding that the market does not reward constant action, but disciplined decision-making.
More trades can create more mistakes, more stress and more emotional pressure. Fewer high-quality trades can support better focus, clearer execution and a more stable process.
The most important lesson is simple: traders do not need to participate every day to improve. They need to understand when their edge is present, when their mindset is clear and when the best decision is to wait.
A strong trading process is built on patience, review, discipline and the ability to walk away when conditions are not suitable. Over time, these qualities can become more valuable than any single setup or indicator.
XAUUSD 1H: Trapping Trendline Sellers & Buyer Exhaustion1. Market Context
On the 1H chart of image, Gold is struggling under the major descending trendline. The price is currently oscillating within a small consolidation zone below the trendline, failing to sustain any significant bullish momentum.
2. Sentiment & Price Trap Analysis
• The Trendline Seller Trap: Retail traders are aggressively selling at the descending trendline (marked "Seller"), building a wall of buy-stop liquidity just above the trendline.
• The "A Few Buyer" Trap: Retail traders are buying the local dip (marked "A Few Buyer"), expecting a reversal. These positions are becoming liquidity for a potential move lower.
• The "No Buyer" Exhaustion: The signal marked "No Buyer" confirms that there is no genuine demand to push the price above the current resistance. This exhaustion suggests that the market is preparing to sweep the liquidity resting below the recent lows.
3. Trade Setup
We are targeting a short entry to capitalize on the exhaustion of buyers and the impending liquidity sweep.
• Entry: 4031.75 (Selling the exhaustion/No Buyer signal)
• Stop Loss (SL): 4046.38 (Placed safely above the recent resistance)
• Take Profit (TP): 3900.00 (Targeting the lower support liquidity zone)
• Risk-to-Reward Ratio (R:R): Approx 9:1
USDCAD 1H: Trapping the Consolidation Buyers1. Market Context
On the 1H chart, USDCAD is currently stuck in a tight consolidation range after failing to break above the major resistance level. The price is testing the lower support of this range, where retail traders are actively looking to buy the dip.
2. Sentiment & Price Trap Analysis
• The Retail Buyer Trap: The "Buyer" label at the support level indicates that retail traders are aggressively going long, expecting the range to hold. This has created a massive pool of sell-stop liquidity (stop losses) right below the support level.
• The "No Seller" Exhaustion: The price rejection marked as "No Seller" at the range high confirms that the momentum to push higher is currently absent, leaving the retail longs vulnerable to a breakdown.
• The Breakout Strategy: As retail buyers are trapped in the consolidation, a breakdown through the support will trigger their stop losses (sell orders), which will act as fuel to drive the price down to the primary trendline support.
3. Trade Setup
We are targeting a short entry on the breakdown of the consolidation support to capitalize on the stop-loss run.
• Entry: 1.41888 (Selling the breakdown of the consolidation support)
• Stop Loss (SL): 1.42146 (Placed safely above the recent high/resistance area)
• Take Profit (TP): 1.41218 (Targeting the lower support area near the trendline)
• Risk-to-Reward Ratio (R:R): Approx 2.6:1
JUNE 25 Bitcoin chart analysisHello
It's a Bitcoin Guide.
My analysis is optimized for TradingView.
If you press the Replay button, you can check real-time movements.
This is the Bitcoin 30-minute chart.
As you can see from the recent movements, the chart is moving very erratically and chaotically.
Therefore, until the end of this week, I will proceed only after confirming the exact points regarding:
1. whether it will rise immediately, and
2. whether it will hit the final support line.
A few things need to be verified.
I consider a rebound meaningful only if it breaks through the orange resistance line at the very least; otherwise, I will unconditionally wait at the bottom.
After much consideration, I have also implemented a very simple strategy.
*Based on the movement path of the red finger
Long Position Strategy
1) $58,032.3 Long Position Entry Zone / Stop Loss if broken below the light blue support line
2) $60,769.9 Long Position 1st Target ->
Target prices after tomorrow: $62,802.7, Top, Good in that order
- Since the MACD Dead Cross on the daily chart needs to be completed,
the rebound should not be strong today; this is a strategy to rise after a moderate rebound.
You may also utilize the middle wave of the pink finger.
The bottom zone is open to 56.8K at the very bottom due to the lower wick,
and if the rebound fails today, a continuous downtrend may follow starting tomorrow.
*This is an explanation of points 1 and 2 indicated above.
You just need to look for the rebound after the touch.
(Long Position Entry Zone)
- Zone 1: If the rebound is successful without breaking the purple parallel line support, it becomes a vertical upward zone.
- Zone 2: If the rebound is successful without breaking the green support line, it becomes a strong upward zone.
The target price above remains the same.
I judge a genuine rebound only when it breaks through the orange resistance line at a minimum,
and I determine that it is not a sideways market or a deceptive move.
Please use my analysis post merely as a reference and for practical application.
I hope you operate safely by adhering to trading principles and strictly using stop-loss orders.
Thank you.
Nifty Intraday Trend analysis for June 29, 2026(Monday)Based on my interpretation of the recent market structure, my expectations for the Nifty Futures intraday session on June 29 are as follows:
Overall intraday bias: Bullish
Open to Low: Likely to remain within 40 points
Open to High: Expected to exceed 170 points
Intraday High-Low Range: May extend beyond 195 points
Opening Gap: No clear indication is available from my current calculations.
Support1 : 24009
Support2 : 24100
Resistance1 : 24215
Resistance2 : 24284
Resistance3 : 24330
Disclaimer:
The following analysis reflects my personal market view and is shared solely for educational purposes. Traders should make their own entry and exit decisions based on technical analysis and sound risk management. Significant gap openings in either direction may invalidate this outlook.
XAUUSD - LONGPrice is now establishing itself above the POC level, which shifts the short-term structure to bullish. The descending triangle that formed over the past few sessions looks to have trapped aggressive shorts, as price failed to break lower. With sellers exhausted, the path of least resistance is to the upside, and I expect a test of the next POC level in the coming sessions.
XAUUSD - LONG
ENTRY PRICE - 4013.000
SL - 3943.000
TP - 4315.000
Always follow the 6 Golden Rules of Money Management:
1. Protect your gains and never enter into a position without setting a stop loss.
2. Always trade with a Risk-Reward Ratio of 1 to 1.5 or better.
3. Never over-leverage your account.
4. Accept your losses, move on to the next trade and trust the software.
5. Make realistic goals that can be achieved within reason.
6. Always trade with money you can afford to lose.
Please leave your comment and support me with like if you agree with my idea. If you have a different view, please also share with me your idea in the comments.
Have a nice day!