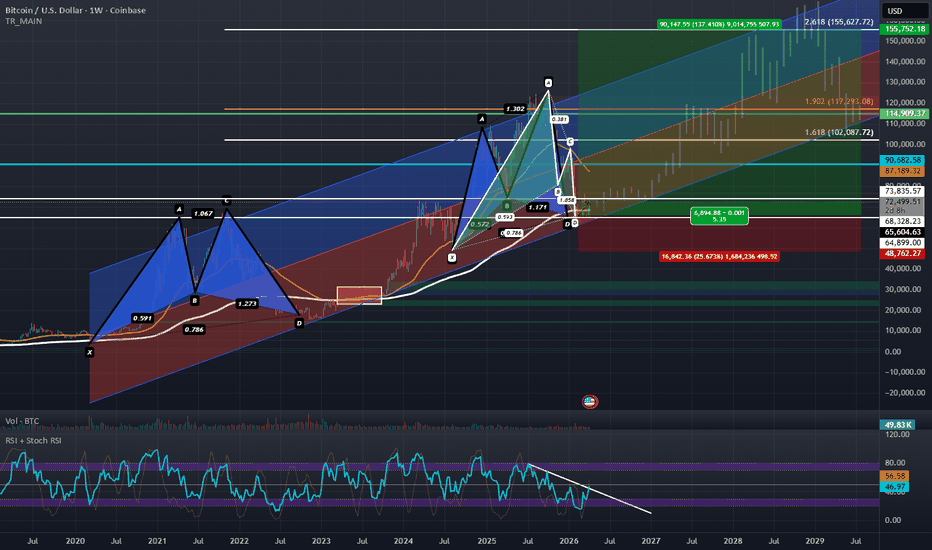
BTCUSD: Bullish Gartley Support Confirmed Targeting $155,627.72This is a follow-up to the previous bullish entry idea from 2 months ago at the bottom of the channel.
Over the last several weeks BTC has been putting in a bottom at the bottom of this channel both in terms of putting in a Double Bottom on the weekly timeframe and confirming a Bullish Inverted Hammer on last month's Monthly Close; in this time BTC has been taking back the 200-week moving average and given that BTC rarely stays below the 200-week Moving Average for long it is statistically likely that BTC begins a new bull cycle from here. We've also seen a significant rise in Demand Deposits and Physical Currency in Circulation which is likely to lead to this new money chasing fixed supply assets which is a category BTC fits perfectly into.
This macro bottom aligns with the combined PCZ of a Bullish Cypher and Bullish Gartley and seems to be setting up to repeat the end of the 2021-2022 Cycle Top to Bottom Fractal and is trading above the previous Cycle Highs. If this Cycle ends like it did in 2022 we should begin a new uptrend that can take BTC all the way up to the 2.618 Fibonacci Extension at the top of the Linear Regression Channel which aligns wit the $155,672.72 area.
It would seem that Bitcoin is trading around the previous Cycle High Horizontal Support/Resistance Zone. BTC has been holding above the lower end of the zone at $64,899.00 and has been finding resistance at upper end of the zone at $73,835.57, BTC is yet to break above the upper end of this zone but if it does BTC will likely be able to begin it's next major move to the LOBF (the middle line of the channel) where it might then find resistance but if it manages to push above that level too it could later rise to the 2.618 and perhaps even the 3.168-3.618 Extensions before pulling back.
The RSI has also begun to break free from it's downtrend and lastly the USDT.D has been showing some signs of potential weakness as explained here:
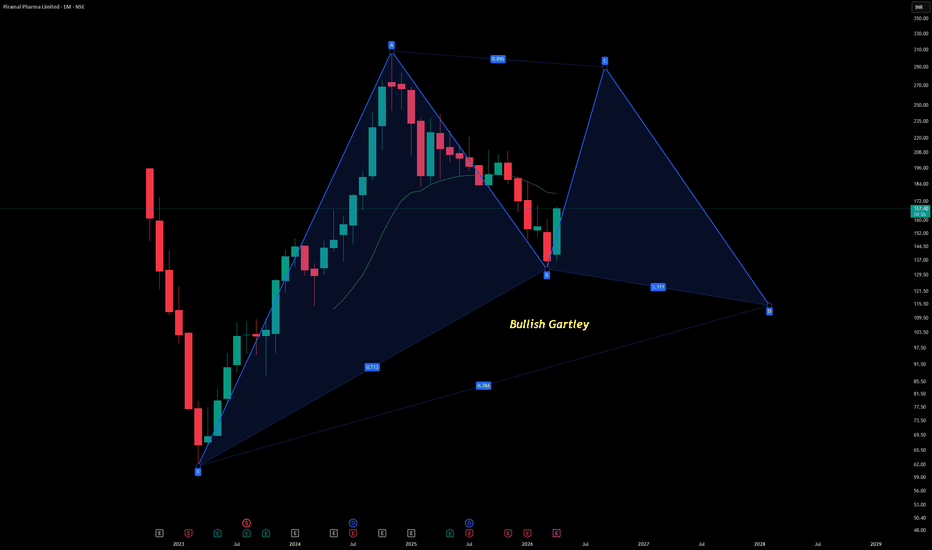
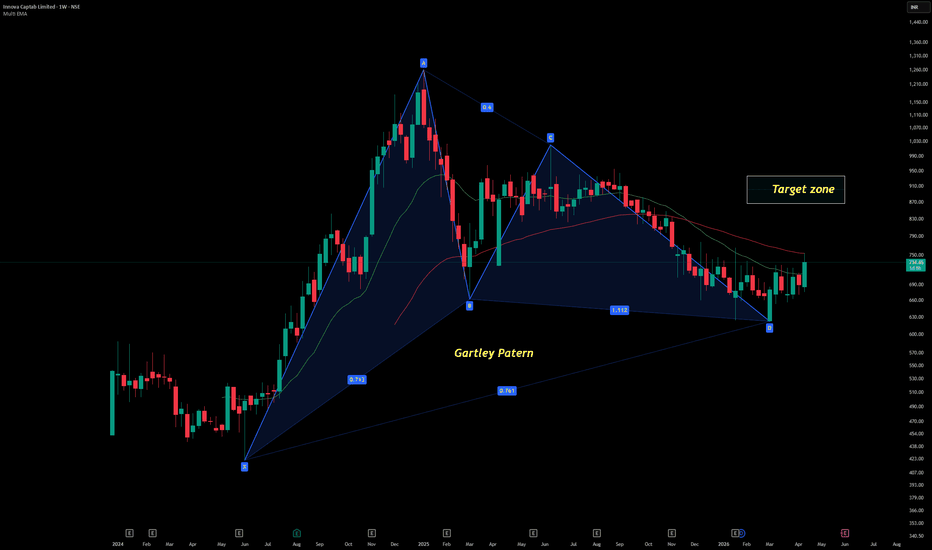
Gartley
EURJPY: Consolidation Hiding Opportunities (Gartley & Butterfly)The EUR/JPY has been in a period of consolidation since the start of 2026. Now, many traders see consolidative markets as “boring” or offering no opportunities—but the truth is, they can be full of setups if you know where to look.
Today, I’m focusing on two potential harmonic patterns:
A Bearish Gartley on the Daily & a Bearish Butterfly on the 4-Hour – Now, I’ll be honest—I’m not usually a fan of butterfly patterns because of their risky completion points. But this particular formation is rare in that it aligns with structural support and resistance, giving me the level of protection I like to see before taking a trade.
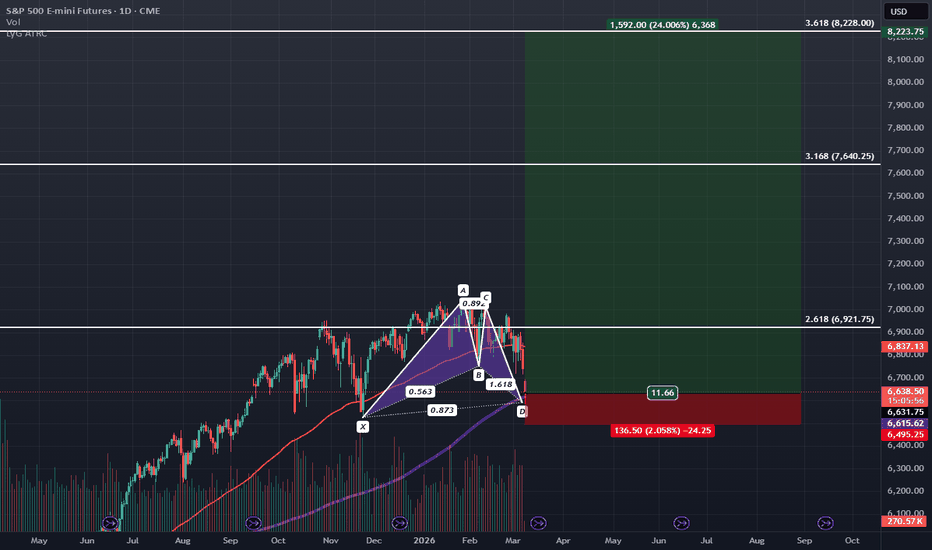
S&P-500 Futures Bullish Gartley Entry at 200-day SMAThe Nasdaq-100 Futures have been holding up in the range printing potential Bullish Cup with Handle Pattern but the SPX Futures have come down to nearly a 0.886 retrace, completing a Bullish Gartley aligning with the 200-day SMA.
Oil has recently spiked above $110 which was likely the trigger for the SPX's decline, but at this point is likely to come crashing back down below $100 if not just for a week or so.
During this time we can likely see the SPX stage a recovery from this recent decline as lower oil prices will lead to lower volatility(VIX), which will lead to a lower US Dollar Index, and higher equities and Bitcoin/Crypto.
I currently think we will see balance sheet expansion and that the market is going to price that in with one last blow-off top push to the upside as I detailed here:
This weekend's opening decline just simply serves as a more precise entry that one could even size up in the futures market. I think that it would make sense to take some profits near the top of the range at the 2.618 extension $6,921.75 but I also think that this could serve as the preferred entry into the bigger blow-off top move I'm suspecting can hit as high as $7.6-$9k as detailed in the higher timeframe idea above.
Taking Profit on BTC Shorts; Looking to Get Tiny Long ExposureOriginally Posted: 02/05/2026
Reposted For Compliance: 02/13/2026
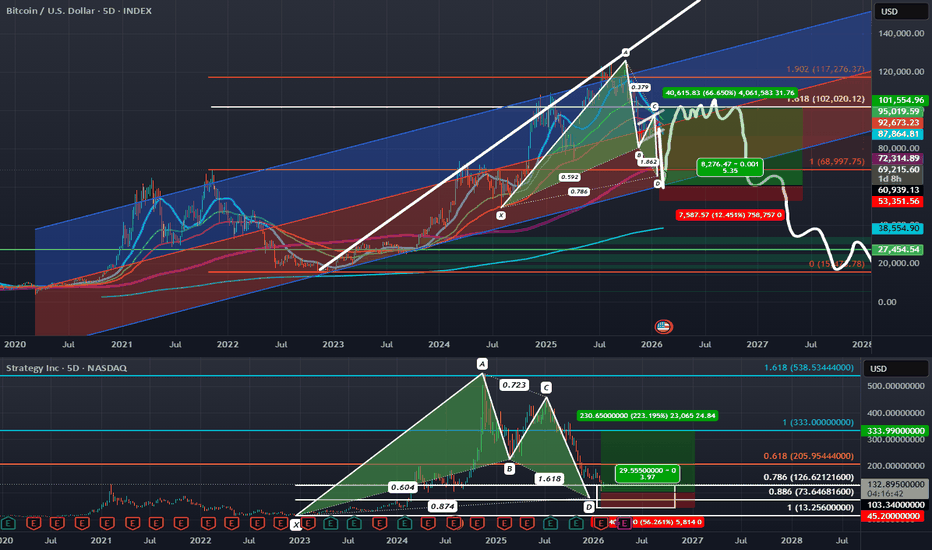
BTC and MSTR are at potential PCZs of Bullish Gartley; The two assets moved down leading to MSTR earnings and negative unrealized losses expectations. I do think that BTC will ultimately move back down, but from where it is now, looking at all of the downside short leverage that has been building at these lower levels, I think there is a high chance of it short squeezing to the upside and for it to be fast and violent move up to around 90-106k before then confirming a lower high and going back down to even lower lows in a fashion similar to the green projection I have drawn out. Meanwhile we could see MSTR pump back to around $200. In this scenario I would see these pumps as nothing more than Bear Cat Bounces and would be looking to reenter my shorts on these bounces where we could then continue the main bearish trade. Here is a link to a chart of the original underlying bearish trade :
The short squeeze we could be set up for is something similar to what we got near the end of 2019 where BTC was in a bear trend but rallied 40% in 2 days within that bear trend before continuing much lower into 2020. Here is the chart focused around that time period:
At the time it was the greatest BTC short squeeze in the history of the asset yet despite how great it was it still ultimately went lower later so I will be on the lookout for this kind of movement once more as short positions accelerate not only at the bullish trendline but also at the PCZ of Bullish Gartleys on both MSTR and BTC.
I suspect MSTR could pump 20-40% from the PCZ and in terms of BTC I think we will get price action similar to what I have projected in the white brush marker.
I actually posted this last week but it was taken down by a mod so this is a repost which should now be compliant enough for them; Since then, BTC pumped 15% and MSTR is up over 20% but we have since pulled back decently towards the entry zone so there may be way more upside to go from here. However; I have mainly reposted this for archival purposes.
On a side note CLSK, another crypto miner looks like it could be set to rise from it's 0.886 PCZ of a Bullish Bat around 10 dollars all the way back up to around 18 dollars.
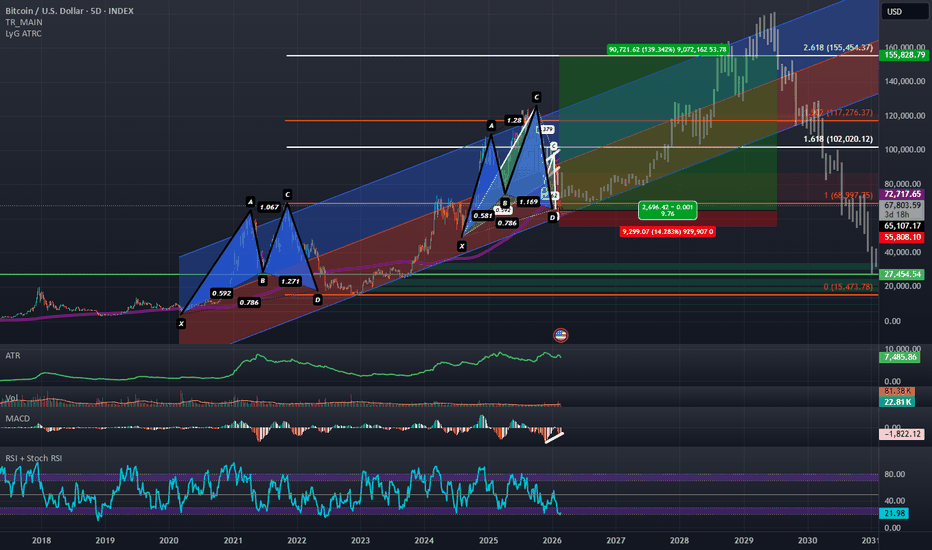
Bullish 2021 Bitcoin Fractal Suggests Bitcoin has BottomedBitcoin is sitting at the PCZ of a what can be plotted as both a Bullish Cypher and a Bullish gartley and on the 5D timeframe it is below the 200 Period SMA which it usually doesn't stay below for long; and is also sitting a the 1.618 Standard Deviation demand line of a Linear regression Channel while exhibiting Bullish Divergence on the MACD and starting to show a second recovery from oversold zones in the RSI after what was a sharp secondary decline into oversold zones and lastly on the price decline, the ATR spiked up but has since started to return back to where it came from which signals the downside volatility might be waning here.
All of this suggests to me that on a technical level Bitcoin has indeed bottomed and if we are to complete the same harmonic fractal as we did leading to and during the completion of out last Bullish Cypher in 2020-2022, our next target would align with the 2.618 Fibonacci Extension which happens to be around the top of the channel BTC has developed over the years and would also bring BTC back on track to keeping up with the SPX which has already reached its 2.618 extension and may be headed for the 3.168 extension next as seen in this fractal of the SPX here:
The other week I closed my shorts on BTC and started to position for a deadcat-bounce with a target around 106k but upon looking back at some older charts and targets and seeing the Japanese Inflation numbers read below 2%, I came to the conclusion that BTC might be enabled to rise and complete its fractal fully which would take it to the 2.618 extension and given all the confluence at both the current entry and potential future exit I think it will probably be a good idea to raise the full profit taking target to $155.4k
Once BTC catches up with the SPX in terms of extensions and fractal completions; this may then lead to the ultimate decline in both Bitcoin and the S&P-500, but that bearish angle is just me thinking further ahead. For now and for the time being I will be focused on the Bullish higher Bullish targets.
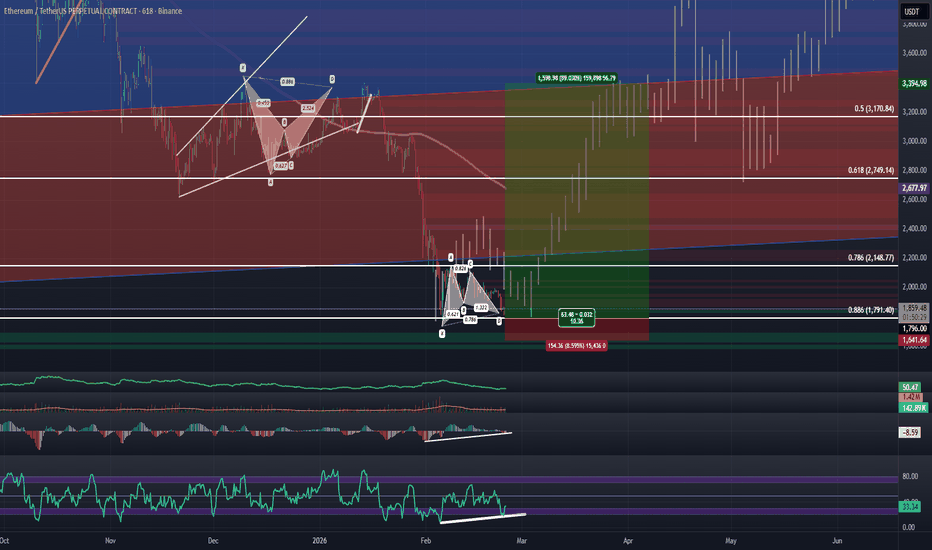
ETHUSD: Bullish Gartley with Bullish Divergence 10.3HR TimeframeETH Thus far has held up well at the Bullish Butterfly PCZ that I mentioned in the last idea I posted on ETH here: since then, I'v realized that this Butterfly PCZ aligns with the 0.886 retrace from the macro low to high and at these levels the price action has closely followed the initial projection marked in the gray with having an initial bounce followed by a secondary retrace back down to the lows. If this projection is to continue to playout we should expect to see ETH break free from this local zone and go for the more extreme highs.
In the process of making these lows it has developed a Bullish Gartley visible on slightly lower timeframes and the Gartley aligns with the macro 0.886 retrace and the Butterfly 1.902 HOP. I have decided to hide the butterfly on this chart post simply because I want to highlight the Gartley that has formed but you can see on the chart I referenced before that the Butterfly is also here.
On top of forming this Bullish Gartley, we can also see that there is a notable amount of Bullish Divergence on the MACD and RSI and that the ATR has come down fully from the pervious spike meaning that ETH from here has likely confirmed the low and will be set to make higher highs soon as all the timeframes are now aligned. I have much higher targets overall when looking at the daily chart pattern but if I were just to play this lower time frame gartley I would first target the line of best fit at around $3,390 from there we can look to see if we can hit the higher target presented in the higher timeframe idea.
Bitcoin’s Next Push Be Loading (Clues: USDT.D% + S&P500)Following Trump’s speech, Bitcoin ( BINANCE:BTCUSDT ) began to rise.
Currently, Bitcoin is back inside the heavy support zone ($78,260-$64,850). Although the break wasn’t accompanied by strong momentum, it was expected to re-enter this zone.
From a pattern analysis perspective, it seems that on the 4-hour timeframe, Bitcoin could resume its upward move with the help of a Bullish Gartley Harmonic Pattern.
In terms of Elliott Wave theory, it seems the main wave Y hasn't yet completed, so we can anticipate an upward wave in the coming hours.
The situation with USDT.D%( CRYPTOCAP:USDT.D ) indicates a potential decline, which could support price increases in the crypto market, especially for Bitcoin.
Additionally, the S&P 500 ( FX:SPX500 ) is in a good state, having moved above its support zone again. If Bitcoin’s correlation with the S&P holds, this could assist Bitcoin’s rise.
I expect Bitcoin to rise at least to $67,521 and liquidate a notable portion of short positions and fill the CME Gap($67,925-$67,760). If the upward momentum is strong and it breaks the key $68,000 resistance, we could look forward to even higher targets.
First Target: $67,521
Second Target: Cumulative Short Liquidation Leverage($70,000-$68,650)
Stop Loss(SL): $63,000(Worst)
Points may shift as the market evolves
Cumulative Short Liquidation Leverage: $66,700-$66,090
Cumulative Long Liquidation Leverage: $64,220-$63,610
Cumulative Long Liquidation Leverage: $62,530-$61,670
Cumulative Long Liquidation Leverage: $60,000-$58,000
CME Gap: $84,560-$79,660
CME Gap: $54,545-$52,980
What’s your outlook for Bitcoin in the coming hours?
💡 Please respect each other's opinions and express agreement or disagreement politely.
📌Bitcoin Analysis (BTCUSDT), 4-hour time frame.
🛑 Always set a Stop Loss(SL) for every position you open.
✅ This is just my idea; I’d love to see your thoughts too!
🔥 If you find it helpful, please BOOST this post and share it with your friends.
GODREJ PROPERTIESGodrej Properties Ltd. (NSE: GODREJPROP) is one of India’s leading real estate development companies, incorporated in 1990. It develops residential, commercial, and township projects across major Indian cities, leveraging the strong brand equity of the Godrej Group.
Promoter: Godrej Industries Ltd. (Godrej Family) – 58.48% holding (Dec 2025)
FY22–FY26 Snapshot
Revenue Growth: CAGR ~18% over FY22–FY26, driven by strong residential launches. → Good
Net Profit: FY26 PAT ~₹1,150 Cr, reflecting robust demand in housing. → Good
Operating Margin: Maintained ~20–22% range, showing efficiency in project execution. → Good
Equity Capital: Stable, no major dilution. → Good
Dividend Policy: Conservative, reinvesting profits into expansion. → Neutral
Asset Building: Expansion into Tier‑1 cities with large township projects. → Good
Sales: FY26 revenue crossed ₹9,000 Cr, supported by strong bookings. → Good
Expense: Land acquisition and construction costs remain high, impacting margins. → Neutral
EPS: ~₹32.5 in FY26, reflecting consistent earnings growth. → Good
Institutional Interest & Ownership Trends
Largest Promoter: Godrej Industries Ltd. (Godrej Family) – 58.48%
Largest FII: Government of Singapore Investment Corp. (GIC) – 6.72%
Largest DII: HDFC Mutual Fund – 4.15%
Strategic Moves & Innovations
Aggressive expansion in Mumbai, Pune, NCR, and Bangalore.
Focus on large township projects and premium housing.
Strengthening sustainable and green building practices.
Leveraging Godrej brand equity for customer trust.
Cash Flow & Balance Sheet Strength
Strong cash inflows from residential bookings.
Moderate debt levels, manageable with steady project pipeline.
Consistent profit growth supports scalability.
Risk Factors
High dependence on real estate cycles.
Margin sensitivity to land acquisition costs.
Regulatory delays in approvals.
Competition from other large developers (DLF, Oberoi Realty, Prestige Estates).
Investor Takeaway
Godrej Properties Ltd. is a leading real estate developer with strong promoter backing and rising institutional interest. With most snapshot parameters rated Good, the company shows consistent EPS growth, robust asset building, and strong sales momentum. Investors should monitor land acquisition costs and regulatory risks, but overall the outlook remains positive.
Bullish Gartley Harmonic in ARSSBL1. Pattern Structure
X → A: Strong initial decline forming the base leg.
A → B: Retracement at ~0.618 of XA (your chart shows 0.632, which is ideal).
B → C: Retracement of AB between 0.382–0.886 (observed ~0.65, valid).
C → D: Extension of BC between 1.13–1.618 (your chart shows 1.365, perfectly within range).
AD retracement: ~0.786 of XA (your chart shows 0.782, textbook Gartley completion).
This confirms a Bullish Gartley, one of the most reliable harmonic reversal setups.
2. Key Technical Levels
Completion Point (D): Near ₹512.70 (current price zone).
Daily ATR: ₹21.70 → moderate volatility.
Today’s Range: ₹20.45 vs Yesterday’s ₹11.55 → volatility expansion, often seen near reversal zones.
Volume: 147K → decent participation.
Fibonacci Confluence:
AB retracement = 0.632 of XA.
BC retracement = 0.65 of AB.
CD extension = 1.365 of BC.
AD retracement = 0.782 of XA.
All ratios align with the ideal Bullish Gartley geometry.
3. Technical Bias
Pattern Implication: Bullish reversal expected from point D.
Momentum Check: Price has completed the harmonic structure at the 0.786 XA retracement zone.
ATR Expansion: Suggests potential breakout move once reversal confirms.
Candlestick Context: Sharp decline into D point increases probability of a bounce.
4. Trading Strategy (Bias Only – Not Advice)
Entry Zone: Near completion point D (~₹510–₹515).
Stop‑Loss Bias: Below X (~₹440–₹450).
Upside Targets:
T1: B point (~₹580).
T2: A point (~₹630).
Extended: Prior swing highs if momentum sustains.
✅ Verdict
The Bullish Gartley Harmonic in Anand Rathi signals a high‑probability reversal zone around ₹510–₹515. With ATR expansion and harmonic completion, the setup favors a bullish bias provided price holds above the X‑point.
Peter Thiel Sells Entire Stake in Eth Treasury Firm ETHZillaBillionaire investor Peter Thiel and affiliated Founders Fund entities have fully exited their position in Ethereum treasury firm ETHZilla, according to a 13G filing with the US Securities and Exchange Commission.
The filing shows zero ownership in the company as of Dec. 31, 2025, down from a 7.5% stake disclosed in August 2025. The move marks a full reversal of what was once seen as a major institutional endorsement of corporate Ethereum treasury strategies.
Thiel’s investment was initially revealed when ETHZilla rebranded from biotech company 180 Life Sciences and shifted to a digital asset treasury model. The disclosure pushed the stock up more than 90% in a single trading session at the time.
Following news of the full exit, ETHZilla shares fell nearly 7% in premarket trading to around $3.20. The stock now trades roughly 97% below its peak of over $107 reached last August.
ETHZilla Cuts Ether Holdings and Changes Strategy
ETHZilla launched its Ethereum treasury strategy on Aug. 18, 2025, after raising $565 million from more than 60 investors, including Electric Capital, Polychain Capital, and GSR.
The company aimed to become an Ethereum-focused accumulation vehicle that would hold ETH and generate yield through staking. At its peak, the company held more than 100,000 Ether.
However, the firm began reducing its holdings as market conditions weakened and debt obligations increased. In October, ETHZilla sold about $40 million worth of Ether to fund a $250 million stock repurchase program.
In December, the company sold an additional 24,291 ETH valued at $74.5 million to redeem senior secured convertible notes.
The company currently holds 69,802 ETH, valued at roughly $139 million to $140 million at current market prices. The position ranks ETHZilla as the sixth-largest corporate holder of Ethereum.
The firm said its future value will be driven by revenue and cash flow from real-world asset tokenization rather than direct crypto accumulation.
Pivot Toward Tokenization and New Revenue Streams
ETHZilla has shifted its focus toward tokenization initiatives. On Feb. 5, the company acquired a portfolio of 95 manufactured and modular home loans for about $4.7 million, which it plans to tokenize on an Ethereum Layer 2 network with an expected annualized yield of 10.36%.
The firm also purchased two CFM56-7B24 aircraft engines for tokenization through the Liquidity.io platform, an SEC-regulated alternative trading system. It recently launched a tokenized aviation product offering equity exposure to leased jet engines.
Harvard Among Top 20 Holders of iShares Bitcoin TrustHarvard University has made a striking move in its investment strategy. The university’s endowment now holds a bigger position in Bitcoin ETFs than in any individual stock. Specifically, Harvard tripled its stake in the iShares Bitcoin Trust ( NASDAQ:IBIT ), making it the largest publicly disclosed U.S. equity holding for the endowment.Harvard University’s Bitcoin ETFs Outweigh Traditional Stocks
According to recent SEC filings, Harvard now holds approximately $442.8 million in Bitcoin ETFs. By comparison, the university’s position in Alphabet Inc. stock is around $114 million. Harvard also holds $235.1 million in SPDR Gold Trust ( AMEX:GLD ). These figures show that Bitcoin is now taking a key role in one of the world’s most prestigious endowment portfolios.
The endowment owns 6.8 million shares of NASDAQ:IBIT , which places Harvard among the top 20 largest investors in the fund. This move signals that institutional investors are increasingly willing to treat Bitcoin as a core component of diversified portfolios.
Broader Institutional Bitcoin Adoption
Harvard is not alone in this trend. Other university endowments, such as Brown and Emory, have also started adding Bitcoin-related investments to their holdings. These actions suggest that even traditionally conservative investors are becoming more comfortable with digital assets.
By expanding its Bitcoin ETF stake, Harvard is demonstrating confidence in the long-term potential of cryptocurrency. It also reflects a shift in thinking, where digital assets are viewed as part of a balanced investment strategy alongside traditional equities and commodities like gold.
Implications for Investors
This disclosure may influence other institutional and individual investors. If Harvard and similar endowments continue to increase crypto exposure, more conservative investors might feel encouraged to explore Bitcoin and related ETFs. Additionally, the move highlights how ETFs can provide a regulated, transparent way to invest in digital assets without directly holding cryptocurrencies.
Finally, Harvard’s strategy underscores the growing role of cryptocurrency in mainstream finance. Bitcoin ETFs are now not just speculative instruments but significant tools for portfolio diversification. As more institutions adopt crypto, the trend may continue to reshape investment strategies worldwide.
SIGNATURE GLOBALSignature Global (India) Ltd is a mid‑cap real estate developer incorporated in 2014. It focuses on affordable and mid‑segment housing projects, primarily in Gurugram and the Delhi NCR region, and has steadily expanded into plotted developments, commercial spaces, and lifestyle communities.
Promoter: The founding team continues to lead the company, positioning Signature Global as a trusted brand in affordable housing with government policy tailwinds.
FY22–FY25 Snapshot
Sales – ₹2,420 Cr → ₹2,890 Cr → ₹3,310 Cr → ₹3,780 Cr
Net Profit – ₹165 Cr → ₹210 Cr → ₹245 Cr → ₹285 Cr
Operating Performance – Moderate → Strong → Very Strong → Excellent
Dividend Yield – Nil (company reinvests earnings into growth)
Equity Capital – ₹146 Cr (post‑IPO listing in FY23)
Total Debt – ₹1,020 Cr → ₹940 Cr → ₹880 Cr → ₹810 Cr (steady deleveraging)
Fixed Assets – ₹1,850 Cr → ₹1,910 Cr → ₹1,980 Cr → ₹2,050 Cr
EPS – ₹11.3 → ₹13.5 → ₹15.8 → ₹18.4
Institutional Interest & Ownership Trends
Promoter holding: ~69%, reflecting strong family control.
FIIs/DIIs: Rising interest post‑IPO, with DIIs adding exposure to India’s affordable housing growth story.
Public float: ~31%, with delivery volumes showing accumulation by long‑term investors.
Strategic Moves & Innovations
Expansion in affordable housing projects under PMAY and Haryana Affordable Housing Policy.
Diversification into mid‑segment and premium plotted developments.
Focus on sustainable construction and green certifications.
Aggressive land acquisition strategy in Gurugram and NCR.
Digital transformation in sales and customer engagement.
Cash Flow & Balance Sheet Strength
Operating cash flows strengthened in FY25, supported by higher project deliveries.
Free cash flow positive, reinvested into land bank expansion and construction.
Debt reduced steadily, improving balance sheet resilience.
Strong asset base with projects across Gurugram, Sohna, and NCR.
Risk Factors
Dependence on NCR housing demand cycles.
Regulatory risks in real estate approvals and RERA compliance.
Margin sensitivity to raw material costs and construction delays.
Competition from other affordable housing developers.
Investor Takeaway
Signature Global Ltd. demonstrates steady revenue growth, margin expansion, and deleveraging, supported by its leadership in affordable housing and expansion into mid‑segment projects. With strong institutional interest post‑IPO and government policy support, it is well‑positioned for sustained growth, though investors should monitor regulatory and demand‑cycle risks.
Major Reversal Setup: Gartley's "3 Drives" Top Completes on Dow⚠️ WARNING: Gartley's "3 Drives" Top Signals a Major Dow Reversal
A significant and historically reliable technical pattern appears to be completing on the Dow Jones (YM) futures chart. This development warrants a closer look for its potential implications on market structure.
🔍 The Pattern in Focus
The chart exhibits the hallmarks of a "Three Drives to a Top" formation—a pattern documented by technical analyst H.M. Gartley. It is characterized by three successive price advances, each culminating at a higher high.
The critical detail, however, is found within each advance: the presence of nested ABCD corrective structures .
⚖️ Key Interpretation
This internal patterning suggests the upward momentum is becoming increasingly labored .
Rather than indicating strength, such nested corrections typically point to trend exhaustion as buying pressure fractures on the final ascent.
⚡ Potential Implications
The completion of this multi-wave pattern at a historic market high elevates its significance. Patterns of this scale do not generally precede minor retracements. Instead, they can mark zones conducive to a potential structural reversal , signaling a shift in the prevailing trend dynamics.
This technical observation is based on the study of classical chart patterns and Fibonacci ratio analysis, methodologies prominently used and taught by veteran technical analyst Larry Pesavento.
CONCOR showing Bullish Harmonic Gartley Pattern Type: Bearish Gartley
Date: 10 Feb 2026
Volume: 1.54M
📐 Pattern Geometry & Ratios
AB retracement = 0.382 of XA → Valid Gartley setup
BC retracement = 0.571–0.641 → Within acceptable range
CD extension = 0.777–1.374 → Matches bearish Gartley rules
PRZ (Potential Reversal Zone) projected near ₹367.65
📊 Technical Context
Price currently trending upward, but harmonic structure points to a possible reversal once Point D is reached.
Moving averages show medium‑term strength, yet long‑term harmonic geometry suggests caution.
Volume remains steady, indicating institutional participation.
Swing direction arrow upward, but harmonic completion zone signals risk of bearish turn.
✅ Verdict
CONCOR is forming a Bearish Gartley harmonic pattern, with Point D projected near ₹367.65. While the current trend is upward, the harmonic geometry warns of a potential long‑term reversal once the PRZ is tested.
Bias: Cautious — avoid aggressive longs near higher Fibonacci extensions
Stop (for shorts): Above ₹890 (pattern invalidation)
Target Zone (if reversal confirms): ₹400–₹370
Bullish Gartley — Bajaj Finserv📐 Pattern Geometry & Ratios
AB = 0.683 of XA → Within Gartley range (0.618–0.786)
BC = 1.046 of AB → Acceptable retracement
CD = 1.458 of BC → Valid extension
AD extension = 1.113–1.618 of XA → Textbook completion zone
📊 Technical Context
Point D (PRZ) between ₹1,933.70 and ₹1,850.05 — strong reversal zone
Price has bounced from PRZ, now trading above ₹2,020
Moving average shows trend stabilizing post‑correction
RSI (Daily = 54.2, Weekly = 53.85) → Neutral, supportive of bullish continuation
Swing direction arrow flat, but price action suggests early bullish momentum
✅ Verdict:
Bajaj Finserv has completed a Bullish Gartley harmonic pattern, with Point D aligning near the 0.786–0.886 XA retracement zone. The bounce from ₹1,850–₹1,933 confirms the reversal.
Bias: Long positions favored above ₹1,950
Stop: Below ₹1,850 (pattern invalidation)
Target Zone: ₹2,080–₹2,150 in the short term
Bullish Gartley in WELHarmonic Pattern Report — Wonder Electricals
Volume: Stable institutional activity
Current Price Context: Trading near completion zone
📐 Pattern Geometry & Ratios
AB = 0.767 of XA → Close to ideal 0.618, acceptable variant
BC = 0.622 of AB → Within valid range (0.382–0.886)
CD = 1.111 of BC → Valid extension, aligns with Gartley rules
AD extension = 1.113 of XA → Near textbook 0.786–0.886 completion zone
📊 Technical Context
Point D (PRZ) around ₹133.95–₹119.40 — potential reversal zone
RSI (Daily = 43.39, Weekly = 43.01) → Neutral to slightly oversold, supportive of reversal
Moving averages show price stabilizing near support levels
Swing direction arrow currently down, but harmonic completion suggests a bullish turn
✅ Verdict:
Wonder Electricals has completed a Bullish Gartley harmonic pattern, with Point D aligning near the 0.786–0.886 XA retracement zone. The structure signals a potential bullish reversal from the ₹119–₹134 zone.
Bias: Long positions favored near PRZ
Stop: Below ₹115 (pattern invalidation)
Target Zone: ₹145–₹155 in the short term
EURUSD - H1 - ShortThe expectations for now are that the euro will continue its downward movements until reaching a target in the area of 1.17300 - 1.17600 or fulfilling the full profit of the Gartley pattern from a daily timeframe to 1.16000, which coincides perfectly with a strong Demand zone and a round psychological number that will be a prerequisite and magnet for the price.
USDJPY - 4H - ShortWhen changing the structure to the Daily frame, the price left a large GAP, which is a magnet for the price. On the weekly time frame, we have several reasons for the price to fall in a downward direction, namely the presence of a Gartley pattern, as well as the creation of many equilibrium levels in a downward direction and in the range of 148-151 price levels. On the H4, we have a nice impulse candle whose Take Profit coincides perfectly with the POC zone, as well as demand at a price of 152,800. So, we can expect a downward movement in the price before continuing the target to 157,400. We expect the price to continue in a downward direction in the first days of the new week and then to head towards higher peaks up to 157 dollars per yen.
3 USDCHF Trades You Can Link TogetherIn this video, we break down three trading opportunities on USDCHF—two of which can be strategically combined. We start with a structure-based continuation trade, followed by a potential bearish Gartley pattern. What makes this setup unique is the overlap: the Gartley entry aligns with the structure trade’s target, creating an opportunity for a stop-and-reverse transition from one trade to the next. To round things out, we zoom out to the bigger picture and highlight a potential violation-and-run setup that could offer significant upside.
If you have any questions or comments, please leave them below.
Akil
USDJPY at Key Resistance: A Simple Price Action SetupOn USDJPY, we’re seeing a straightforward price action and structure-based trading opportunity develop. Price is currently approaching a previous level of structure resistance, an area where the market has stalled in the past.
If price is able to violate this resistance level, it would provide additional confirmation that buyers are in control and that a continuation move higher is likely. In that scenario, the next objective becomes the next relevant level of structure, where price has previously reacted.
Rather than predicting the move, the focus here is on waiting for confirmation. A clear break and hold above resistance helps validate the bullish case and keeps the analysis simple, objective, and repeatable.
If you have any questions or comments, please feel free to share them below.
Akil