BTCUSDT: Retest Support Can Opens the Path Toward 64,600$Hello everyone, here is my breakdown of the current BTCUSDT setup.
Market Analysis
BTCUSDT previously formed a Head and Shoulders pattern before recovering above the 62,700 Support Zone. Price then moved higher and recently broke above the descending triangle resistance line, signaling a potential bullish shift.
Currently, BTCUSDT is trading below the 64,600 Resistance Zone while holding above the 62,700 Support Zone and the rising trendline. The recent breakout suggests that buyers are atte
Head and Shoulders
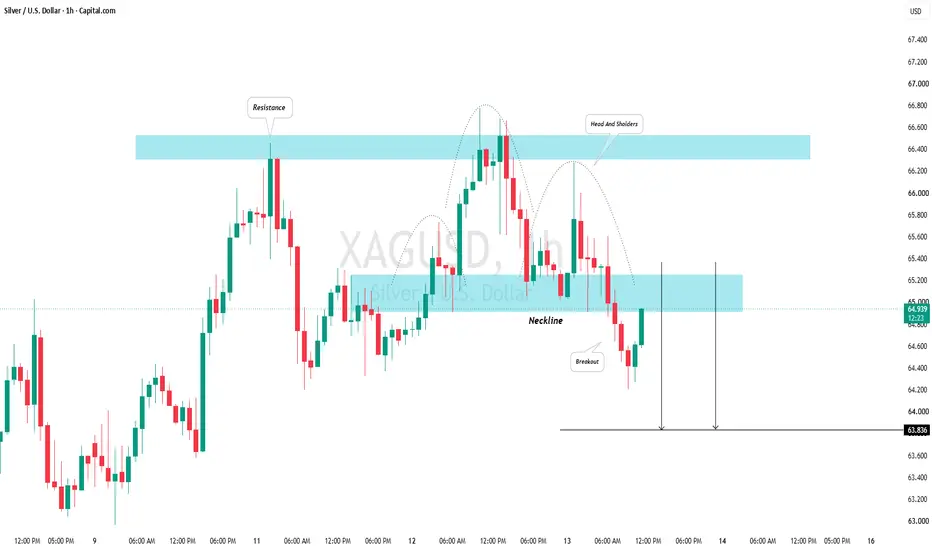
SILVER (XAG/USD): Looks Like It's Set For a Pullback.There is a significant probability that 📉SILVER will experience a retracement from the highlighted key horizontal support level.
The formation of a head and shoulders pattern on an hourly timeframe indicates substantial selling pressure.
Our target is 63.83.
DXY _SELL SETUP The Dollar index is showing bearish pressure after rejecting the 100 .000 pcychological resistance and forming an other B O S .price is currently showing weakness below the marked resistance zone ,suggesting a possible continuation toward the Downside .
Entry : 100.000
Target : 99.800
Stop loss : 100.050
wait for conformation before entering and manage risk properly .
GIS - Resistance Retest and Reverse H&S Setup💡 Swing setup idea
Resistance retest / reverse head and shoulders breakout
🔎 Analysis summary:
The price crossed above the 50 SMA and is now getting back to resistance. We can also see a reverse head and shoulders pattern closing, which makes this setup worth watching.
👀 Levels to watch:
Entry trigger: Break above $38.25
Target: $44.40
Stop: Under the breakout level
💬 Will the price break through this area? Let me know in the comments! 👇
Good luck!
⚠️ Note: This is for educational
COP - 50 SMA Bounce and H&S Setup💡 Swing setup idea
Resistance retest / breakout setup
🔎 Analysis summary:
While we can’t be sure what will happen with oil, the stock is rising from the 50 SMA. We can also see a reverse head and shoulders pattern closing, which makes this setup interesting here.
👀 Levels to watch:
Entry trigger: Break above $126.55
Target: $149.95
Stop: Under the breakout level
💬 Will the stock break through this area and keep the move going? Let me know in the comments! 👇
Good luck!
⚠️ Note: Thi
Is Ethereum forming a head-and-shoulders breakdown?📉 Is Ethereum forming a head-and-shoulders breakdown?
ETH trades near $1,884 after its CPI-driven rally was rejected around $1,920. The chart is now forming a potential head-and-shoulders pattern—but the bearish signal is not confirmed yet.
MACD remains bearish below zero, although the shrinking negative histogram suggests selling momentum is slowing. The next candle close matters more than the current wick.
⚙️ The setup: short on confirmation
A confirmed 15-minute close below $1,883, follow
BNBUSDT 1H — Head & Shoulders | Short-Term Pullback SetupBNBUSDT is showing a potential Head & Shoulders formation on the 1H timeframe, suggesting a short-term corrective move.
The important point is that this setup is short-term bearish only. Our medium-term view remains bullish, so any short position here should be treated as a smaller corrective trade rather than a bet on a full trend reversal.
The structure is clear:
Left Shoulder around the 606–607 area
Head near 612
Right Shoulder developing around the same 606–607 resistance zone
Price has
2 Timeframes, 2 Patterns, 1 BIG Opportunity! I’m seeing TWO different technical patterns developing on TWO different timeframes — and they may be telling the same story.
Let’s start on the weekly chart.
Price has recently collapsed from the 2.1680 area all the way down toward 1.8480 before finding a previous level of structure support.
And rather than simply putting in a V-shaped reversal, price has started forming something much more interesting:
A potential Head & Shoulders pattern.
But here's where things get really interesting…
I
Nifty IT (CNXIT) — Head & Shoulders Invalidation to Inv H&S Bull📈🔥
💻 Technical Analysis Breakdown:
Pattern Structure: Clean, multi-month bottoming structure forming on the Daily chart.
Breakout Zone: Resistance cluster at 31,842 – 32,131 marks the key neckline hurdle.
Consolidation Projection: A right shoulder dip/consolidation before a full macro expansion into late Q3/Q4.
🎯 Targets:
Linear Target: 38,586.65
Log Target: 40,197.95
#NiftyIT #TradingView #TechnicalAnalysis #IndianStockMarket #PriceAction #BreakoutSetup
XRP/USD — 1H Market Structure Analysis🔎 Market Structure
XRP/USD has been in a broader bearish structure on the chart, with price declining from the 1.08–1.09 area toward the 1.01–1.02 region.
The recent recovery has created a short-term ascending trendline and pushed price back into the previously important 1.042–1.052 resistance zone.
This makes the current area a key decision zone, rather than an automatic reversal point.
🟥 Support → Resistance Zone
~1.042–1.052
This zone previously acted as support and was later broken. Pr
JIO FINANCIAL SERVICES (NSE: JIOFIN)Technical Confluence & Pattern Exhaustion
Textbook Downside Symmetry Completed:
Pattern 1 (2024): Head & Shoulders top near ₹394 broke the ₹310 neckline, cleanly hitting the projected linear target near ~₹226 (sweeping liquidity at the opening candle wick near ₹198).
Pattern 2 (2025–2026): Replica Head & Shoulders top near ₹340 broke the ₹290 neckline, hitting the linear target near ~₹240 with exact mathematical precision.
Full Liquidity Absorption & Double Bottom Base:
Downside targets from
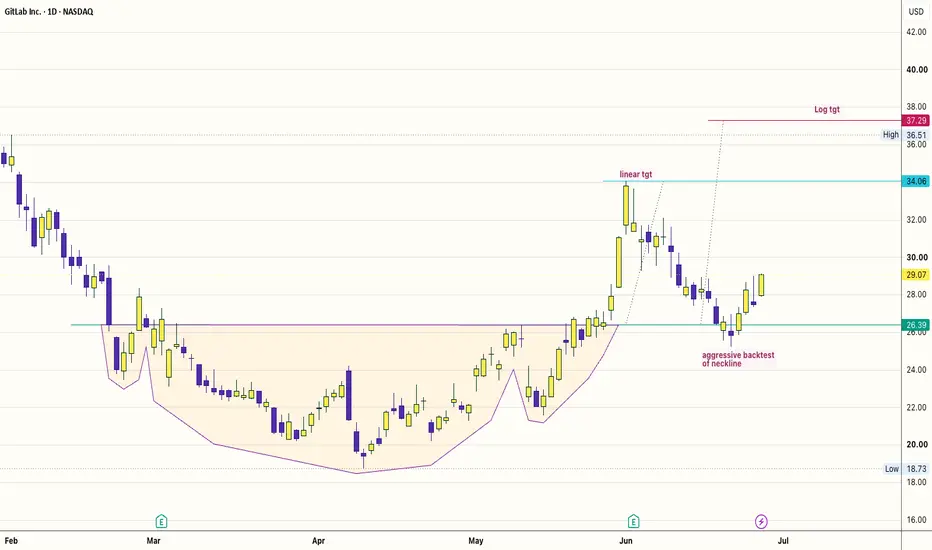
GTLB: Whales Buying the AI Fear — Textbook Neckline Backtest🦊 💻🦊 💻 📈 🚀 📈 🚀
When the broader market panics over sweeping, generalised macro narratives, the smart money quietly separates the structural winners from the noise.Software names got absolutely hammered in June on widespread "AI disruption" fears.
Morgan Stanley recently characterised this environment as a "peak uncertainty" moment for the entire enterprise software landscape.
But while retail investors threw the baby out with the bathwater, the institutional tape tells a completely different
LTC 1D Short & Long SetUp IDEA ! LTC 1D 👀
#LTC is close to forming a Head & Shoulders on the daily chart.
If confirmed I’m watching 32$ to 28$ as the target.
• Below 43.5$ - Short, SL 45.7$
• Above 46.5$ - Wait for 48$ to 51$ then short, SL 53.4$
For the spot buy or low leverage LONG trades, I’ll look to buy below 32$ and hold for the 80$ to 128$ range.
For now I’m just waiting for the setup. 👀
Continuation patternThis looks so bearish. Bearish flag forming in the weekly timeframe. Above it, we have a huge double top and HS, very strong bearish patterns. I opened a short position at current price. My SL triggers if a weekly candle CLOSES above 113. I don't see how this is coming back in the short term. I think eventually is going to drop to 50, but one step at the time.
MESU Aug 7: 7774 Upside or 7682 After 7724 Break?MESU is currently trading between two important higher-time-frame fair value gaps.
The upside imbalance around 7,774 remains open and continues to act as my primary upside liquidity target.
On the downside, the larger fair value gap around 7,682 remains in play.
The key intraday decision level is the overnight low around 7,724.
If buyers continue to defend 7,724, price may still have room to rotate higher toward 7,774.
However, a confirmed 1-hour close below 7,724 would increase the probabi
XAUUSD: Inverse Head & Shoulders Testing Key Neckline ResistanceHi!
Gold is displaying a potential bullish reversal structure, printing a clear Inverse Head and Shoulders (iH&S) pattern right off an established Support & Demand (S&D) zone.
Key Technical Dynamics
Base Formation at Strong S&D Zone: The entire structure has developed directly above a major support region ($4,005 – $4,020 area). The strong buyer presence at this level created the foundation for both shoulders and the head spike lower, signaling robust demand underlying current prices.
DG: Inverse Head & Shoulders Near BreakoutDollar General is testing the neckline of a developing inverse head-and-shoulders pattern near the 0.5 Fib retracement at $128.84.
Momentum is constructive, with RSI above its average, but daily stochastics are already overbought. Because of that, I would avoid chasing price before confirmation.
Entry plan
Primary entry:
Wait for a confirmed daily close above the full $128–129 neckline/Fib zone, ideally followed by a successful retest as support.
Fallback entry:
If price rejects the breakout
XAGUSD BUY 60.90On the daily chart, XAG/USD has stabilized at lower levels, with short-term price action forming a potential head-and-shoulders bottom pattern. Attention should be focused on support near 60.9; if the price pulls back and stabilizes there, further buying could be considered. Key resistance lies near 63.2, and a breakout above this level would open up room for further upside.
HD - Resistance Retest and H&S Setup💡 Swing setup idea
Resistance retest / breakout setup
🔎 Analysis summary:
The price crossed above the 50 SMA and has now come back to resistance. We can also see a head and shoulders pattern forming, with buyers starting to step in.
👀 Levels to watch:
Entry trigger: Break above $358.20
Target: $417.20
Stop: Under the breakout level
💬 Will the price break through this area? Let me know in the comments! 👇
Good luck!
⚠️ Note: This is for educational purposes only and is not financial