Long
Long
 Long
Long
4th Attempt to Break Above 100/200 EMAs (63,700–63,900)Hi traders! ☀️👾
In my last post on Thursday, I wrote:
“A break below the 1H/4H EMA 100 and EMA 200 cluster around 64.2–64.4K would likely accelerate the move toward the next major support level at 62.5K.”
Unfortunately for the bulls, the break below did happen, and we saw the expected acceleration. Bitcoin eventually reached the 62,500 target on Friday, and today, at the opening of the Asian session, Bitcoin printed a low of 62,631, once again coming very close to the 62,500 level 🛡️
🧐What do we see today?
The bounce from 62,500 looks very strong. Moreover, Bitcoin has just broken above the 4H EMA 100 and EMA 200 cluster with a strong impulse. This cluster is currently located around 63,700–63,900.
🦬🚀If we don’t see a pullback now and Bitcoin manages to hold above this cluster, the momentum could accelerate toward 65–65.5K as early as today.
65K remains the key level, as I have mentioned in every post:
“65K is the key level.
The bullish scenario, with upside targets at 67K and 67.6K, will only come back into play if Bitcoin manages to reclaim 65K and, more importantly, hold above it.”
🐻🪓The bearish scenario, with another retest of 62,500, comes back into play if Bitcoin fails to hold above the 63,700–63,900 EMA cluster and falls back below it.
⚠️ Disclaimer:
All information shared on this channel is for educational and informational purposes only and is not investment advice. The author is not responsible for your trading decisions. Always manage your risk and make decisions independently. Amazon.com Holds Earnings GapAmazon.com jumped on strong earnings late last month, and traders may see potential for more upside.
The first pattern on today’s chart is the gap on July 31 after profit and revenue beat estimates. The cloud-computing and e-commerce giant hit a new all-time high the following session before stalling.
Second, its shares ended last week by staying above the July 31 low of $262.01. Does holding the gap mean support has moved higher?
Third, the 8-day exponential moving average (EMA) crossed above the 21-day EMA. MACD is also rising. Those signals could reflect short-term bullishness.
Next, the 50-day simple moving average (SMA) had a “golden cross” above the 200-day SMA in May and has remained there since. That may reflect a longer-term uptrend.
Finally, AMZN is an active underlier in the options market. (Its average daily volume of 870,300 contracts ranks fifth in the S&P 500, according to TradeStation data.) That could help traders take positions with calls and puts.
TradeStation has, for decades, advanced the trading industry, providing access to stocks, options and futures. If you're born to trade, we could be for you. Learn more here about TradingView’s Broker of the Year!
Past performance, whether actual or indicated by historical tests of strategies, is no guarantee of future performance or success. There is a possibility that you may sustain a loss equal to or greater than your entire investment regardless of which asset class you trade (equities, options or futures); therefore, you should not invest or risk money that you cannot afford to lose. Online trading is not suitable for all investors. View the document titled Characteristics and Risks of Standardized Options at www.TradeStation.com . Before trading any asset class, customers must read the relevant risk disclosure statements on www.TradeStation.com . System access and trade placement and execution may be delayed or fail due to market volatility and volume, quote delays, system and software errors, Internet traffic, outages and other factors.
Securities and futures trading is offered to self-directed customers by TradeStation Securities, Inc., a broker-dealer registered with the Securities and Exchange Commission and a futures commission merchant licensed with the Commodity Futures Trading Commission). TradeStation Securities is a member of the Financial Industry Regulatory Authority, the National Futures Association, and a number of exchanges.
Options trading is not suitable for all investors. Your TradeStation Securities’ account application to trade options will be considered and approved or disapproved based on all relevant factors, including your trading experience. See www.TradeStation.com . Visit www.TradeStation.com for full details on the costs and fees associated with options.
Margin trading involves risks, and it is important that you fully understand those risks before trading on margin. The Margin Disclosure Statement outlines many of those risks, including that you can lose more funds than you deposit in your margin account; your brokerage firm can force the sale of securities in your account; your brokerage firm can sell your securities without contacting you; and you are not entitled to an extension of time on a margin call. Review the Margin Disclosure Statement at www.TradeStation.com .
TradeStation Securities, Inc. and TradeStation Technologies, Inc. are each wholly owned subsidiaries of TradeStation Group, Inc., both operating, and providing products and services, under the TradeStation brand and trademark. When applying for, or purchasing, accounts, subscriptions, products and services, it is important that you know which company you will be dealing with. Visit www.TradeStation.com for further important information explaining what this means.  Long
Long
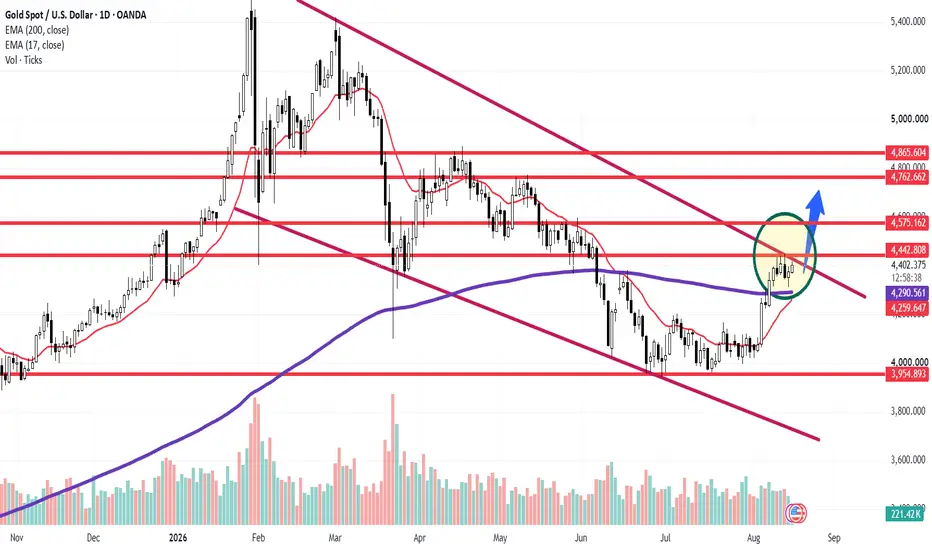
Gold ($XAUUSD) Daily: Dynamic Support Reclaim Sets Up PivotalGold ( OANDA:XAUUSD ) Daily: Dynamic Support Reclaim Sets Up Pivotal Test Against Confluent LTB & 4,442 Resistance Barrier
### 🟨 Gold Spot / U.S. Dollar ( OANDA:XAUUSD ) Daily Technical Matrix (Ref: XAUUSD_2026-08-17_08-58-39.png)
We are releasing an updated Daily (1D) structural study on Gold ( OANDA:XAUUSD ). Following a successful defense and reclaim of its institutional moving average baseline, price action has built a tight accumulation structure (highlighted zone) above dynamic support, positioning for a high-confluence breakout test.
Gold is currently trading up **+0.65% (+28.240 pts)** at **4,405.060**, holding firmly above its short-term and multi-month moving averages.
---
### 🔍 Technical Architecture & Multi-Layered Resistance Roadmap:
Our quantitative matrix isolates key technical hurdles and expansion targets along the active bullish recovery vector (blue arrow):
1. **Institutional Base Defense & Moving Average Reclaim:** Price action has established a solid demand floor above the **200-period EMA (purple line at 4,290.587)** and the **17-period EMA (red line at 4,259.945)**, confirming buy-side absorption during the latest pullback.
2. **Immediate Confluence Ceiling (Key Breakout Node):**
* **Primary Barrier:** **4,442.808** — Static horizontal resistance aligned directly with the primary macro descending trendline (maroon LTB). Clearing this key inflection point is mandatory to confirm macro bullish continuation.
3. **Sequential Overhead Resistance Targets:**
* **Target Node 1:** **4,575.162** — Intermediate horizontal supply zone.
* **Target Node 2:** **4,762.662** — High-volume structural ceiling.
* **Target Node 3:** **4,865.604** — Major macro peak resistance.
---
### 🛡️ Strategic Operational Scenarios:
* **Scenario A — Confluent LTB Breakout & Expansion (Blue Arrow):** A decisive daily candle close above **4,442.808** and the maroon LTB trendline confirms structural breakout momentum, opening a direct pathway toward **4,575.162** and **4,762.662**.
* **Scenario B — Pullback Consolidation Above Dynamic Floor:** Failure to clear **4,442.808** on the initial test will likely trigger a minor consolidation back toward the **200-EMA (4,290.587)** and **17-EMA (4,259.945)** support cluster to accumulate fresh buying volume before another attempt.
### 📊 Tactical Parameters Summary:
* **Current Bias:** Neutral-Bullish Accumulation / Pending Resistance Test
* **Immediate Confluent Resistance Ceiling (LTB):** 4,442.808
* **Secondary Overhead Target Nodes:** 4,575.162 / 4,762.662 / 4,865.604
* **Institutional Anchor Support (200-EMA):** 4,290.587
* **Dynamic Short-Term Support (17-EMA):** 4,259.945
* **Macro Structural Base Floor:** 3,954.893
---
📊 **ChartPro Data**
*Precious Metals Architecture, Dynamic EMA Confluences & Systematic Risk Management.*
⚠️ **Disclaimer:** For educational and informational purposes only. This active market study represents a personal trading framework and does not constitute financial or investment advice.  Long
Long
 Long
Long
 Long
Long
 Long
Long
Northrop Grumman (NOC) LONG — 12H ALMA Setup (WR 78%)█ SETUP
Northrop Grumman · NYSE:NOC · 12H · long only.
ALMA Averaging Strategy: ALMA 3 / σ2, SD band 2, min diff 4 bars to add / 3 bars to exit, 25% per bar, up to 4 adds, hard stop −10% from average entry.
Strategy Tester (NOC 12H):
Win rate 78% · profit factor 3.3 · max drawdown 21%
Avg winning trade +10.5% · avg losing trade −7.0%
Typical hold ~55 bars on winners · defense prime mean-reversion sleeve
═
█ WHY NOW
Tuesday US cash open — 12H ALMA long fired on 30 Jun 13:30 UTC on the same bell as TLN power and ESS exit flow.
Fresh 12H entry ~ $495.68 — aerospace / defense prime on a pullback into the mid-$490s, not a breakout chase. Mark since entry ~ $501.7 (+1.2% open MTM) — first session green after fill.
Hard stop zone −10% from fill ~ $446.10 . Exits follow Pine ALMA flip + min diff or the hard stop — no discretionary TP ladder.
═
█ MACRO
Sector: NOC = US defense prime (aerospace, space, autonomous systems) — budget cycle, contract awards, and geopolitical risk premia matter more than a single CPI print.
Tape (30 Jun): Defense sleeve refilling on the US open while software and REIT legs rotate out. Primes can hold relative bid when headline flow stays geopolitics-heavy.
Calendar: Summer defense budget / NATO spending narratives still in focus — sector beta is macro-sensitive but slower than crypto.
Execution is 12H ALMA mean-reversion, not a contract or earnings forecast.
═
█ OUTLOOK
Positive factors
- 78% WR · PF 3.3 · avg win +10.5% vs avg loss −7.0% — tight DD (21%) for a defense name
- Fresh 30 Jun 13:30Z 12H entry inside publish window
- EMA — LTF at line: 1H Cur L:2 vs Avg L:6.2 · Dev −0.3% — young above-session (not time-overheated), price at the 1H EMA — early bounce sleeve, not a deep below-EMA discount
- ALMA — execution ladder: 4H LONG · L:1 vs LAvg:3.1 · 1D L:1 vs LAvg:3.1 — young above-sessions at the band on the fill bar
- SMC — demand at fill: 4H In OB Bull (Normal) ~$495.68 · OB Enter Normal Bull on the 12H entry bar · daily In FVG Bull ~$496 with FVG Enter Bull — dual bid tags at the add
- Open MTM ~+1.2% right after entry — 12H bar gives room before add grid engages
- Hard −10% stop caps nominal script risk per lot
Negative factors
- SMC — overhead ladder: fresh HTF Bear FVG on the 30 Jun board · 4H FVG New Bear ~$501.85 (26 Jun) and daily bear steps from ~$513 (23 Jun) in recent history — long into supply above $501–513
- EMA — HTF below-EMA stack: 4H Cur S:16 vs Avg S:13.5 (+4.9% dev) · 1D Cur S:71 vs Avg S:10.9 (+6.4% dev) · 3D Cur S:17 vs Avg S:8.6 (+15.9% dev) · 1W Cur S:11 vs Avg S:7.2 (+16.6% dev) — 12H long fights slow-TF below-EMA correction until dailies reclaim
- Defense names can lag in sharp risk-on mega-cap rallies — relative underperformance vs Nasdaq
- Budget headlines are two-sided (spend up vs margin pressure) — macro noise on slow TF
- 12H bars move slowly; mark can sit flat or underwater before ALMA exit fires
- Past backtest ≠ live fills (spread, US cash gap risk on $500 prints)
Takeaway: the 12H ALMA sleeve and tight tester stats back the defense refill, and demand OB/FVG tags the fill — but the slow-TF below-EMA stack and HTF bear FVG ladder frame a bounce against headwind, not a clean trend reclaim; −10% hard stop bounds nominal risk.
Base case: follow the 12H ALMA strategy · LTF LONG holds · grind back toward low-$510s / prior 12H fair-value if defense beta stays bid.
Bear case: daily below-EMA stack extends · lose 12H ALMA band · −10% toward ~$446 hard stop.
Educational idea. Live position — past backtest ≠ future results. NFA.  Long
Long
BTC/USDT: Lower High Rejection Signals Potential Retest of MajorHi!
Bitcoin continues to trade within a broad consolidation structure, but recent price action points to growing downside pressure on the lower timeframes.
Resistance Defense: The major resistance zone between $67,000 – $67,200 held firm, capping recent bullish attempts. The subsequent lower high near $65,600 confirms that buyers are struggling to build upward momentum.
Moving Average Loss: BTC has lost support at the 4-hour 100 SMA ($64,188), shifting short-term control back toward the sellers.
Structural Weakness: The prior reaction near $62,700 marked a failed attempt to sustain higher ground, leaving the chart vulnerable to a deeper pullback.
Outlook & Targets:
As long as price trades below $65,600, the path of least resistance remains tilted to the downside. The primary target for this move is the key Supply & Demand (S&D) zone at $59,800 – $60,400, where significant buy liquidity rests. A sustained breakdown below this box would open the door for a deeper liquidity sweep toward the $57,400 – $58,300 level.
Invalidation: A clean breakout and 4H candle close back above $67,600 invalidates the immediate bearish setup.  Short
Short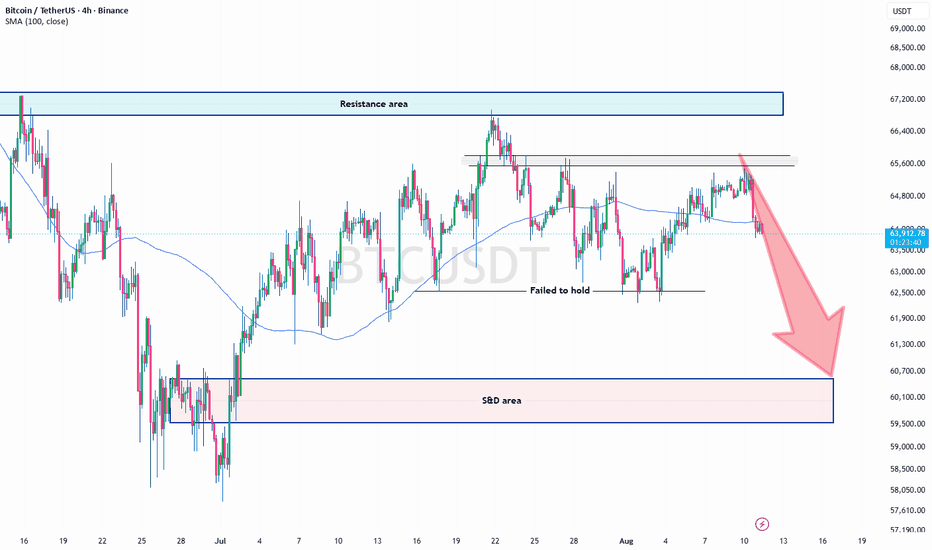
 Long
Long
 Long
Long
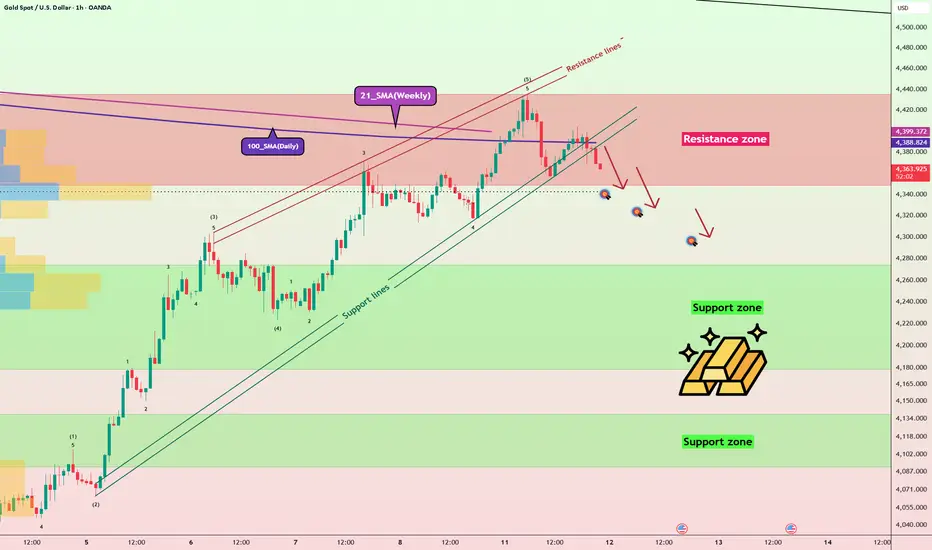
Gold Rejects Key Moving Averages: Is a Deeper Correction?Gold ( OANDA:XAUUSD ) has successfully broken below the Support Lines and recently tested the 100_SMA(Daily) and 21_SMA(Weekly).
However, the price failed to break above these key moving averages and started to decline with strong bearish momentum.
Can gold reclaim $4,400, or is a deeper corrective move already underway?
Technical Analysis
From an Elliott Wave perspective, gold appears to have completed its Primary Wave 5, suggesting that a broader corrective phase to the downside may now be beginning.
The rejection from the 100_SMA(Daily) and 21_SMA(Weekly), combined with the breakdown of the Support Lines, further strengthens the bearish scenario.
💡 Educational Note: After the completion of a Five-Wave Impulsive Structure, Elliott Wave theory typically expects a corrective phase, often developing in an A-B-C structure.
I expect gold to decline at least toward $4,341. If bearish momentum increases, the correction could extend toward $4,315.
Trade Setup
First Take Profit(TP): $4,341
Second Take Profit(TP): $4,320
Third Take Profit(TP): $4,299
Stop Loss(SL): $4,410(Worst)
Key Trading Level: $4,342
Which level do you think gold will reach first?
🔴 $4,299
🟢 $4,410
📌 Gold Analysis(XAUUSD), 1-hour time frame
🛑 Always use proper risk management and set a Stop Loss(SL) for every position.
🚀 If this analysis helps your trading plan, a BOOST would help more traders discover it. Short 
 Long
Long
3 Attempts to Break Above the 64.2–64.4K Resistance ClusterHi everyone!🌴☀️
Unfortunately for the bulls, the expected bounce from 64,000 has not happened yet. Bitcoin has already broken below this level twice and, so far today, has failed to even approach it.
As I wrote earlier:
🐻🪓 “A break below the 1H/4H EMA 100 and EMA 200 cluster around 64.2–64.4K would likely accelerate the move toward the next major support level at 62.5K.”
We did see the expected acceleration, with the current low at 63,158. However, further attempts to push Bitcoin toward 62,500 are still possible today.
🦬🚀The bullish scenario remains unchanged:
”65K is the key level.
The bullish scenario, with upside targets at 67K and 67.6K, will only come back into play if Bitcoin manages to reclaim 65K and, more importantly, hold above it.”
⚠️ Disclaimer:
All information shared on this channel is for educational and informational purposes only and is not investment advice. The author is not responsible for your trading decisions. Always manage your risks and make decisions independently.  Long
Long
 Long
Long
 Long
Long
Liquidity Hunt & Market Reversal | Professional SMC BreakdownHigh Time Frame analysis is the foundation of professional trading. These charts show how price moves through market structure, liquidity zones, Break of Structure (BOS), Change of Character (CHoCH), and institutional order flow.
The first step is always identifying the overall market direction. Initially, price was following a bearish structure where sellers controlled the market and multiple BOS confirmations showed downside continuation. After creating a strong low area, the market started showing signs of weakness in sellers and strength from buyers.
The important shift happened when price created a CHoCH (Change of Character). This indicates that market behavior is changing and buyers are beginning to take control. After CHoCH, price confirmed bullish momentum by creating consecutive BOS to the upside, showing that institutions were supporting higher prices.
Key Lessons From This Chart:
1. Market Structure Comes First Never enter a trade only because of a candle pattern. First understand:
Where is the strong high?
Where is the strong low?
Is the market making Higher Highs & Higher Lows or Lower Highs & Lower Lows?
Structure tells the story of smart money.
2. Liquidity Is The Main Target Institutions often move price toward liquidity areas:
Previous Highs (PWH)
Previous Lows (PWL)
Equal Highs (EQH)
Equal Lows (EQL)
Liquidity is where many traders place stop losses. Smart money often collects this liquidity before the next major move.
3. CHoCH Is The Early Warning Signal A CHoCH does not mean instant entry. It only tells us that the previous trend may be losing power.
Professional confirmation comes after:
CHoCH appears
Price breaks structure (BOS)
Retest occurs at a valid zone
4. BOS Confirms Direction After the bullish CHoCH, every new BOS confirmed buyer dominance. This shows that demand is stronger than supply and the probability of continuation increases.
5. High Time Frame Controls Lower Time Frame The higher timeframe gives the roadmap:
Daily/4H → Market direction and important zones
1H → Setup formation
15M/5M → Entry confirmation
A trader should not fight the higher timeframe trend.
Current Market Education:
Price has shifted from a bearish environment into a bullish structure after breaking previous resistance levels. Buyers are currently defending higher lows, showing strength.
The main areas to watch:
Resistance / Liquidity Zone: Previous highs and weak highs can become liquidity targets where price may search for orders.
Support / Demand Zone: Previous BOS areas and strong lows can act as institutional buying zones.
If buyers continue holding above important structure, continuation toward higher liquidity is possible. However, if price loses the last protected low, the bullish structure can weaken and a deeper retracement may occur.
Professional Trading Rules From This Analysis:
✓ Follow structure, not emotions
✓ Wait for liquidity sweep before entry
✓ Use CHoCH for reversal confirmation
✓ Use BOS for trend continuation
✓ Enter from strong zones, not random candles
✓ Always protect capital with risk management
✓ Discipline is more important than prediction
The biggest lesson: "Professional traders do not predict every move. They wait for the market to reveal its intention through structure, liquidity, and confirmation
Market Structure Shift + Liquidity Expansion
This chart represents a professional Smart Money Concept (SMC) approach where price action is analyzed through structure, liquidity, and institutional order flow.
The market first created a consolidation phase where buyers and sellers were collecting liquidity. During this phase, equal highs and equal lows formed, creating liquidity pools that institutions often target before the next major move.
After the formation of a CHoCH (Change of Character), buyers started gaining control. Price broke previous resistance levels and printed multiple BOS (Break of Structure) confirmations, showing a clear shift from accumulation into bullish expansion.
The strong bullish impulse shows that demand is dominating the market. After the breakout, price entered a retracement phase to rebalance the move while maintaining the bullish structure.
Key Learning Points:
• Accumulation Before Expansion:
Smart money often builds positions during sideways movement before a strong directional move.
• CHoCH Gives Early Confirmation:
A change in market behavior is the first sign that the previous trend may be ending.
• BOS Confirms Continuation:
Every successful break of structure increases the probability of trend continuation.
• Liquidity Is The Target:
Price is attracted toward weak highs, previous highs, and liquidity zones where institutional orders are available.
• Strong Low Protection:
As long as the protected low remains intact, buyers maintain control.
Trading Lesson:
Do not chase large candles after a breakout. Professional traders wait for:
Liquidity sweep
Structure confirmation
Retest of demand/order block
Risk-managed entry
The market does not move randomly; every expansion phase is built after liquidity collection and structural confirmation.
SMC Rule:
First understand where liquidity is resting, then follow where smart money is moving
This chart represents a complete SMC bullish reversal model, where price transitions from a bearish environment into a strong institutional expansion phase.
The market was initially moving inside a range with repeated BOS and CHoCH formations, showing the battle between buyers and sellers. After creating a Strong Low, price started showing accumulation signs and buyers began absorbing selling pressure.
The major turning point came when price broke above the previous bearish structure with a clear CHoCH (Change of Character). This confirmed that market sentiment was shifting from seller control to buyer dominance.
After the CHoCH confirmation, price created multiple BOS (Break of Structure) signals, proving strong bullish order flow. Each breakout created a new higher high and protected higher low, showing institutional buying strength.
Key Educational Points:
1. Trend Reversal Process A professional reversal is not identified by one candle. It develops through:
Liquidity collection
CHoCH confirmation
BOS continuation
Retest and expansion
2. Liquidity & Stop Hunt Concept Before the bullish move, price collected liquidity around previous lows and weak positions. Institutions use these areas to build positions before driving price higher.
3. Strong Low Protection The strong low acts as the foundation of the bullish structure. As long as price respects this area, buyers remain in control.
4. Weak High Liquidity Target The current price is approaching weak highs, where liquidity is resting. Markets often target these areas before deciding the next move.
5. Multi-Timeframe Approach High timeframe defines the direction:
Identify structure shift on HTF
Mark liquidity zones
Wait for lower timeframe confirmation
Execute with proper risk management
Professional Trading Lesson:
Do not buy because price is already moving.
Wait for the market to show: Liquidity → Structure Shift → Confirmation → Entry
SMC Principle:
Smart money does not chase price; it creates the move after collecting liquidity
This chart explains the complete journey of price from bearish distribution to bullish reversal, using Smart Money Concepts (SMC) principles.
The market started with a clear bearish structure, where sellers maintained control by creating consecutive Lower Highs and Lower Lows. Multiple BOS (Break of Structure) confirmations showed continuous downside pressure.
After reaching the lower liquidity area, price formed a Weak Low zone, where selling momentum started decreasing. This area became important because institutions often accumulate positions near liquidity zones before a major reversal.
The major turning point appeared when price created a CHoCH (Change of Character). This was the first indication that market control was shifting from sellers to buyers.
Following the CHoCH, price developed a bullish structure by:
Breaking previous resistance levels
Creating Higher Highs
Protecting Higher Lows
Printing bullish BOS confirmations
This transition represents the shift from seller dominance → institutional accumulation → buyer expansion.
Key Educational Lessons:
1. Identify The Market Phase Every market moves through phases:
Distribution
Expansion
Accumulation
Reversal
Understanding the phase prevents traders from entering against the dominant flow.
2. CHoCH Is The First Signal, Not The Entry A CHoCH only shows that the old trend is weakening. Professional traders wait for:
Liquidity confirmation
BOS confirmation
Retest of demand areas
3. Liquidity Controls Price Movement The market often targets:
Previous Highs (PWH)
Previous Lows (PWL)
Strong Highs
Weak Lows
These areas contain trapped orders and liquidity.
4. Higher Time Frame Gives The Direction The bigger timeframe shows the institutional intention. Lower timeframes should only be used for precise entries after the higher timeframe bias is clear.
Professional Trading Mindset:
Do not focus on predicting every candle.
Focus on understanding where liquidity is located, who controls the structure, and when the market changes character.
SMC Principle:
The trend changes when smart money changes position. First comes liquidity, then structure, then expansion
Education 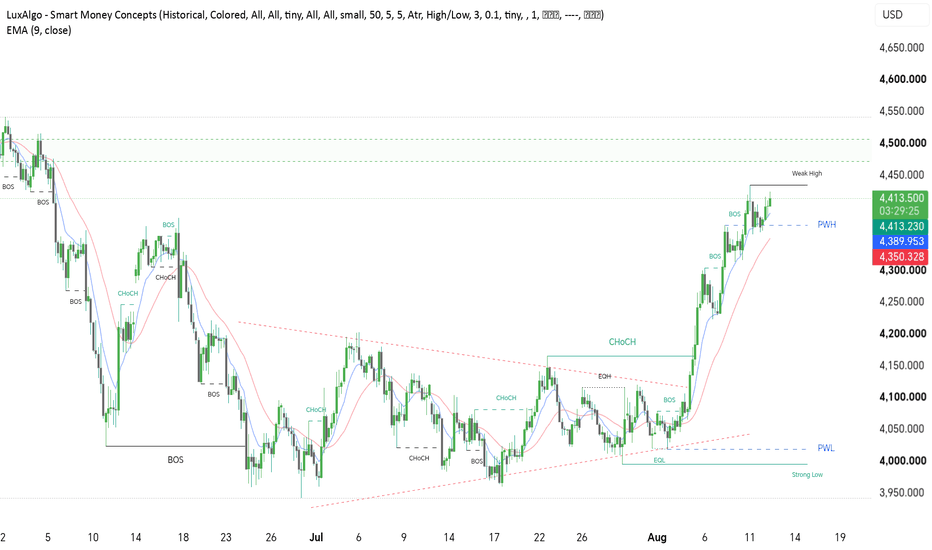
 Long
Long