MarketBreakdown | NZDUSD, EURGBP, US30, SILVER
Here are the updates & outlook for multiple instruments in my watch list.
1️⃣ #NZDUSD daily time frame 🇺🇸🇳🇿
The market is trading in a strong uptrend since the beginning of July.
Higher lows perfectly respect a strong, solid trend line.
I will be looking to buy the pair from that.
2️⃣ #EURGBP daily time frame 🇪🇺🇬🇧
As I predicted earlier, the price went up from a strong support.
The pair is approaching a major falling trend line at the moment.
With a high probability, we will see a pullback.
Alternatively, its breakout will push the prices higher.
3️⃣ #US30 #DOW JONES daily time frame 🇺🇸
As I predicted earlier, US30 retraced after setting a new historical high.
The market is now approaching a major horizontal demand zone.
We can expect another bullish wave from that.
4️⃣ #SILVER #XAGUSD daily time frame 🪙
The market is currently consolidating within a narrow range.
With the absence of high-impact news, we can expect a continuation of sideways price action.
Do you agree with my market breakdown?
❤️Please, support my work with like, thank you!❤️
I am part of Trade Nation's Influencer program and receive a monthly fee for using their TradingView charts in my analysis. EURUSD – Bullish Channel Still in ControlEURUSD has been bullish, with price continuing to trade within the rising blue channel.
Most recently, price reached a strong technical intersection between the upper bound of the channel and the supply zone around 1.1600–1.1620, where sellers stepped in and triggered the current rejection.
This pullback is now bringing EURUSD back toward an interesting area.
📌 As price approaches the lower bound of the rising channel, we will be looking for trend-following long setups, as long as the channel continues to hold as support.
A bullish reaction from this area could open the door for another move toward the upper boundary and supply zone.
For now, the plan is simple:
Let the correction develop, wait for the lower trendline, then look for the bulls to step back in.
⚠️ Disclaimer: This analysis is for educational purposes only and does not constitute financial advice. Always manage your risk and wait for proper confirmation before entering a trade.
📚 Stick to your trading plan regarding entries, risk, and management.
Good luck! 🍀
All Strategies Are Good; If Managed Properly!
~Richard Nasr GOLD: WAITING FOR A BREAKOUTGold remains trapped within the 4,450–4,310 trading range following a strong rally from the 3,940 area. Price is currently approaching a key resistance zone where the range high, overhead liquidity, and a major descending trendline converge, making the 4,430–4,450 area a critical decision zone for the current market structure.
From a technical perspective, the market has not yet confirmed a breakout. Recent upward moves appear to be absorbed around the 4,430–4,450 area, while the support below at 4,310 remains intact. This suggests that gold is currently in a state of balance between buyers and sellers and may require a new catalyst to trigger the next major move.
Bullish Scenario
If price breaks above and successfully holds above 4,450, especially after a successful retest of the breakout level, the current structure could transition into a continuation move, opening the door toward 4,500–4,600, with a more extended target around 4,800.
Bearish Scenario
If price continues to fail around 4,450 and then breaks back below the 4,310 support zone, this could signal a failed breakout and potentially trigger a deeper correction toward 4,250–4,200, with 4,100 as a more extended downside target.
From a macro perspective, gold is currently being influenced by two opposing forces. A weaker U.S. dollar and signs of softer U.S. economic conditions are providing support for gold. However, rising long-term U.S. Treasury yields, combined with inflationary pressure from higher oil prices, could create headwinds for a non-yielding asset such as gold.
Key catalysts to watch include the FOMC Minutes on August 19, PCE data on August 26, and the Jackson Hole Symposium from August 27–29.
TRADING PLAN
Resistance: 4,435–4,450 | 4,500 | 4,550 | 4,600
Support: 4,385–4,370 | 4,310–4,300 | 4,250 | 4,200 | 4,100
BUY: Only consider long positions after price breaks above 4,450 and successfully retests and holds above the level.
SELL: Prefer short positions if a failed breakout develops around 4,450, or if price breaks below 4,310 and fails to reclaim the level on a retest.
NEUTRAL: As long as price remains around the middle of the range, particularly between 4,390–4,400, avoid chasing the market.
Personal View
At the moment, I am not willing to place a large bullish bet simply because gold is consolidating below 4,450. At the same time, there is not yet enough confirmation to take an aggressive bearish position while 4,310 remains intact.
For a potential larger move of approximately 8–10%, I would prefer to remain patient and wait for either a failed breakout around 4,450 or a confirmed breakdown below 4,310. Either scenario would provide a much clearer invalidation level and a stronger risk-to-reward opportunity.
For intraday trading, continue to monitor the boundaries of the range and trade the price action accordingly. BTCUSDT: Sellers Target $62,300 as Price Remains Below $63,600Hello everyone, here is my breakdown of the current BTCUSDT setup.
Market Analysis
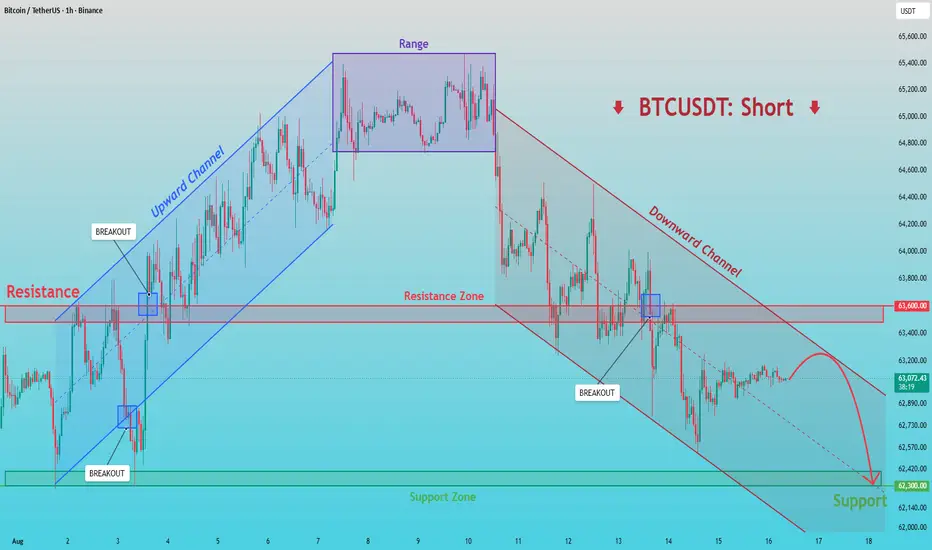
BTCUSDT previously traded inside an upward channel before reaching the 65,400 area and entering a broad range. After several attempts to break higher, price broke below the range support and shifted bearish, forming a descending channel.
Currently, BTCUSDT is trading below the 63,600 Resistance Zone while holding above the 62,300 Support Zone. The recent breakdown and continued movement inside the descending channel suggest that sellers remain in control, with price consolidating below resistance.
My Scenario & Strategy
As long as BTCUSDT remains below the 63,600 Resistance Zone and respects the descending channel, the bearish scenario remains valid. A rejection from current levels could push price toward the 62,300 Support Zone (TP1).
However, a breakout and close above 63,600 would weaken the bearish outlook and increase the possibility of a recovery toward higher levels.
That’s the setup I’m tracking. Thank you for your attention, and always manage your risk.  Short
Short
GOLD - The Hunt for Liquidity Ahead of the Distribution ICMARKETS:XAUUSD maintains its local bullish trend and is entering a consolidation phase, within which a clear trigger is forming. A breakout of this trigger could strengthen the continuation of the upward move
The Dollar Index remains stagnant and is testing support within a downward impulse. Further dollar weakness could become a technical driver for gold upside. The key area to watch is 4,390–4,370.
The correction in gold appears temporary. The fundamental backdrop — including a weaker dollar and expectations of lower Fed rates — continues to support the metal. Key events this week include the FOMC minutes on Wednesday, as well as U.S. housing and industrial production data.
Technically, dip-buying remains the more likely scenario.
Drivers:
Downside: higher oil prices and yields, stronger dollar, geopolitical uncertainty.
Upside: weaker dollar, lower rate expectations, dip-buying
Resistance levels: 4,435, 4,450, 4,500
Support levels: 4,388, 4,371, 4,313
Gold maintains its local bullish trend. The market is confirming resistance at 4,435, but is forming a correction ahead of a potential breakout, with a possible liquidity hunt as the objective.
A bounce from the 4,370–4,388 zone could trigger a breakout above 4,435 and open the way for further upside toward 4,480–4,500
Best regards,
R. Linda  Long
Long
 Short
Short
 Long
Long
 Short
Short
 Short
Short
XAUUSD Short: Rejected From 4,440 Resistance — Correction Ahead?Hello traders! Here’s my technical outlook based on the current XAUUSD (4H) chart structure. XAUUSD previously traded inside a descending channel before breaking above its upper boundary and shifting bullish. Price then formed a range and rallied toward the 4,440 Supply Zone, where sellers rejected the move.
Currently, XAUUSD is trading below the 4,440 Supply Zone while holding above the 4,250 Demand Zone and rising demand line. The latest rejection from resistance suggests that a short-term correction may develop.
As long as XAUUSD remains below the 4,440 Supply Zone and respects the descending supply line, the bearish correction scenario remains valid. A rejection from current levels could push price toward the 4,250 Demand Zone (TP1). However, a breakout and close above 4,440 would weaken the bearish outlook and increase the risk of further upside. Manage your risk! Short 
3 Short-term setup after trendline breakoutThis analysis covers three low-risk setups I use after a trendline or channel breakout. Two are bullish entry strategies, and the third is a sell setup used when the breakout fails. All three rely on waiting for confirmation—such as a retest or a fake breakout—to reduce the risk of false signals.
Let me walk you through the three setups I use most often after a trendline or channel breakout. These are designed to reduce risk by waiting for confirmation before entering a trade.
Learn this : The key to low-risk trading is patience . Entering immediately after a breakout often leads to getting stopped out by a fake move. Waiting for a retest or a clear confirmation signal improves the probability of success and gives you a tighter stop-loss.
Setup 1 – Buy on Retest Using Fibonacci (Higher Reward)
After a breakout occurs and price retests the broken level, a short-term pump usually follows. I draw a Fibonacci retracement on that short-term pump and look for entries at the 0.38 or 0.618 retracement levels.
If the market is bullish on the higher timeframe, I use the 0.38 level for entry.
If the market is bearish or ranging on the daily timeframe, I use the 0.618 level for entry.
The stop-loss is placed below the low of the short-term pump. This setup offers a good balance between risk and reward because the entry is at a discount and the stop-loss is clearly defined.
Learn this: The Fibonacci retracement tool is useful for identifying potential pullback levels within a trend. In a strong trend, price often pulls back to the 0.38 level. In a weaker or ranging market, the pullback tends to go deeper to the 0.618 level.
Setup 2 – Buy on Breakout of Previous High (Lower Risk, Lower Reward)
The second setup is also a buy, but it typically offers lower risk and sometimes lower reward. It involves identifying the previous high of the broken channel or trendline. Once price breaks above that high, I enter a long position.
This is a more conservative entry because the breakout above the previous high provides additional confirmation that the trend is continuing. The stop-loss is placed as 40% of gain to reach that high.
Learn this: Trading breakouts of previous highs is a classic trend-following strategy. It is lower risk because the market has already shown strength by clearing a key level. The reward may be smaller if the move is already extended, but the probability of success is often higher.
Setup 3 – Sell When Breakout Fails (Fake Breakout Strategy)
The third setup is used when the breakout fails and price moves back into the channel or below the trendline. In this case, I enter a sell position to capture the downside move. This setup can also help cover losses from any buy positions that were stopped out.
This is a counter-trend trade that takes advantage of false breakouts. It requires quick execution and a tight stop-loss above the failed breakout level.
Learn this: Fake breakouts are common in the market. They occur when price briefly breaks a key level but fails to sustain the move and reverses. These reversals can be sharp, offering a good opportunity for a short trade with a clearly defined risk level.
Final Thought
These three setups give you a complete framework for trading breakouts. They cover both directions and ensure you are always prepared, whether the breakout succeeds or fails. The key to making them work is discipline—waiting for the confirmation signal before entering and sticking to your stop-loss levels. Education 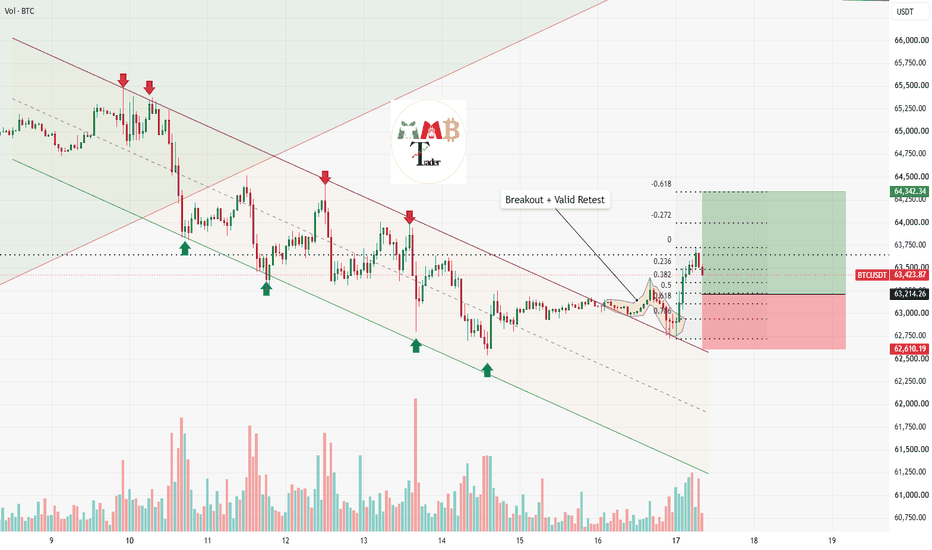
GOLD - The local uptrend continuesFX:XAUUSD is bouncing off the 4,313 support level of the trading range formed within the local bullish trend. The situation remains challenging, but the market still has room for further upside
The dollar remains stagnant but continues to look weak. A decline in the Dollar Index could support further upside and the ongoing local bullish trend in gold.
The fundamental and geopolitical backdrop remains unstable.
Globally, gold remains in a bearish trend.
Locally, the market is in a bullish distribution phase, with a 4,313–4,435 range forming within it.
Gold is currently correcting within the range ahead of a potential move higher.
There are not many major events scheduled for the coming week. Attention will be focused on the FOMC meeting, initial jobless claims, and PMI data
Resistance level: 4,435
Support levels: 4,356, 4,313
A long squeeze around the local 4,356 support zone could shift the balance of power in favor of buyers and trigger a continuation of the local uptrend toward the upper boundary of the trading range
Best regards,
R. Linda Long 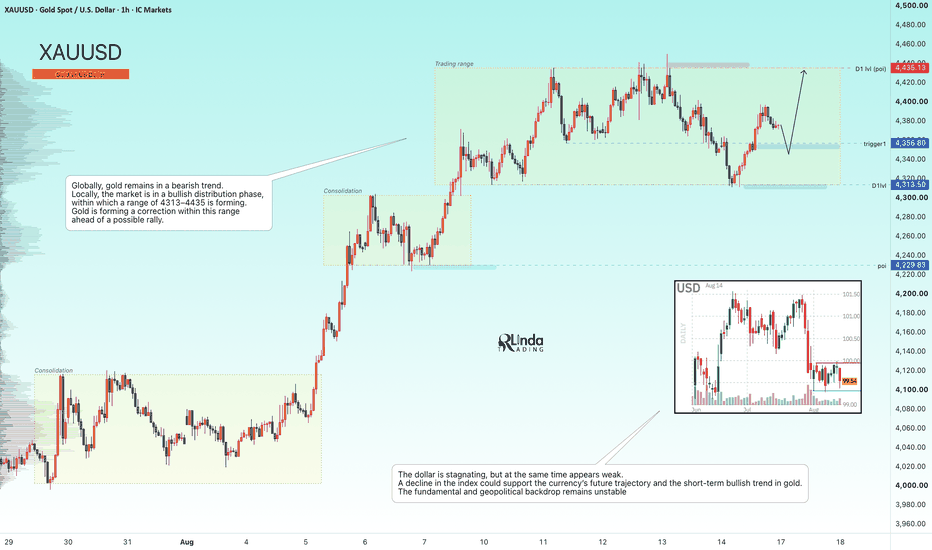
 Short
Short
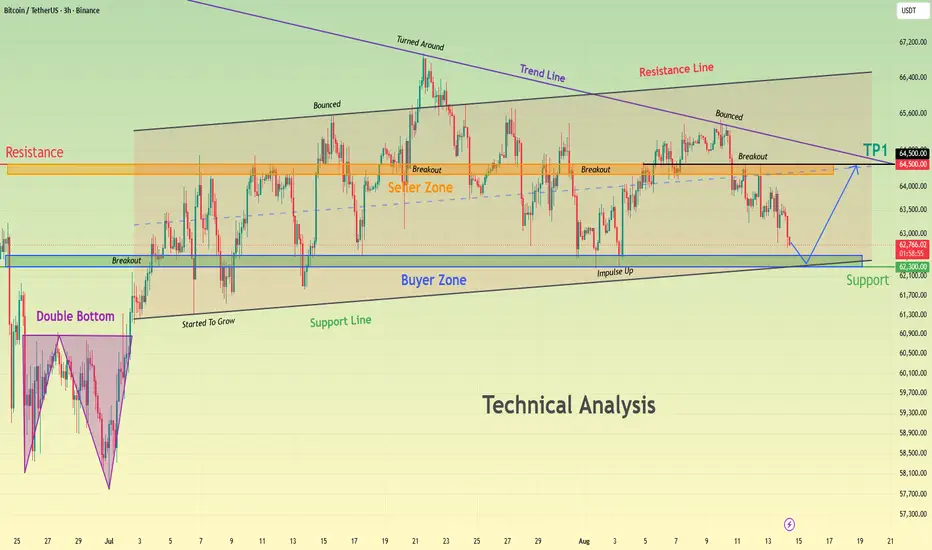
BTCUSDT at Critical Support — Possible Upside Target at 64,500$Hello traders! Here’s my technical outlook based on the current BTCUSDT (3H) chart structure. BTCUSDT previously formed a Double Bottom before breaking above the 62,300 Support Zone and moving higher. Price then developed a broad range between the 62,300 Buyer Zone and 64,500 Seller Zone, while respecting the ascending support line. Currently, BTCUSDT is trading below the 64,500 Seller Zone while approaching the 62,300 Buyer Zone and rising support line. The recent decline suggests a short-term pullback, but buyers may defend this area. As long as BTCUSDT remains above the 62,300 Buyer Zone and ascending support line, the bullish scenario remains valid. A rebound from current levels could push price back toward the 64,500 Seller Zone (TP1). However, a breakdown below 62,300 and the ascending support line would weaken the bullish outlook and increase the risk of further downside. Please share this idea with your friends and click "Boost" 🚀 Long 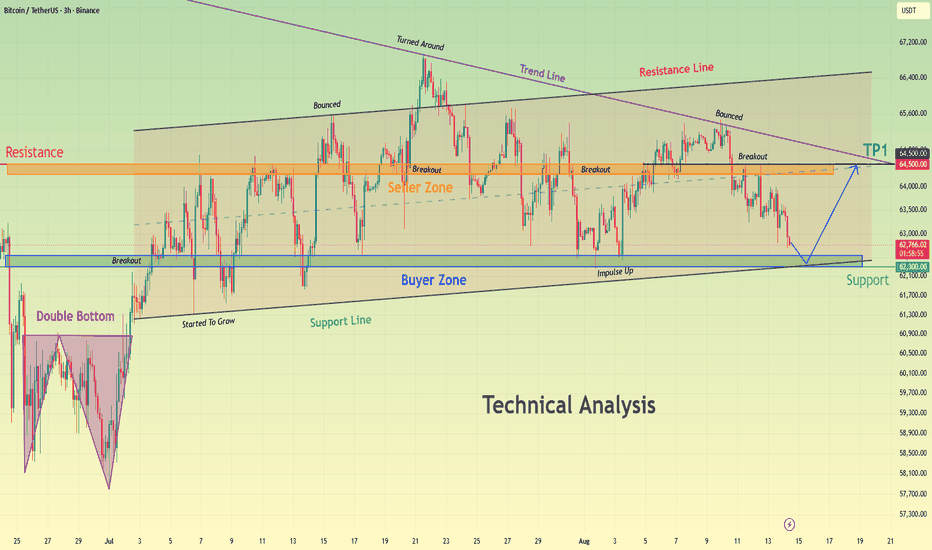
ETHUSDT - Consolidation Before Distribution BINANCE:ETHUSDT is attempting to hold above the 1,850 support level in the medium term, which was previously broken resistance. The reaction to support is weakening, while the broader market remains in a bearish trend
Bitcoin remains stagnant and range-bound. Globally, the market remains in a bearish trend, with no fundamental support in sight.
A decline in the market leader could trigger further downside in Ethereum. The altcoin is consolidating within a symmetrical triangle. The market is building a pre-breakdown base near the lower boundary of the current range, suggesting that a downside breakout may be approaching
Resistance levels: 1,989, 1,927
Support levels: 1,866, 1,854, 1,820
The weak reaction to support indicates that selling pressure may be intensifying. I do not rule out a local liquidity sweep (short squeeze) before the downtrend resumes.
A close below the 1,866–1,854 zone could accelerate the further decline
Best regards,
R. Linda  Short
Short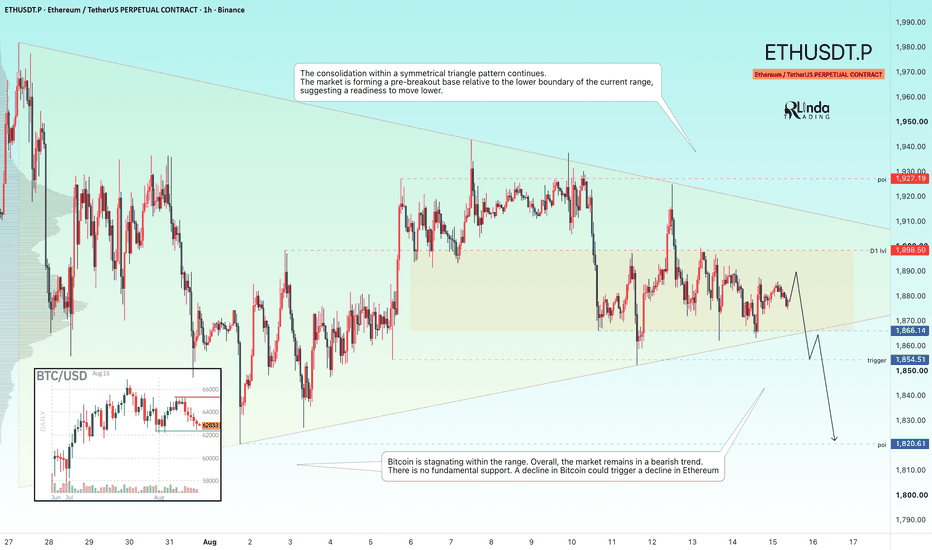
GOLD - The Hunt for Liquidity Ahead of a Rally ICMARKETS:XAUUSD is testing the 4,313 support level as part of a correction. Against the backdrop of a stagnant Dollar Index, the market still has room for further upside
The Dollar Index remains stagnant, but an unstable fundamental and geopolitical backdrop is putting pressure on the dollar and providing support for gold.
Price is correcting after the recent rally, but the fundamental backdrop — including easing rate expectations and geopolitical risks — remains favorable. Buyers are expected to step in on dips.
The key event will be the University of Michigan’s consumer sentiment and inflation expectations data, due later on Friday.
Drivers:
Downside: conflict escalation, rising yields, stronger dollar.
Upside: dip-buying, weaker dollar, easing geopolitical risks
Resistance levels: 4,356, 4,435
Support levels: 4,313, 4,300
Gold maintains its local bullish trend. Within the counter-trend correction, the market is retesting the key liquidity zone at 4,313–4,300 and is bouncing off support.
A close above 4,356 could strengthen the bullish momentum
Best regards,
R. Linda Long 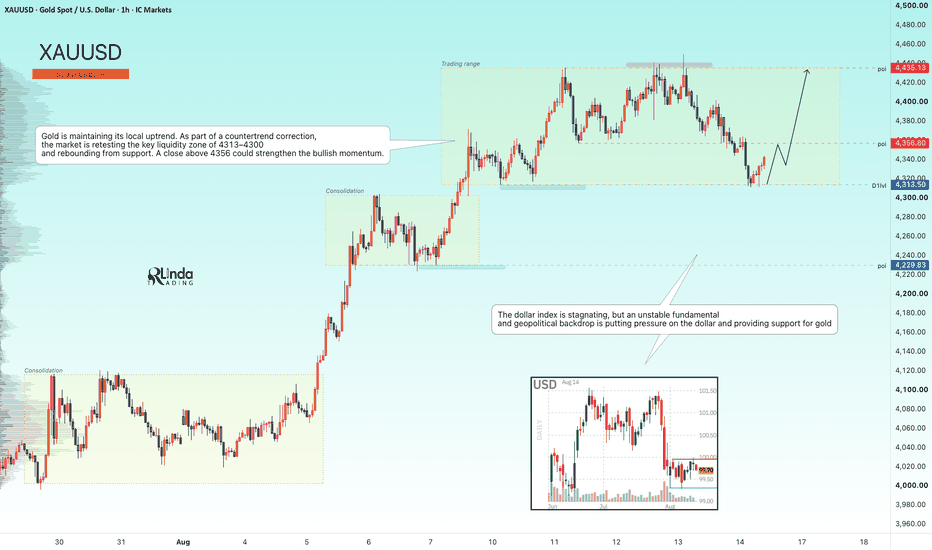

 Long
Long