Gold in a Symmetrical Triangle — Which Way Will It Break?Gold ( OANDA:XAUUSD ) has been trading inside a Symmetrical Triangle over the past three days, and a breakout from either trendline could determine its broader direction over the coming weeks.
The price is currently testing the Resistance Zone and the upper trendline of the Descending Channel.
Can gold break higher, or is another move below $4,000 approaching?
Technical Analysis
From an Elliott Wave perspective, gold appears to be completing a Zigzag Correction.
A Negative Regular Divergence(RD-) has also formed between the last two Consecutive Peaks, indicating weakening bullish momentum.
💡 Educational Note: A Negative Regular Divergence forms when price creates a higher high while the indicator forms a lower high, often warning that bullish momentum is weakening.
I expect gold to resume its bearish trend and decline toward the key trading level of $4,033.
If bearish momentum increases, the price could move toward the lower trendline of the Symmetrical Triangle, the Heavy Support Zone, and eventually below $4,000.
Trade Setup
First Take Profit(TP): $4,043
Second Take Profit(TP): $3,998
Stop Loss(SL): $4,144
Key Trading Level: $4,033
Which level do you think gold will reach first?
🔴 $3,998
🟢 $4,144
📌 Gold Analysis(XAUUSD), 4-hour time frame.
🛑 Always use proper risk management and set a Stop Loss(SL) for every position.
🚀 If this analysis helps your trading plan, a BOOST would help more traders discover it.  Short
Short
GOLD - The bearish trend continuesICMARKETS:XAUUSD remains in a medium-term bearish trend. The recent attempt to break above 4116 failed, and the market has once again transitioned into a selling phase
Gold is currently caught between geopolitical tensions, which tend to strengthen the U.S. dollar, and expectations surrounding upcoming central bank decisions. The next directional move will largely depend on developments in the Middle East and signals from the Bank of Japan. A continued hawkish stance from the Federal Reserve and a stronger dollar are likely to keep gold under pressure, while a weaker dollar and geopolitical de-escalation could support a recovery.
Bullish drivers: Geopolitical de-escalation, U.S. dollar weakness, A less aggressive Bank of Japan, Weaker-than-expected U.S. economic data
Bearish drivers: Escalation of geopolitical tensions (supporting the U.S. dollar), Renewed strength in oil prices, Strong U.S. macroeconomic data, Hawkish Federal Reserve rhetoric
Resistance levels: 4070, 4083, 4116
Support levels: 4028, 3995
The sharp decline in the U.S. dollar was largely a reaction to the Fed meeting and its mixed communication. However, the broader policy stance remains hawkish, supporting the longer-term bullish trend in the dollar and maintaining bearish pressure on gold.
Bears have successfully defended both 4116 and 4083, while price is now consolidating below 4083. Sustained trading beneath this level could provide the technical catalyst for another leg lower
Best regards,
R. Linda Short 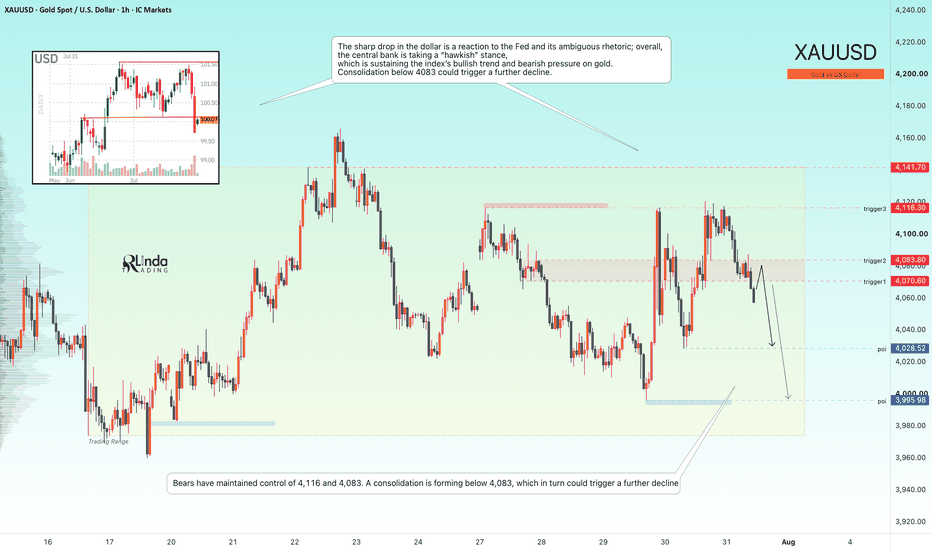
Long 
GBPJPY Breakdown: Is a Deeper Correction Beginning?GBPJPY ( OANDA:GBPJPY ) started to decline after reacting to the upper boundary of the Ascending Channel and the resistance zone(221.35 JPY-219.32 JPY).
After breaking below the support lines, the pair formed a Symmetrical Triangle, and its lower trendline has now been broken.
Can GBPJPY recover, or is the pair entering a deeper corrective phase?
Technical Analysis
From an Elliott Wave perspective, GBPJPY appears to have completed its main Five-Wave Impulsive Structure above the Ascending Channel, suggesting that a corrective phase may now be underway.
The breakdown of the Symmetrical Triangle further supports the bearish scenario.
💡 Educational Note: A Symmetrical Triangle breakout can signal the next directional move, but confirmation is stronger when the breakout aligns with the broader market structure.
Based on these signals, I expect GBPJPY to continue its bearish move and decline at least toward 216.98 JPY.
Trade Setup:
Take Profit(TP): 216.98 JPY
Stop Loss(SL): 218.800 JPY
What’s your view on GBPJPY? Do you think the pair can resume its bullish trend, or should we expect a deeper correction and further downside?
📌 British Pound/ Japanese Yen Analyze(GBPAUD), 4-hour time frame.
🛑 Always use proper risk management and set a Stop Loss(SL) for every position.
🚀 If this analysis helps your trading plan, a BOOST would help more traders discover it.  Short
Short
EURUSD: Sellers Defend 1.1400 — 1.1330 Becomes the Next TargetHello everyone, here is my breakdown of the current EURUSD setup.
Market Analysis
EURUSD previously traded above a rising trendline before breaking below it, confirming a shift in momentum. Price then entered a descending channel, where multiple failed breakouts near the 1.1400 Resistance Zone confirmed that sellers remain in control. The latest rejection from channel resistance reinforces the bearish structure.
Currently, EURUSD is trading below the 1.1400 Resistance Zone while holding above the 1.1330 Support Zone. Price continues to respect the descending channel, suggesting downside pressure remains dominant.
My Scenario & Strategy
As long as EURUSD remains below the 1.1400 Resistance Zone and continues respecting the descending channel, the bearish scenario remains valid. A continuation lower could push price toward the 1.1330 Support Zone (TP1).
However, if EURUSD breaks above the 1.1400 Resistance Zone and the upper channel boundary, the bearish outlook would weaken, opening the door for a stronger recovery.
That’s the setup I’m tracking. Thank you for your attention, and always manage your risk. GOLD - Ahead of the Fed meeting. Bearish trendICMARKETS:XAUUSD is rebounding from the 4000 level but remains trapped within the 4010–4050 trading range. At the same time, the U.S. Dollar Index has entered a consolidation phase as markets await the upcoming Federal Reserve meeting
Gold is trading cautiously ahead of the Fed decision amid renewed geopolitical tensions. The key catalyst will be the Fed's guidance on the future path of interest rates. Any hint of a dovish shift could fuel a rally in gold, while a hawkish message would likely restore downside pressure.
Bullish drivers: Dovish Fed rhetoric, A weaker U.S. dollar, Lower rate expectations, Geopolitical de-escalation
Bearish drivers: Hawkish Fed guidance (persistent inflation concerns, hints of further tightening, a more hawkish voting balance), Escalation of geopolitical tensions, supporting both the U.S. dollar and oil prices
Resistance levels: 4070, 4083, 4116
Support levels: 4011, 3983
Fundamentally, there are reasons to expect the Federal Reserve to maintain a hawkish tone. From a technical perspective, gold remains under pressure within a broader bearish trend. As a result, the upcoming news-driven volatility could trigger a retest of the 4070–4083 resistance zone—or even 4116—before the downtrend resumes toward the 4000–3950 area.
Best regards,
R. Linda Short 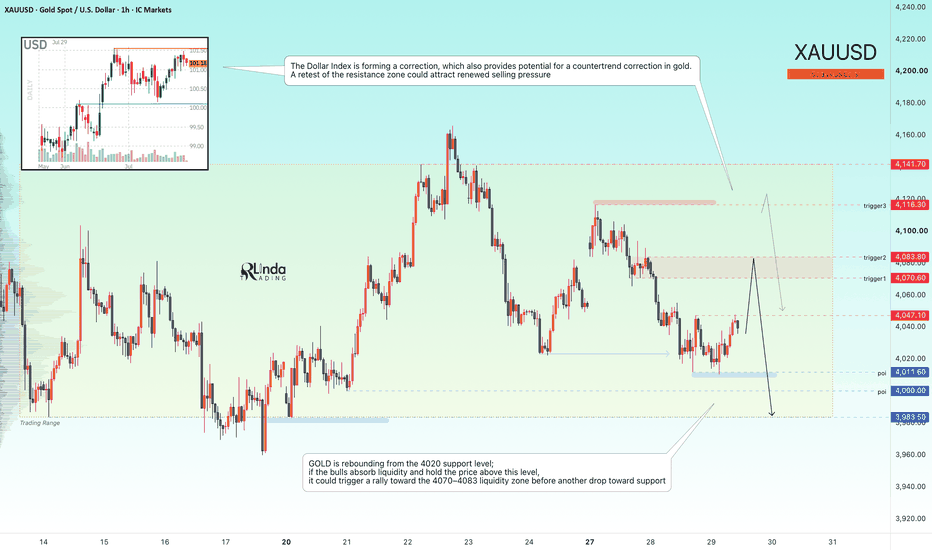
Long 
 Long
Long
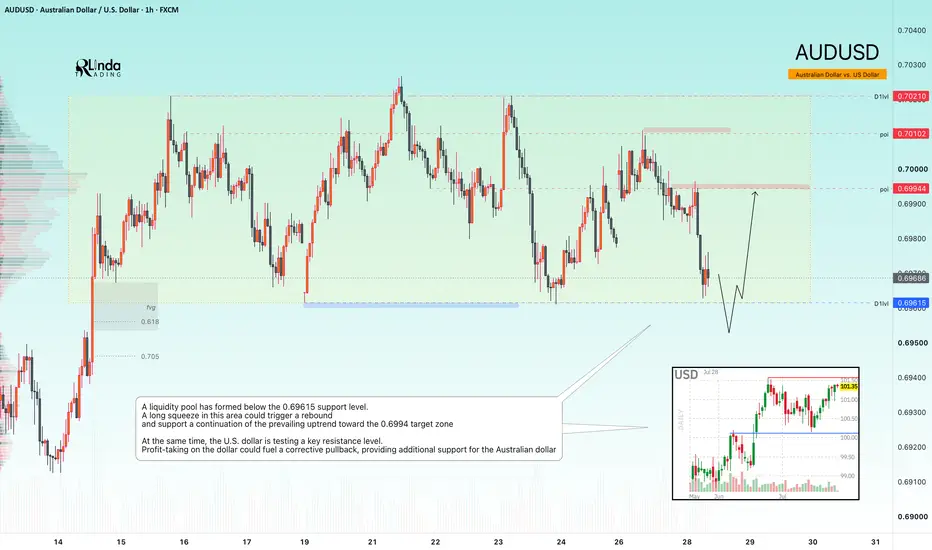
AUDUSD - A long squeeze could trigger a rally FX:AUDUSD is testing a key support zone, with a significant liquidity pool positioned just below it. The broader daily trend remains bullish, giving buyers an opportunity to regain control
At the same time, the U.S. Dollar Index is testing resistance. Profit-taking near the 101.5 area could trigger a pullback in the dollar, providing additional support for the Australian dollar.
From a technical perspective, a substantial liquidity pool has formed below 0.69615. A long squeeze in this area could trigger a rebound and support a continuation of the prevailing uptrend toward the next target zone
Resistance levels: 0.6994, 0.7010, 0.7021
Support level: 0.6960
A false breakout below 0.69615, followed by a recovery and sustained consolidation above this level, could become the technical catalyst for a rally toward 0.6994–0.7020
Best regards,
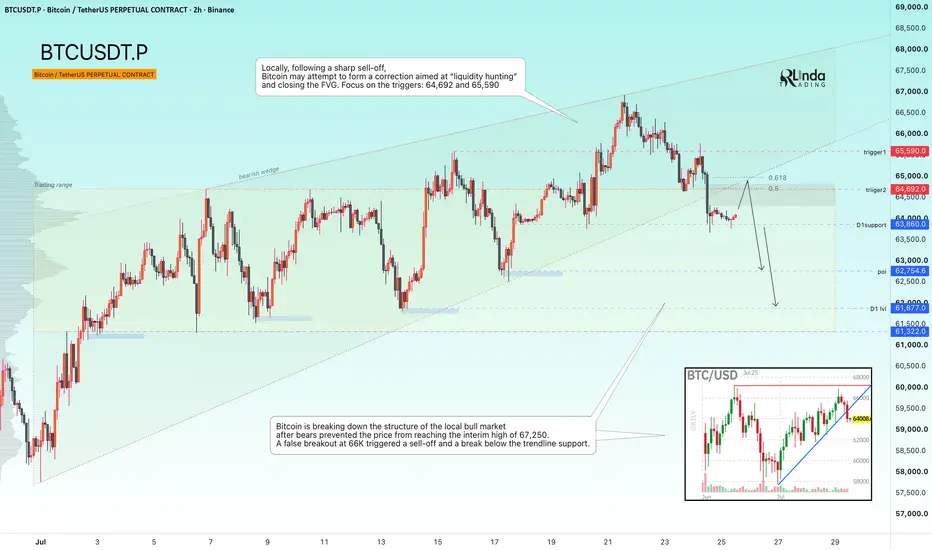
R. Linda BITCOIN - A countertrend correction before a decline BINANCE:BTCUSDT.P is breaking the local bullish market structure within a broader bearish distribution phase while also forming a false breakdown below the 63,680 support area. The market continues to reinforce the dominance of the higher-timeframe bearish trend, although a corrective rebound remains possible before the next leg lower
Higher timeframe: The broader bearish trend remains intact. Sellers prevented price from reaching the key technical retracement level at 67,250, while a weak fundamental backdrop and continued ETF outflows continue to weigh on market sentiment.
From a technical perspective, Bitcoin has invalidated the local bullish structure after bears rejected the advance toward 67,250. The false breakout above 66K triggered a sharp sell-off and was followed by a break below the ascending trendline support
Resistance levels: 64,692, 65,590
Support levels: 63,860, 62,750, 61,322
Following the recent decline, Bitcoin may attempt a countertrend correction to sweep liquidity and fill the existing fair value gap. The primary focus remains on the 64,692 and 65,590 resistance levels. A short squeeze into this resistance zone could provide the technical setup for another bearish reversal toward the lower boundary of the current trading range
Best regards,
R. Linda  Short
Short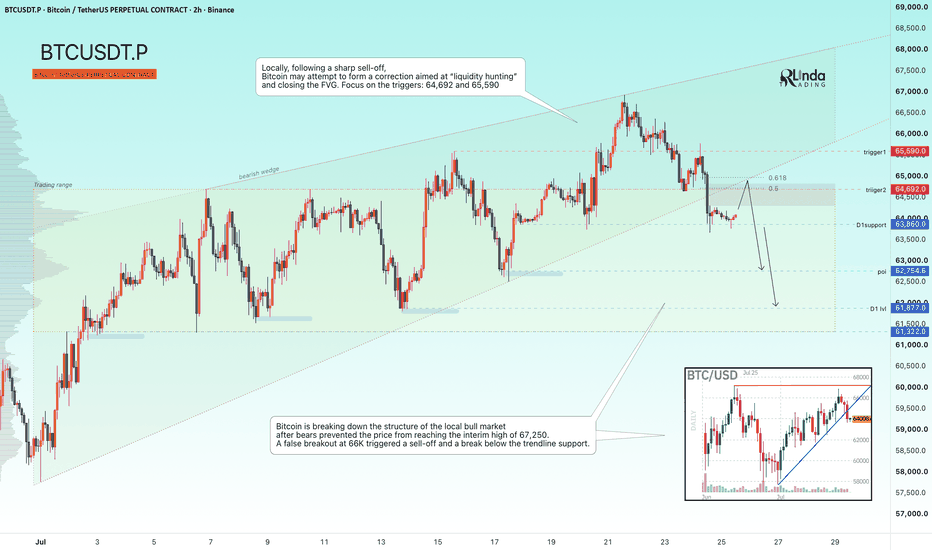
EUR/USD Coiling For Another Leg LowerIt may not have arrived after a prolonged bullish run, but Monday's bearish pin candle from a known resistance level still warns downside risks are evident in the days ahead.
Not only does EUR/USD remain in a well-established longer-term downtrend beneath its key medium and long-term moving averages, but we're also seeing a shorter-term bearish trend emerge from the middle of July, with each bounce ending in failure. That leaves the price coiling in a structure that resembles a descending triangle, a bearish continuation pattern.
A convincing break beneath 1.1364 would put the 38.2% Fibonacci retracement of the Jan 2025-Jan 2026 bull move at 1.1355 into focus. Should that level also give way, the June 24 swing low at 1.1325 becomes the next downside target.
Shorts could be considered on a break of either 1.1364 or 1.1355, depending on entry preference, with a stop above the respective breakdown level for protection.
Beneath 1.1325, there is very little technical support evident until 1.1200, suggesting the broader downtrend may extend further should the coiling price action resolve to the downside.
The message from the oscillators is also mildly bearish. RSI (14) remains below 50 while setting lower highs, while MACD is on the cusp of a bearish crossover, reinforcing the view that downside momentum is beginning to build. For now, the technical picture continues to favour selling rallies and downside breaks.
Good luck!
DS

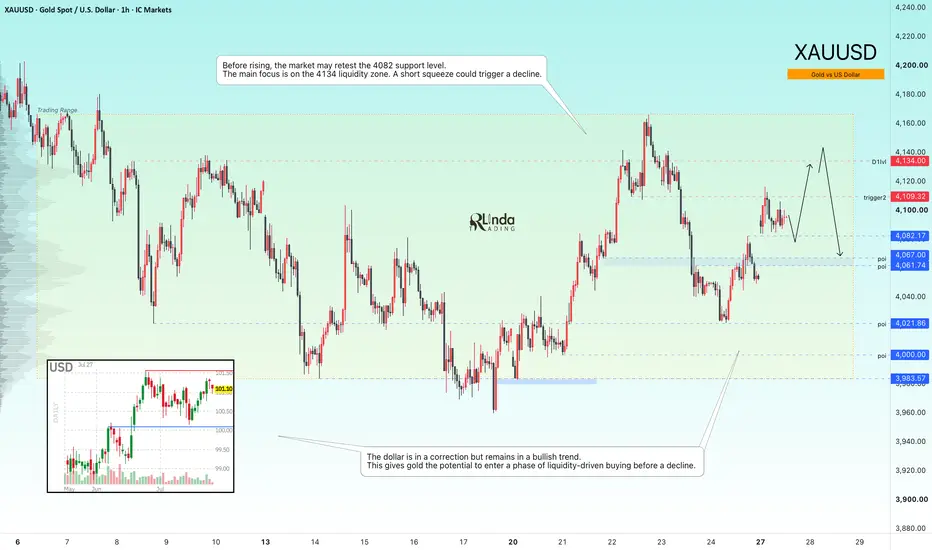
GOLD - Correction Before a Decline ICMARKETS:XAUUSD remains under pressure from the broader bearish trend. However, within this primary direction, the market is developing a sideways range and a countertrend correction. A stronger U.S. dollar could once again weigh on the metal
Gold has received temporary support from the recent geopolitical pause and a softer U.S. dollar. However, the sustainability of the recovery remains uncertain as markets await the upcoming Federal Reserve decision and further developments in the Middle East. Technical indicators continue to point to a bearish bias, limiting buyers' appetite.
Bullish drivers: Further U.S. dollar weakness, Geopolitical de-escalation, Lower oil prices and bond yields, A dovish signal from the Federal Reserve
Bearish drivers: Renewed geopolitical escalation, Rising oil prices, Hawkish Fed rhetoric, Renewed U.S. dollar strength
Resistance levels: 4109, 4134
Support levels: 4082, 4067, 4028
Although the U.S. dollar is currently in a corrective phase, its broader trend remains bullish. This could allow gold to complete a liquidity sweep before resuming its decline.
Before any further advance, gold may retest the 4082 support level. The primary focus remains on the 4134 liquidity zone, where a short squeeze could trigger another bearish reversal
Best regards,
R. Linda Short 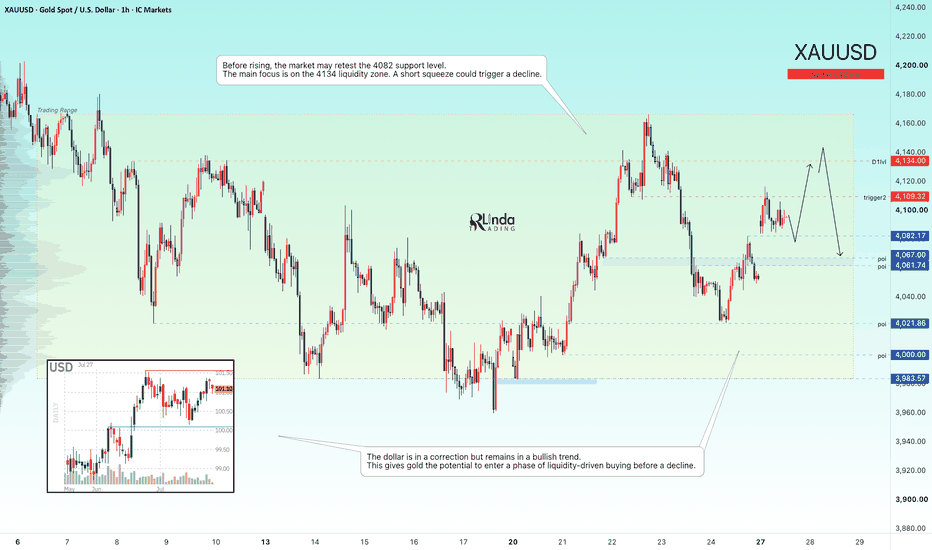
PKG- This Boring Stock Could Be My Swing Trade of the YearThese are the swing trades every trader hopes to find.
Last Friday, PKG had a massive breakout day, gaining more than 8% and pushing above a textbook symmetrical triangle pattern.
What makes this breakout even more interesting is that it wasn't driven by technicals alone. It was backed by several strong fundamental catalysts all hitting at the same time: an earnings beat, solid shipment data, and optimistic guidance around future pricing realization. That's exactly the kind of news flow you want to see supporting a technical breakout.
From a chart perspective, the stock has been consolidating inside this symmetrical triangle since late 2024, and Friday's move finally broke it to the upside. On top of that, volume has picked up significantly over the last three trading sessions, adding confidence that this is a genuine breakout rather than a fakeout.
Key levels-
Breakout level: $249.51 (green line on the chart)
Target 1: $308.20 (+23.52% from the breakout), R/R: 8.88
Target 2: $363.95 (+45.86% from the breakout), R/R: 17.31
Trade idea
As I'm writing this, U.S. index futures are trading strongly higher, with S&P 500 futures up more than 1%. That increases the chances that PKG continues its momentum at the open.
That said, I wouldn't be surprised to see a short-term pullback first. The stock is looking stretched after Friday's move, with the 30-minute RSI sitting around 85, which suggests it's in overbought territory.
Ideally, I'd like to see a healthy retracement back toward the $250–$252 area. That would give the stock a chance to cool off while potentially offering a much better risk/reward entry.
My stop-loss is $242.90, slightly below the third peak of the triangle. If price falls back below that level, it would invalidate the breakout in my view, which is why that's where I'm defining my risk.
Overall, I like this setup because it combines a clean technical breakout with strong fundamental support. The trend is now pointing higher, and if buyers continue to defend the breakout level, this could have plenty of room to run over the coming weeks.
 Long
Long
Three tries at 0.9890. Wednesday's CPI decides the fourthAUD/CAD - long swing setup, ARMED (1D)
THE SETUP
AUD/CAD has run into the same ceiling three times this month. The daily highs print at 0.98874, 0.98890 and 0.98882 - 1.6 pips between the highest and the lowest, which is close enough to call it one price. Underneath it the lows keep rising: 0.97613, then 0.98024, then 0.98079, then 0.98463 today. Flat top, rising floor. That is an ascending triangle, and the coil is tight enough that ADX has dropped to 13.2 while all twelve moving averages I track sit below price.
I am not long yet. This arms on a daily close above 0.9890.
CONFLUENCES
- Trend agrees: price above all 12 MAs, the 200 EMA is 275 pips below at 0.96023
- Flat resistance tested three times inside 1.6 pips
- Four consecutive higher lows compressing into it
- RSI 55, so momentum is with the trend but nowhere near overbought. Room to run
- A dated catalyst that points the same way as the trade
- Clean invalidation: no close above 0.9890 means no trade and nothing risked
FUNDAMENTALS
Australian Q2 CPI lands Wednesday 29 July. Trimmed mean is expected at 3.7% against 3.5% prior, and June employment already surprised hard at +76.3K, which pushed pricing toward an RBA hike on 11 August. The other leg is asleep: the Bank of Canada held at 2.25% in July for a sixth straight meeting and does not meet again until 2 September. One side has a catalyst, the other has none.
The risk cuts both ways. A soft CPI removes the August hike case and this triangle likely resolves downward instead. That is precisely why there is a trigger rather than a position.
TRADE PLAN
Trigger: daily close above 0.9890
Entry zone: 0.9884 - 0.9893
Stop loss: 0.9840 (below the last higher low at 0.98463)
TP1: 1.0000, parity (+1.12% | 2.2R)
TP2: 1.0017, the measured move - triangle height is 128 pips (+1.29% | 2.6R)
Watch 0.9944, the June high, for friction on the way. I scale there rather than treat it as a target.
Invalidation: no daily close above 0.9890.
Every call I publish goes in the public scorecard, wins and losses both.
So which are you: take the close above 0.9890, or wait for CPI to print and pay up for the certainty?
Not financial advice. Trade your own plan and manage risk.  Long
Long
EURUSD: Breaks Below Rising Channel – 1.1330 Support in FocusHello everyone, here is my breakdown of the current EURUSD setup.
Market Analysis
EURUSD previously traded inside a large symmetrical triangle before breaking below support, confirming a bearish shift in market structure. After the breakdown, price consolidated inside a broad range and later broke lower once again, extending the downtrend.
Currently, EURUSD is trading inside an upward channel while remaining below the 1.1430 Resistance Zone and the long-term descending trendline. The latest rejection near channel resistance suggests sellers continue defending the upper boundary despite the recent recovery.
My Scenario & Strategy
As long as EURUSD remains below the 1.1430 Resistance Zone and continues respecting both the descending trendline and the upper boundary of the ascending channel, the bearish scenario remains valid. A rejection from current levels could push price toward the 1.1330 Support Zone (TP1).
However, if EURUSD secures a confirmed breakout above the 1.1430 Resistance Zone and the long-term trendline, the bearish outlook would weaken, allowing buyers to extend the recovery.
That’s the setup I’m tracking. Thank you for your attention, and always manage your risk.