Helium - Poss Tri forming in RHS of IH&S 100% gain Bullish case, 100% gain back up to ATH and IH&S target
Still forming so may not play out but nice to be early
price over 200EMA
New $20 tariff for unlimited data so better than their competition
but its another 100% up in crypto when the cycle is right in crypto
Not advice, just for educational purposes
Triangle
Gold - Asc Tri and Fibs working together to give exact targetsBullish Gold.
It was very obvious that Gold was going up to the Fib and Asc Triangle targets earlier this year.
It was not beyond the wit of man to see this move and trade it.
Now that you can see Asc tringles happen all the time and that projecting fibs from the prior move top to bottom can be used for Gold to set price targets.
Gold is still in a strong uptrend after consolidation and push back off this KLOS expect to Gold to move back up to resume trend
Ramelius - Gold miner to go 36x if tri works Bullish case - Long term chart shows tri pattern and if the target is met it takes 3600% to get there
This relies and helps predict that the Gold price will over time move up much higher and the gold miners stocks like this one will go up
not advice just educational purposes
Palladium 50% move up break out of wedge and over 200 EMABullish case, price sitting over 200 EMA and broken out of the wedge it was in
If the reported shortages in the supply are true as demand is higher than current worldwide production then its positive for the price
Price does not need to stop it could go back to ATH and over if supply cannot meet demand for over 200% gains which might be a short squeeze and get there quickly.
Bearish case price will move back into extending the wedge pattern and for further consolidation
Potential Breakout in Taiwan SemiTaiwan Semiconductor Manufacturing has squeezed into a tight range for months, and some traders may think a breakout is starting.
The first item on today’s chart is the series of higher lows since July. TSM has mostly stayed under $434.16, the final price on July 2. That ascending triangle is a potentially bullish continuation pattern.
Second, the foundry giant closed $0.51 above that old resistance on Friday. It was the second-highest weekly close ever. Is the triangle resolving to the upside
$OTHERS The altcoin market is finally showing signs of life.
CRYPTOCAP:OTHERS has just broken out of its weekly structure. Something we haven’t seen since 2024.
For months, the altcoin market has remained trapped below this level, with multiple attempts failing to break through. Now, for the first time in nearly two years, we have a weekly breakout.
That doesn’t automatically mean altseason is here. But it does mean the market structure has changed and momentum is building.
The important part now
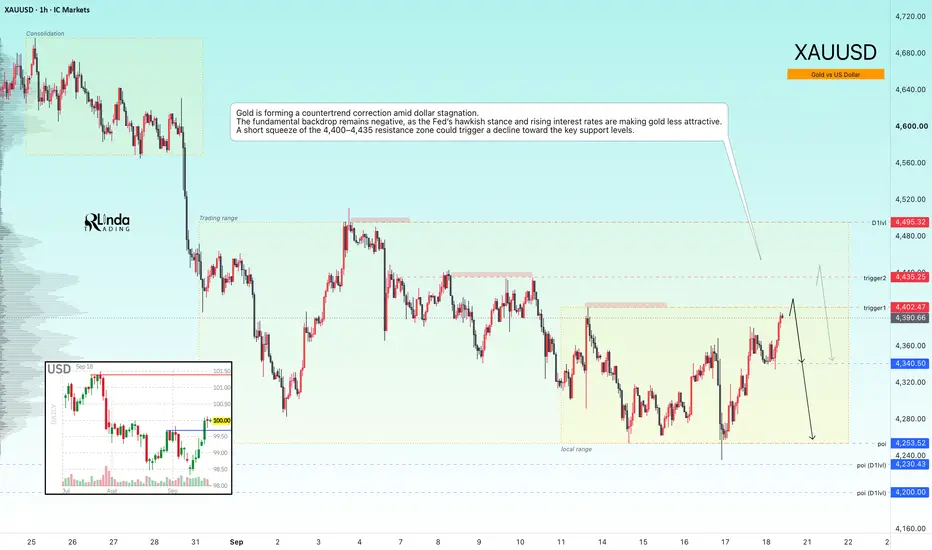
GOLD - The Hunt for Liquidity Ahead of a Decline ICMARKETS:XAUUSD continues to form a countertrend correction, driven by the decline in oil prices. The fundamental backdrop remains weak...
The dollar is stagnating after a strong rally triggered by the Fed’s hawkish stance and rising interest rates. However, the Dollar Index remains strong, which continues to put pressure on gold. At the same time, the decline in oil prices has given the metal some room to recover. The market remains highly dependent on geopolitical developments.
There is
HBAR Macro Symmetrical Triangle — $0.56 Breakout Target & $3.09 HBAR/USD | 1M Chart | Macro Technical Setup
HBAR is compressing inside a large multi-year symmetrical triangle, with price continuing to respect both the descending macro resistance line and rising support from the cycle lows.
On the monthly timeframe, this is becoming a significant compression structure. Price is currently around $0.084, so the setup remains unconfirmed — the important event would be a decisive breakout and higher-timeframe acceptance above the descending trendline.
The Tria
BTCUSDT Long: Rebound from 75,000 as Price Targets 79,000Hello traders! Here’s my technical outlook based on the current BTCUSDT (3H) chart structure. BTCUSDT previously broke higher along the Demand Line and tested the 79,000 Supply Zone, where sellers rejected the upside before pulling back.
Currently, price holds below 79,000 while staying above the 75,000 Demand Zone and ascending Demand Line. The recent bounce suggests buyers are preparing for another move higher.
As long as BTCUSDT remains above 75,000 and respects the Demand Line, the bullish
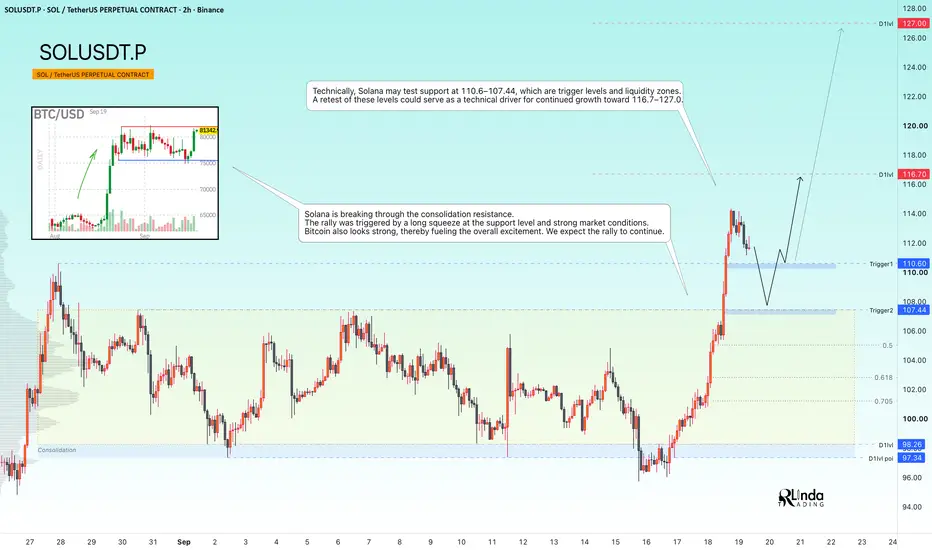
SOLUSDT - A hunt for liquidity ahead of the rally's continuationBINANCE:SOLUSDT confirms its bullish market structure. The long squeeze of support that we expected in the previous analysis played out perfectly. The bulls quickly took control of the situation and strengthened their positions...
Previously, we discussed how the market turned out to be stronger than expected: Bitcoin showed virtually no reaction to higher interest rates, the Fed’s hawkish stance, or the fact that the CLARITY Act was not passed. Consolidation continued, which further confi
SOLUSDT - The Hunt for Liquidity Before Growth Resumes BINANCE:SOLUSDT.P continues to consolidate, just like the rest of the market. Technically, this is a favorable sign for further upside. However, important news is ahead...
Bitcoin is in consolidation, as is the rest of the market. Key news is ahead: the FOMC meeting and consideration of the cryptocurrency legislation.
Solana is also consolidating, while at the same time maintaining its local bullish trend amid expectations of upcoming news. Technically, a liquidity pool has formed below 97
GOLD - A countertrend correction aimed at liquidity huntingICMARKETS:XAUUSD has been forming a countertrend correction toward the 4,400–4,430 liquidity zone since the session opened. The fundamental backdrop remains weak, and the market is still in a bearish trend
The dollar is stagnating after breaking through local resistance levels. The Fed’s hawkish stance and rising rates are supporting the Dollar Index, which is putting medium-term pressure on the metals market. However, the correction in oil prices is giving gold some room to recover as it
HYPEUSDT - Consolidation in a bull market...BINANCE:HYPEUSDT.P is consolidating within the 76.70–90.0 range. The altcoin is maintaining its bullish trend, while the current range following the strong rally suggests that this coin is stronger than the broader market
Bitcoin remains in consolidation and has shown virtually no reaction to higher interest rates or the failure of the CLARITY Act to pass. This confirms the strength of the market.
HYPE is also still consolidating. A false breakdown of support followed by a return to the ra
$WLD triangle with great news WLD – Major breakout setup + growing real-world adoption 👀
WLD is compressing inside a large symmetrical triangle and is approaching the key $0.44–$0.48 resistance zone.
A confirmed breakout with volume could open the way toward $0.60–$0.70, with the larger $1.00–$1.10 zone as the macro target area.
Fundamentals are starting to line up with the chart:
• World Money launched across 150+ countries
• World ID × Tinder / Match Group is expanding, bringing proof-of-human verification into a major
NEAR Protocol — Multi-Year Symmetrical Triangle NEAR Protocol is approaching the apex of what appears to be a multi-year symmetrical triangle, formed by a sequence of lower highs pressing against a rising support structure.
This consolidation has been developing since the 2022 cycle high and represents a significant compression in NEAR's long-term price structure.
The Pattern
The structure is characterized by:
Descending resistance connecting the major 2022, 2024 and subsequent lower highs
Ascending support connecting the major bear-marke
NEAR Protocol Update: Is the Multi-Year Breakout Starting? | $20NEAR/USD — Follow-Up to My Multi-Year Symmetrical Triangle Setup
This is a follow-up to my previous NEAR Protocol analysis, where I identified the multi-year symmetrical triangle that has been compressing since the previous market cycle.
In this video, I revisit that setup and break down where NEAR currently sits within the structure, what I’m watching for confirmation, and why a successful higher-timeframe breakout could become significant.
The primary technical setup remains:
Multi-Year Sy
Bearish Liquidity Sweep Setting Up Bullish Reversal Toward BSL?1. Overall Bias
The chart presents a Smart Money Concepts (SMC) / ICT-style technical analysis, outlining a full market cycle: consolidation → liquidity sweep → bearish expansion → reversal → retracement → renewed bullish setup targeting higher liquidity pools.
2. Element-by-Element Breakdown
A. Price Range (Aug 25–28)
Labeled "PRICE IN RANGE" — price consolidated in a tight horizontal box, indicating accumulation/distribution before a directional move.
A diagonal trendline inside this box sho
EURUSD Short: Breakdown Below Supply Signals Further DownsideHello traders! Here’s my technical outlook based on the current EURUSD (4H) chart structure. EURUSD previously traded inside a descending channel before breaking higher and shifting bullish. Price then moved toward the 1.1720 Pivot Point, where sellers rejected the upside and pushed price lower.
Currently, EURUSD is trading below the 1.1570 Supply Zone while holding above the 1.1480 Demand Zone and ascending Demand Line. The recent breakout failure below supply suggests sellers may continue to
EURUSD: Key Support Retest Could Open the Way Toward 1.1580Hello everyone, here is my breakdown of the current EURUSD setup.
Market Analysis
EURUSD previously traded inside a descending structure before breaking higher and shifting bullish. Price then formed a range before breaking above the Resistance Zone and moving toward the highs. After reaching the upper levels, price pulled back and returned toward the Support Zone.
Currently, EURUSD is trading below the 1.1580 Resistance Zone while holding above the 1.1520 Support Zone and ascending Trend Li
Gold Forecast: Bullish Recovery from Trend Line ContinuesHello traders! Here’s my technical outlook based on the current XAUUSD (3H) chart structure. XAUUSD previously traded inside a descending structure before breaking higher with a strong impulse and shifting bullish. Price then formed a range, tested the 4,440 Seller Zone, and pulled back before bouncing from the Buyer Zone and ascending Trend Line. Currently, XAUUSD is trading below the 4,440 Seller Zone while holding above the 4,300 Buyer Zone and the ascending Trend Line. The recent bounce from
Euro Tech Setup: Breakdown Below Trend Line Opens Path to 1.1500Hello traders! Here’s my technical outlook based on the current EURUSD (1H) chart structure. EURUSD previously rallied higher and formed a Rounding Top near the highs, where sellers rejected the upside and price turned around. Price then broke below the Trend Line and Seller Zone, shifting the short-term structure bearish. Currently, EURUSD is trading below the 1.1560 Seller Zone while holding above the 1.1500 Buyer Zone. The Rounding Top and recent breakdown suggest a possible continuation lowe
GOLD - A countertrend correction ahead of the news ICMARKETS:XAUUSD is bouncing from support ahead of the news and forming a countertrend correction amid the dollar’s stagnation following a five-day rally. The FOMC meeting and comments from the regulator are ahead...
Technically, most of the hawkish risks have already been priced in, but gold will remain vulnerable if the Fed signals that it intends to keep rates elevated for an extended period. Geopolitical risks and high energy prices are providing support. Gold is caught between expecta
Solana : Triangle Breakdown—Is This Really a Bearish Reversal?Solana : Triangle Breakdown—Is This Really a Bearish Reversal?
SOL has broken below a visible triangle structure on the H4 chart.
At first glance, this looks bearish.
But when we zoom out and look at the higher-timeframe structure and the logarithmic chart, the picture becomes more complicated.
The breakdown has happened, but several important support levels below price have not yet been decisively lost.
That matters.
A pattern can break while the larger market structure is still intact.
So