Long
Long
 Long
Long
Five catalysts that could move Ethereum nextETH keeps refusing to give up the $2,500 level. Every dip is being absorbed, but buyers are still running into a wall at $2,550–2,560. The market is compressing—and Friday’s Jackson Hole speech could provide the spark.
🚀 1. Institutional demand remains strong
U.S. spot Ethereum ETFs attracted approximately $988M across seven trading sessions from August 17 through August 25. Of that, $692.6M arrived during August 17–21, with BlackRock’s ETHA accounting for roughly $537M.
🐋 2. Corporate treasuries keep accumulating
BitMine and SharpLink continue building large ETH positions. This does not guarantee an immediate breakout, but it reduces available supply and reinforces the long-term institutional narrative.
🏦 3. Kevin Warsh takes the stage
The main catalyst is Kevin Warsh’s Jackson Hole speech on Friday at 14:00 UTC. Warsh typically avoids giving markets a clear policy roadmap, so the direction may be unpredictable—but volatility after the speech is highly likely.
⚖️ 4. Regulation is becoming less hostile
Improving U.S. regulatory clarity, particularly around staking and the classification of digital assets, could make Ethereum more accessible to institutional capital. This is a structural tailwind, not necessarily an instant price trigger.
⚙️ 5. Ethereum keeps strengthening its technology
The Glamsterdam upgrade is moving through testing, with changes aimed at improving network efficiency and gas pricing. The upgrade will not drive price alone, but it strengthens Ethereum’s long-term investment case.
📊 What the chart says
ETH remains above the SMA 50 near $2,473, while the rising structure continues to compress beneath $2,550–2,560.
▫️ A confirmed breakout above $2,560 with rising volume could open the way toward $2,600–2,640.
▫️ Losing $2,473 would weaken the structure and expose $2,427, followed by the SMA 200 near $2,390.
The buyers are still absorbing every dip. Now they need to prove they can break the ceiling.
Breakout before Jackson Hole—or one final shakeout first?
Disclaimer: This is not investment advice. MESU Aug 27: 7707 Pullback Before a 7741 Breakout?MESU pushed higher overnight and is currently trading around 7,715.
The first downside liquidity level I’m watching is around 7,707. Price may pull back into that area before attempting another move higher.
For the broader bullish structure, 7,690 is the key support level. A confirmed 4-hour close below 7,690 would weaken the bullish scenario and could open the door toward 7,655.
On the upside, the overnight high around 7,741 remains the main liquidity target. A confirmed 4-hour close above that level could support continuation toward approximately 7,765.
Key levels
7,707 — first downside liquidity
7,690 — key bullish support
7,655 — deeper downside target
7,741 — upside liquidity / breakout level
7,765 — next upside target
Bullish scenario: Hold the 7,707–7,690 area → reclaim 7,741 → target 7,765.
Bearish scenario: Lose 7,707 → watch 7,690. A confirmed higher-time-frame break below 7,690 could open 7,655.
For now, I’m waiting for price to reach one of these levels and give confirmation before taking a directional setup.
Not financial advice. No confirmation, no trade. CME_MINI:MESU2026  Long
Long
 Long
Long
 Short
Short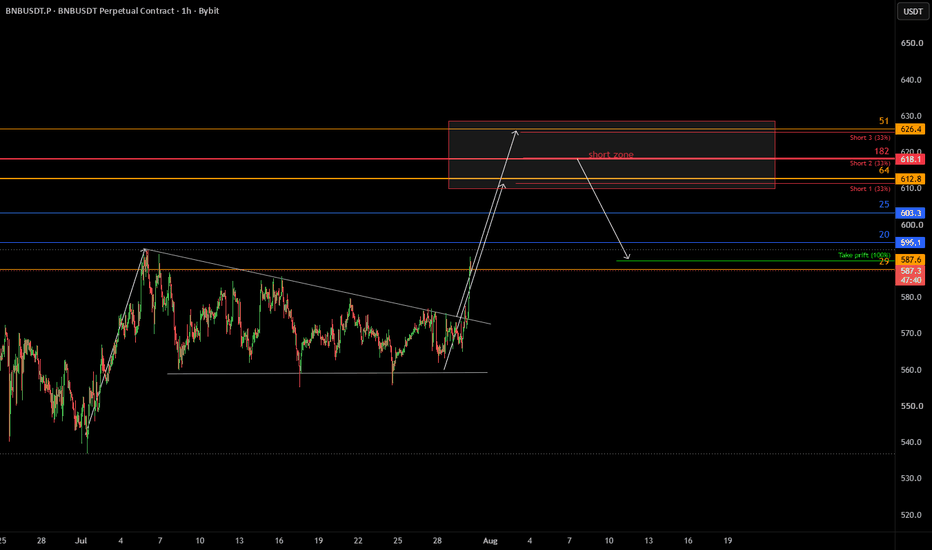
 Long
Long
 Long
Long
 Short
Short
MESU Aug 26: Range Between 7655 and 7714 Before NVDAMESU remains inside a choppy higher-time-frame range, with 7,655 and 7,714 acting as the primary boundaries.
For today, my base case is continued range-bound price action rather than an immediate directional breakout.
Inside the range, short-term liquidity sits around 7,670, which could be swept before price makes its next larger move.
On the upside, 7,714 is the key decision level. A confirmed breakout and acceptance above that level could open the path toward 7,733, followed by the larger upside liquidity around 7,764.
On the downside, 7,655 remains the key support. If price loses that level with confirmation, the deeper higher-time-frame level around 7,625 comes back into play.
Key levels
7,670 — intraday liquidity
7,714 — upside decision / breakout level
7,733 — first breakout target
7,764 — larger upside target
7,655 — range support
7,625 — deeper downside target
Bullish scenario: Hold the lower range and reclaim 7,714 → target 7,733, then potentially 7,764.
Bearish scenario: Lose 7,655 with confirmation → watch for continuation toward 7,625.
Until price confirms outside the 7,655–7,714 range, I’m staying patient and avoiding entries in the middle.
Not financial advice. No confirmation, no trade. CME_MINI:MESU2026  Short
Short
MSFT 1H: Wedge completed at 483.84, third level untouchedMSFT, 1-hour. Everything on the chart is drawn by our Classical Auto Chart Patterns study. Nothing here was drawn by hand.
Falling wedge, boundaries built from confirmed swing pivots. Completing close 21 Aug 10:30 at 483.84, above the upper boundary. The script's label reads Closed Above.
R is the formation height, capped at one daily ATR: 9.44. Levels at 0.25R, 0.5R and 1.0R sit at 486.20, 488.56 and 493.28. Structural invalidation is the opposite boundary, 473.97, 1.04R away.
486.20 was reached 24 Aug 09:30, 488.56 an hour later. 493.28 carries no mark. Last 1-hour close 491.50, between the second level and the third.
An unmarked level is not a failure. It means no confirmed bar has traded there yet.
473.97 carries no mark either, so nothing has traded back through the lower boundary in the three sessions since the completing close.
What changes the read: a confirmed close below 473.97. The study then clears the level set.
Descriptive study, not a signal tool. Nothing here is advice.
Charted with Classical Auto Chart Patterns , our own open-source study.
 Long
Long
 Long
Long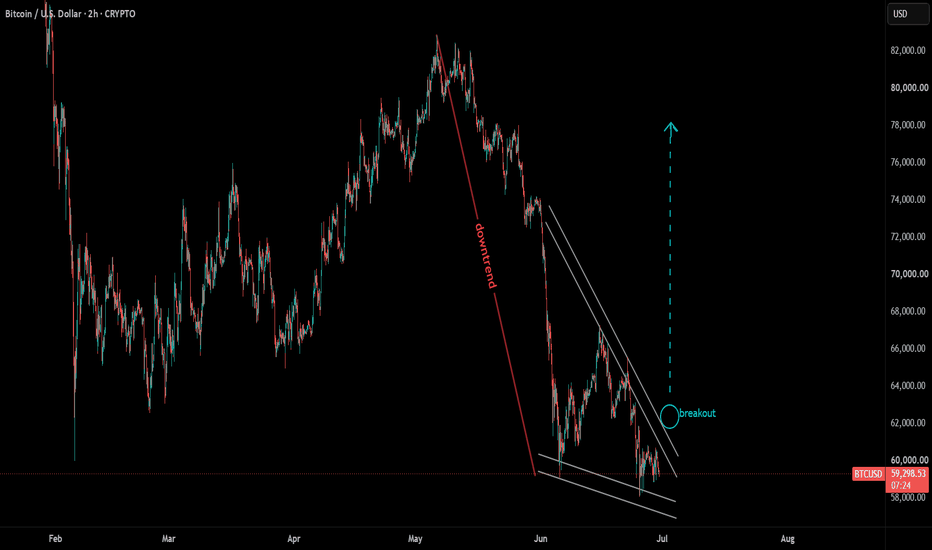
Canadian Gold Miners UndervaluedThe Invesco S&P/TSX Global Gold Index ETF (CGMU) offers investors diversified exposure to many of Canada's leading gold mining companies, providing a way to benefit from rising gold prices without relying on the success of a single miner. As one of the world's largest gold-producing regions, Canada is home to high-quality operators with long-life assets, strong balance sheets, and increasing free cash flow.
Despite gold trading near record highs, Canadian gold miners remain relatively undervalued. Years of investor preference for technology and AI stocks have left the sector overlooked, even as mining companies generate record earnings and strengthen their financial positions. Many producers continue to trade at attractive valuation multiples compared to the broader market and previous gold bull cycles. With central banks continuing to accumulate gold, persistent geopolitical uncertainty, and expectations for lower interest rates supporting bullion prices, the outlook for gold remains constructive. If investor sentiment shifts back toward defensive assets, Canadian gold miners could benefit from both rising earnings and expanding valuation multiples, making CGMU an attractive way to gain broad exposure to the sector.
The technical setup here is becoming increasingly interesting and appears to be forming the foundation for a potentially significant reversal. Price has been compressing within a falling wedge pattern for several months, a formation that is often associated with bullish reversals once a breakout occurs. That breakout has now taken place, and the recent pullback is finding support at the broader range's Value Area Low, adding an important layer of technical confluence. This area also aligns closely with key Fibonacci retracement levels, further strengthening the case that buyers may begin stepping in.
While no setup is guaranteed, the current risk-to-reward profile looks quite attractive if these support levels continue to hold. A sustained move higher could trigger renewed momentum as confidence returns to the sector, particularly if gold prices remain strong. Although it's an ambitious target, I believe there is a realistic path for the ETF to advance toward the **$15** level over the medium term, representing a substantial recovery from current prices if the broader bullish thesis plays out.
 Long
Long
Bitcoin Is Compressing. Mapping The Next Structural Expansion.Strong rallies rarely end because price gets tired; they pause so liquidity can build for the next leg.
High-Timeframe Context (4H)
Looking at the broader picture, Bitcoin’s recent expansion was supported by clean momentum.
When measuring impulse legs, the macro projection points toward the $91,000 region. However, macro targets are roadmap destinations—not immediate entries.
We need lower-timeframe structure to manage our risk.
Low-Timeframe Structure (1H)
On the 1-hour chart, INDEX:BTCUSD Bitcoin is consolidating inside a corrective falling wedge pattern right above the $76,000 support zone.
This compression is healthy after a sharp vertical move.
We map out two potential execution pathways:
Breakout Execution: A clean 1H candle close above the upper wedge boundary.
Retest Execution:
Bullish price action or rejection signals inside the $76,000 pullback area.
Key Targets & Resistance Walls
Immediate Resistance: $82,800 — A significant order cluster sits at this level. Expect temporary absorption or a pause here.
Pattern Target:
$85,400 — Calculated directly from the 1H wedge geometry.
This is our primary profit-taking zone where risk should be significantly scaled down.
Macro Measured Move: $91,000 — Based on leg projection theory if momentum sustains past $85.4k.
Invalidation Level: $74,000
Risk & Execution Perspective
As long as price stays above $74,000, the structural bias remains constructive. A breakdown below $74,000 invalidates the wedge setup and signals a deeper corrective phase, leaving no reason to remain long.
Define your risk, take profits at key structural hurdles, and let the market confirm the breakout before expanding position size.
Patience comes before execution.
Risk Warning:
Trading cryptocurrencies involves significant financial risk. This analysis represents a personal market view and structural perspective, not financial advice. Always define your risk before entering any trade and never risk capital you cannot afford to lose. Long 
 Long
Long
DOGE Is Setting a Trap—Will You Be Ready Before It Explodes?Yello Paradisers! Are you prepared for a potential sharp move on #DOGE, or are you still underestimating what’s quietly building behind the scenes? At first glance, this structure might seem like a simple and healthy pullback. But when we strip away emotions and analyse the chart objectively, a completely different narrative emerges. This is not random price action this is a high-risk, high-opportunity zone where discipline matters far more than opinions.
💎#DOGE has broken above the descending resistance trend line of a falling-wedge pattern and successfully retested it. At the same time, a clear bullish RSI divergence has formed, adding further strength to the bullish probability.
💎As long as price continues to hold momentum with in the OB + FVG zone, the structure remains constructive. The first important resistance level to watch is 7920. A clean reaction around this level will be important probability, because it can show whether buyers are strong enough to continue controlling the move.
💎#DOGE has recently printed a classic selling climax, followed by a climactic action candle supported by ultra-high volume. This is a textbook indication of accumulation. Historically, this exact behaviour appears when smart money begins positioning ahead of a larger move. While subtle to the untrained eye, this probability carries significant weight for experienced traders.
💎#DOGE has also swept the liquidity below the selling climax and then broken above the upper trigger line with a strong momentum candle. This suggests that weak hands were pushed out before stronger buyers stepped in with conviction. If the prices sustain this momentum, the next upside path can open toward 8530, which is currently acting as a major structural resistance level.
💎If #DOGE fails to hold bullish momentum and a momentum candle closes below 6700, the current bullish probability becomes invalid. In that case, we could see further downside pressure.
That is why Paradisers, we are playing it safe right now. If you want to be consistently profitable, you need to be extremely patient and always wait only for the best, highest probability trading opportunities only on confirmations.
MyCryptoParadise
iFeel the success🌴
 Long
Long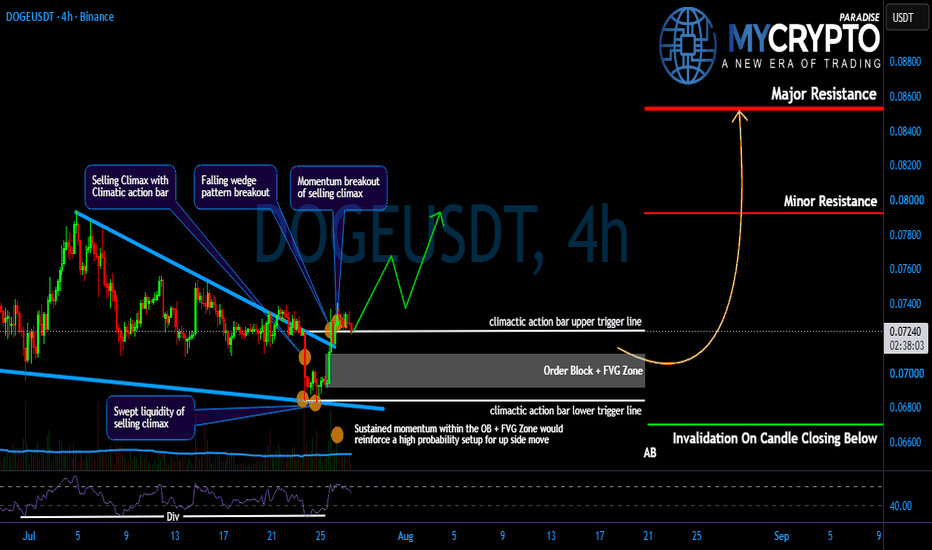
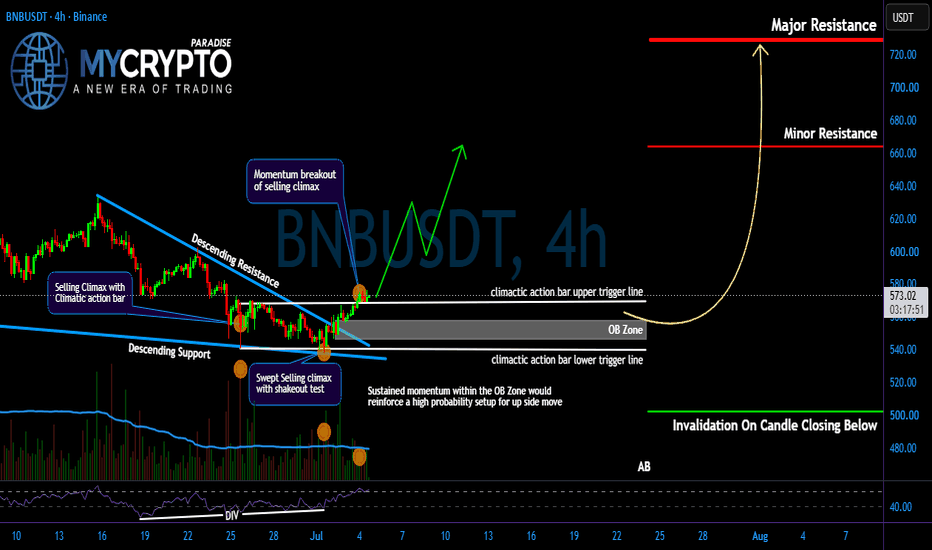
BNB Trap Before the Big Move?Yello Paradisers! Are you prepared for a potential sharp move on #BNB, or are you still underestimating what’s quietly building behind the scenes? At first glance, this structure might seem like a simple and healthy pullback. But when we strip away emotions and analyse the chart objectively, a completely different narrative emerges. This is not random price action this is a high-risk, high-opportunity zone where discipline matters far more than opinions.
💎#BNB has broken out of the falling wedge pattern, while the overall market structure has gradually started shifting to the upside. On top of that, we can see a clear RSI divergence, which adds more strength to the bullish probability. As long as the price continues to hold momentum inside the order block zone, the structure remains constructive, with 664 acting as the first important resistance level to watch.
💎#BNB has recently printed a classic selling climax, followed by a climactic action candle supported by ultra-high volume. This is a textbook indication of accumulation. Historically, this exact behaviour appears when smart money begins positioning ahead of a larger move. While subtle to the untrained eye, this probability carries significant weight for experienced traders.
💎#BNB has also swept the liquidity below the selling climax with shakeout test and then broken above the upper trigger line with a strong momentum candle. This suggests that weak hands were pushed out before stronger buyers stepped in with conviction. If the prices sustain this momentum, the next upside path can open toward 729, which is currently acting as a major structural resistance level.
💎If #BNB fails to hold bullish momentum and a momentum candle closes below 502, the current bullish probability becomes invalid. In that case, we could see further downside pressure.
That is why Paradisers, we are playing it safe right now. If you want to be consistently profitable, you need to be extremely patient and always wait only for the best, highest probability trading opportunities only on confirmations.
MyCryptoParadise
iFeel the success🌴
Long