XRP – Waiting for the Next ImpulseXRP has been bullish, trading within the rising blue wedge and consistently respecting its upward structure. 📈
After the latest rally, price entered a correction phase and is now approaching an important confluence zone.
Currently, XRP is retesting the lower bound of the blue wedge, which intersects with a strong demand zone marked in green.
This combination of dynamic support and horizontal demand creates an area where buyers may step back into the market.
As long as this intersection holds, we will be looking for longs. 🐂
However, while the broader structure remains bullish, the correction is not fully over yet.
For the bulls to confirm control and start the next impulse movement, a break above the red channel is needed.
Such a breakout would signal that the correction has ended and that momentum is shifting back in favor of the buyers.
Will XRP use this demand zone as a launchpad for the next bullish leg? 🚀
⚠️ Disclaimer: This is not financial advice. Always do your own research and manage risk properly.
📚 Stick to your trading plan regarding entries, risk, and management.
Good luck! 🍀
All Strategies Are Good; If Managed Properly!
~Richard Nasr
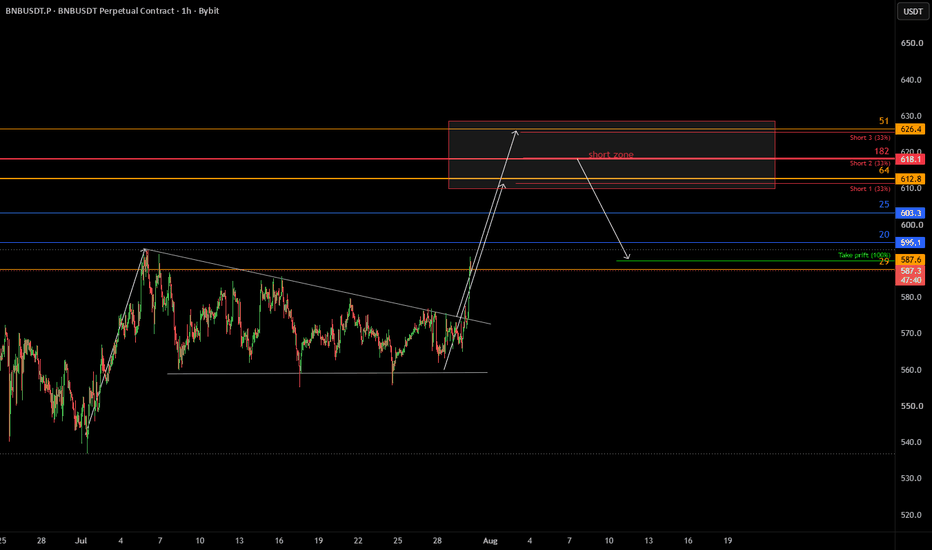
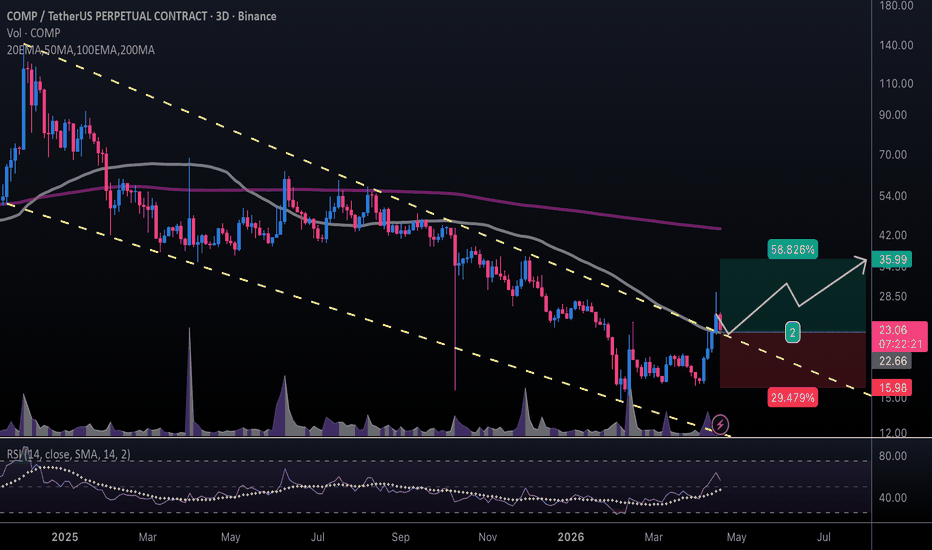
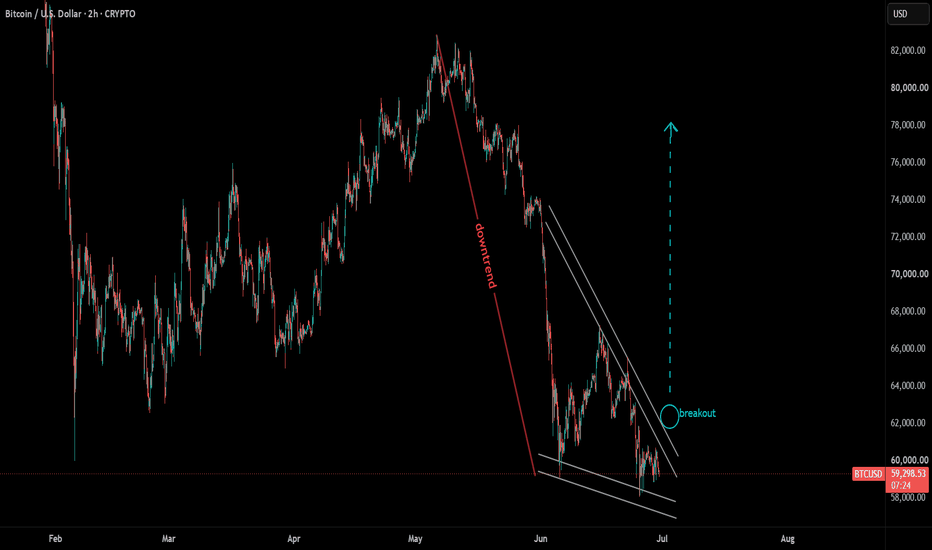
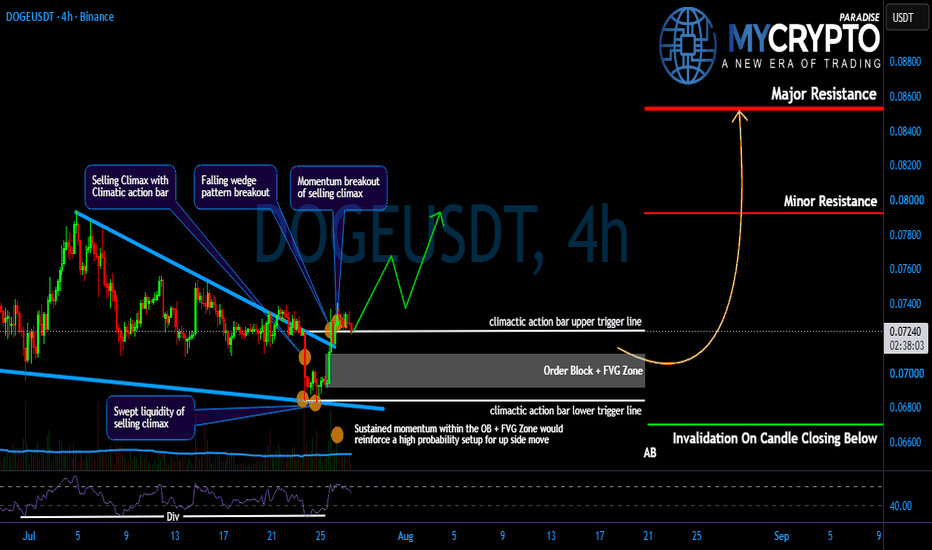
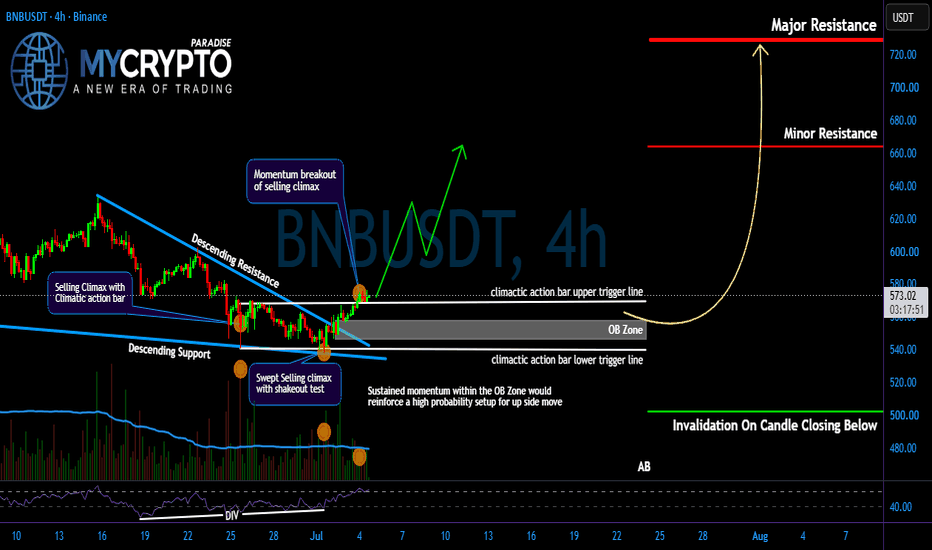
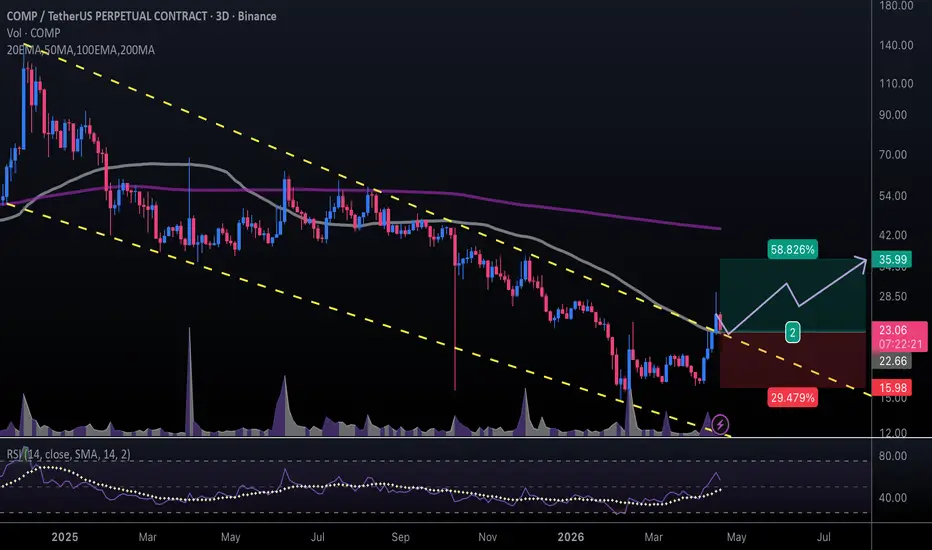
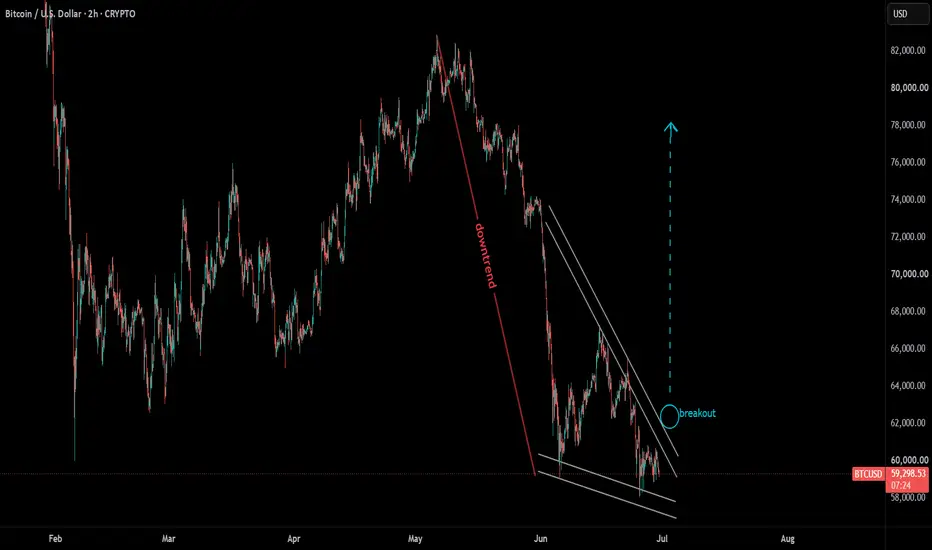
Wedge
XAUUSD Long: Will 4,300 Support Hold for a Rally to Supply 2?Hello traders! Here’s my technical outlook based on the current XAUUSD (1h) chart structure. XAUUSD previously traded below a descending resistance line before breaking below a consolidation range and extending its bearish move. After breaking down from a consolidation range, price hit a local bottom and reversed into a steady ascending channel. Currently, the market is undergoing a brief pullback where buyers are looking to step back in.
XAUUSD is now trading between the 4,300 Demand Zone and the 4,370 Supply Zone. The recent breakout and retest of the channel's lower support line indicate that the bearish momentum has faded, setting up a potential bounce.
As long as price holds above the 4,300 Demand Zone, the bullish scenario remains valid. A successful bounce from current levels could push XAUUSD back toward 4,370 and eventually the 4,410 target (Supply 2). Manage your risk!
GBPUSD: Bearish After the News 🇬🇧🇺🇸
GBPUSD looks bearish after the release of UK Unemployment Data
this morning.
I see a confirmed bearish break of structure on a daily.
The next strong support is 1.32.
I think that the pair will reach that soon.
❤️Please, support my work with like, thank you!❤️
I am part of Trade Nation's Influencer program and receive a monthly fee for using their TradingView charts in my analysis.
CG Power: Volatility Funnel Confirmed – The Path to 1100+The Setup:
CG Power has spent the better part of the last 18 months carving out a massive Hunt Volatility Funnel. We’ve tracked the tightening price action through a series of lower highs and higher lows, specifically watching the compression between the multi-month trendline and the structural support at ₹515.
The Trigger:
Price has finally cleared the "High 3 & Pattern Trigger" zone around ₹760–₹780. This move signals that the supply from the 2024/2025 highs has been absorbed. The recent retest and bounce off the former trendline resistance (now support) confirms that the bulls have regained control.
Key Technical Observations:
Failed Pattern Rejection: The "Low 3 & Pattern Fail" zone was aggressively defended, showing high buyer conviction at higher price levels.
Expansion Phase: We are now exiting the "Funnel" and entering a price expansion phase.
Targets:
With the pattern confirmed, I am looking for a measured move through the following technical milestones:
Target 1 (Immediate): ₹802 (Tested)
Target 2: ₹970
Target 3 (Structural): ₹1,052
LOG Target 3 (Extended): ₹1,176
Invalidation:
A daily close back below the ₹680 level (Low 3) would invalidate this immediate bullish thesis and suggest the funnel is broadening into a wider range.
Bottom Line: The accumulation phase is over. We are now playing for the compounding leg of this cycle.
$ETH Falling Wedge - Bull CaseIf this macro Falling Wedge plays out, we would see a sweep of the April 2025 tariff lows by late Q3 / early Q4 this year.
On a upward breakout, we could see price recover as high as the prior ATH in the next year.
NOTE: Falling Wedge patterns aren't esp. high success rate. Roughly 68% of falling wedges break upward, and when they do, they deliver an average +38% gain.
CADCHF: Oversold Market & Pullback 🇨🇦🇨🇭
CADCHF will likely continue recovering after a confirmed
breakout of a resistance line of a falling channel on an hourly time frame.
I expect a bullish continuation to 0.5663
❤️Please, support my work with like, thank you!❤️
I am part of Trade Nation's Influencer program and receive a monthly fee for using their TradingView charts in my analysis.
LTCUSD: The Death of a Legacy Narrative. Multi-Year Inverted HVF📉 🪙 🥶 📉
📉 🪙 🥶 📉
📉 🪙 🥶 📉
1. The Macro Structure:
An Inverted Volatility Trap.
When an asset fails to make higher macro highs over multiple market cycles, it’s not consolidation—it’s long-term distribution.
The Geometry: Looking at the weekly chart, the price action has carved out a massive Inverted Hunt Volatility Funnel bounded by declining peaks (Low 1, Low 2, L3) and a vulnerable ascending support trendline (High 1, High 2, H3).
The Resolution: The final compression at L3/H3 has resolved decisively to the downside.
The structural trendline that held up this asset for years has snapped!
And the support block has completely flipped into a ceiling of aggressive overhead supply.
2. The Fundamental Reality: Extractive Cycles & Dead Utility
The "silver to gold" pitch worked in 2017 when transaction throughput was a novel bottleneck. In today's agentic economy, legacy proof-of-work alts with zero smart contract utility or ecosystem velocity face a structural liquidity vacuum.
As capital concentrates strictly in institutional infrastructure and high-throughput utility networks, old-school tokens are treated as pure liquidity exits for insiders and early miners.
The market doesn't value nostalgia; it values execution.
When the broader market hums and an asset prints structural multi-year breakdowns, the trend is telling you everything you need to know.
3. Downside Extension Coordinates & Log Targets
The price has cleanly broken through local support at 71.79 and has already sliced below Log Target 1 at 54.84.
The path of least resistance is an aggressive vacuum down into lower macro historical blocks:Current Position: $45.10
Log Target 2: 31.71
Log Target 3 (The Cycle Capitulation Block): $5.56
While the crowd stays emotionally married to old forum threads and dead catchphrases, we map out the structural distribution and compound capital on the cascade.
Let them catch the falling knife.
1. The Death of the Utility Myth (The Unpolite Truth)
Let’s stop being polite about what a move to $5 actually represents.
Litecoin is the original altcoin—the silver standard.
If the pioneer of alternative networks completely round-trips back to single digits after nearly fifteen years of existence, it confirms the quiet reality that the market is finally waking up to: The entire altcoin ecosystem has largely functioned as a multi-year, extractive mechanism for insider enrichment.
For a decade, these networks sold retail on the dream of decentralised utility, peer-to-peer micro-transactions, and digital silver.
But the data doesn't lie.
They didn't build lasting micro-economies; the founders, VCs, and early insiders simply used retail as exit liquidity to print billions of dollars for themselves while delivering zero structural value.
A $5 print is the ultimate market verdict, rendering a decade of tech white-papers as nothing more than sophisticated marketing decks for top-tier bullshit artists.
2. The Bitcoin Shadow: A Deep Macro Bear Market
A cascade of this magnitude also sends a glaring, undeniable signal across the entire global crypto landscape: Bitcoin itself would be anchored deep, deep in a structural macro bear market.
Bitcoin may be the "Gold" of the ecosystem, but it does not trade in a vacuum.
For an OG asset like Litecoin to completely drain its liquidity pool down to single digits, the tide across the entire space has to be completely out.
It implies a widespread systemic drain—where regulatory tightening, macroeconomic liquidity constraints, and total retail exhaustion force capital to brutally repatriate out of risk assets entirely.
When the structural floor of the original Altcoin cracks like this, it isn’t a isolated local event; it's a structural warning sign that the entire asset class is undergoing a generational, painful purging.
#Litecoin #LTCUSD #CryptoAnalysis #ShortSetup #PriceAction #MacroDistribution #BearMarket #TradingView #TechnicalAnalysis
Litecoin has maintained it's HVF and can STILL do a 10X...in the coming years.
This is a massive pattern formed over 7 years and I expect over performance of target 3 ultimately.
The day to week price action really does not matter when you have beautiful setups like this.
Keep stacking at these low prices.
@TheCryptoSniper
MESU June 16: Watch 7606 pullback, then 7650 and 7695MESU analysis for Tuesday, June 16
We’ve now rolled from the M contract into the U contract, so today’s focus is on MESU.
MESU has been consolidating overnight around 7630, and I still lean bullish for today as long as the key support structure holds.
On the 4H chart, the main support level for me is 7582. If bulls want to stay in control, then I do not want to see price lose that level. Just above it, I can also see a fair value gap around 7600, which may act as support on a pullback.
The first upside target I’m watching is the yesterday high at 7650. If bulls can push through that level, then the next target for me is the all-time high around 7695.
On the 1H chart, 7606 stands out as the key near-term pullback level. If price retraces first, I want to see how it reacts there.
On the 15M chart, the fair value gap and order block align in the green zone, so that is the main setup area I’m watching for confirmation.
Key levels
7606 = near-term pullback level
7582 = must-hold support
7650 = first upside target
7695 = all-time high / second target
Green zone = FVG + order block reaction area
Plan for today
Stay constructive while price holds support
Watch for pullback into 7606 / green zone
If buyers confirm there, watch 7650 first
If bulls stay strong, watch 7695 next
Reassess if price loses 7582
Not financial advice. No confirmation, no trade.
If you want, I can also make these more shorter and punchier for faster posting, or keep them in this style by default. CME_MINI:MESU2026
MarketBreakdown | USDJPY, USDCAD, EURCAD, GBPJPY
Here are the updates & outlook for multiple instruments in my watch list.
1️⃣ #USDJPY daily time frame 🇺🇸🇯🇵
The pair is approaching a major horizontal daily resistance cluster.
Its breakout and a daily candle close above that will provide a strong bullish signal.
2️⃣ #USDCAD daily time frame 🇺🇸🇨🇦
The pair is steadily growing within a rising wedge pattern.
I will expect a trend-following bullish price action within its boundaries.
3️⃣ #EURCAD daily time frame 🇪🇺🇨🇦
The market is currently testing a significant horizontal resistance area.
I will be waiting for its breakout and a daily candle close above to buy,
expecting another wave up.
4️⃣ #GBPJPY daily time frame 🇬🇧🇯🇵
I see a consolidation and a contraction of the price action within a symmetrical
triangle pattern.
A bullish breakout of its resistance line and a daily candle close above that
will provide a strong buy signal.
Do you agree with my market breakdown?
❤️Please, support my work with like, thank you!❤️
I am part of Trade Nation's Influencer program and receive a monthly fee for using their TradingView charts in my analysis.
Selena | XAUUSD 4H – Bullish Reversal Emerging From Channel SuppPEPPERSTONE:XAUUSD FOREXCOM:XAUUSD
Structure | Trend | Key Reaction Zones
Gold has reached the lower boundary of a descending channel and reacted strongly from a major higher-timeframe demand zone near 4000–4100. The recent bounce suggests buyers are stepping in after an extended bearish move.
Market Overview
After weeks of bearish pressure, price swept liquidity below support and tapped the lower channel boundary before showing a strong rejection. The highlighted supply zone around 4300–4400 is the first key obstacle, but the projected path indicates potential bullish continuation toward the upper channel resistance. As long as price remains above the recent swing low, the recovery structure remains intact.
Bullish Case 🚀
🎯 Target 1: 4380
🎯 Target 2: 4550
🎯 Target 3: 4750
Current Levels to Watch
Support 🟢: 4000–4100
Resistance 🔴: 4380 → 4550 → 4750
⚠️ Disclaimer: This analysis is for educational purposes only. It is not financial advice. Always manage risk appropriately and perform your own analysis before trading.
Motive Wave Exhaustion inside a Rising WedgeThe British Pound against the Canadian Dollar is presenting a highly defined macro-technical trend terminal pattern on the 4-hour framework.
Looking at the geometry in the pair has pushed higher into a Rising Wedge chart pattern. This structural compression is moving perfectly in line with a complete 5-wave Elliott Motive Wave sequence. Price has just printed an impulsive Wave (5) right into the upper resistance boundary of the wedge pattern, highlighting significant volume and momentum divergence.
The Goal: With the motive cycle fully completed at structural resistance, I am standing aside and waiting for a clean distribution to confirm a trend reversal. My objective is to track a decisive, impulsive break below the wedge’s lower ascending support line. A confirmed breakdown will open the path for a massive macro rotation back down toward the primary historical liquidity floor anchored at the 1.83032 horizontal support level.
Fundamental Catalyst: This bearish technical view is heavily reinforced by a strong fundamental shift backing the Canadian Dollar (CAD). Last week's blockbuster Canadian Labour Force Survey revealed an unexpected surge of 88,000 jobs for May, handily beating consensus expectations of just 10,000 positions and forcing the unemployment rate down to 6.6%. This labor market strength is beautifully synchronized with the kickoff of the 2026 FIFA World Cup.
#GBPCAD #Forex #ElliottWave #RisingWedge #TrendReversal #TradingView #TechnicalAnalysis #MacroTrading
This is for educational and research purposes only and does not constitute investment advice.
CRUDE OIL (WTI): Pullback From Key Level
I think that WTI Crude Oil is positioned to pull back
from a key horizontal support level.
As a confirmation, I see a breakout of a resistance line
of a symmetrical triangle pattern on an hourly time frame.
Goal - 82.00
❤️Please, support my work with like, thank you!❤️
I am part of Trade Nation's Influencer program and receive a monthly fee for using their TradingView charts in my analysis.
RSKD: When fraudsters work overtime and Riskified profits from iWhile most investors debate artificial intelligence, Riskified( NYSE:RSKD ) is already using it where mistakes cost real money. The company helps the world's largest online retailers distinguish genuine buyers from fraudsters, analyzing billions of dollars in transactions in real time. The bigger e-commerce gets, the more expensive every mistake becomes.
Fundamentals
The latest quarter showed the business continues to gain momentum. Revenue grew 7 percent year over year to 88.3 million dollars, while gross merchandise volume (GMV) reached 37.2 billion dollars, up 9 percent. Billings growth outpaced revenue growth, typically indicating sustained positive momentum in coming quarters.
Profitability looks particularly compelling. Non-GAAP gross profit rose to 46.3 million dollars with a margin of 52.5 percent. Adjusted EBITDA surged 370 percent to 6.2 million dollars, while earnings per share came in at 0.05 dollars, beating market expectations. The balance sheet holds 276.3 million dollars in cash and investments with virtually no debt. Free cash flow for the quarter was 9 million dollars.
Management is so confident in the business outlook that it continues aggressive share buybacks. In the first quarter alone, 6.2 million shares were repurchased for 27.5 million dollars at an average price of 4.44 dollars. In June, the board additionally approved 75 million dollars for the buyback program. When a company actively buys its own shares, it usually signals that leadership considers the current valuation attractive.
Riskified continues to expand its product ecosystem. In the first quarter, it launched ARIA, an AI-powered risk intelligence analyst that enables clients to get plain-language explanations of suspicious transactions without diving into complex analytics. The company also strengthened its integration with Shopify through Dispute Resolve and expanded collaboration with travel giant Amadeus via the Outpayce platform.
The quality of the customer base deserves special attention. The number of merchants using more than one Riskified product grew 50 percent year over year, and their contribution now exceeds 30 percent of total revenue. This is an important metric, as expanding existing customers is typically significantly cheaper than acquiring new ones.
Technicals
On the weekly chart, price broke out of a descending wedge that had been containing quotes and successfully completed a retest of the breakout zone. The stock is now holding above key moving averages, confirming a shift in the medium-term market structure. Yesterday's close, June 15, was 4.95 dollars. Rising volume after the breakout shows institutional participation, while trend indicators remain bullish. As long as price stays above the retest zone, the primary scenario remains continuation toward the 7.50 dollar area, which is the next major target for buyers.
The market still values Riskified as a small fintech company, but the numbers are starting to tell a different story. The company is already generating profit, building cash flow, actively buying back shares, and expanding its presence in the fast-growing AI payments protection segment. Sometimes the most interesting stories begin not when everyone is talking about them, but when most haven't yet noticed that the business has already started operating more efficiently.
And if fraudsters aren't planning to leave the internet, Riskified's workload will only grow.
Tron to accelerate into the next bull market 3 x cup and handle Bullish on TRX Tron because it has performed relatively well during the bear market against its piers
Its price is sitting over a trend line which if you extrapolate and assume the bullish cycle lasts about the same 3 years. It takes us to the Cup and handle target.
The cup-and-handle pattern shown is based on several assumptions, using a line of best fit across the key support and resistance levels. The spike lows have been treated as valid data points, while the spike highs have been discounted due to the lower volume traded at those levels compared to the lows.
This analysis produces a target around the whole number "1" together with a possible wedge continuation pattern enroute
In a bull market, I would expect TRX to outperform and potentially deliver more than a 3x return. However, a 3x gain is still a respectable outcome for a top-10 cryptocurrency that has remained relatively strong throughout the bear market. Could it go much higher? Absolutely. But it's important to remain realistic and manage risk appropriately.
Personally, I'd be happy to bank a 3x return rather than endure excessive drawdowns chasing larger gains. As long as price remains above the dotted trend line, this appears to be a reasonable strategy for potentially tripling your investment. This isn't financial advice—just a practical approach based on risk versus reward.
The timeframe for this setup is approximately three years. If TRX experiences a strong move earlier than expected, there may be an opportunity to take profits and rotate that capital into another token that tends to perform later in the bull cycle. In that scenario, you could potentially achieve a 3x return on TRX and then another 2x–3x elsewhere.
That would result in an overall return of 6x–9x during the cycle, while starting from a relatively conservative position. Of course, "safe" is a relative term in cryptocurrency, which remains a high-risk asset class, but the goal is to maximize returns while minimizing unnecessary risk.
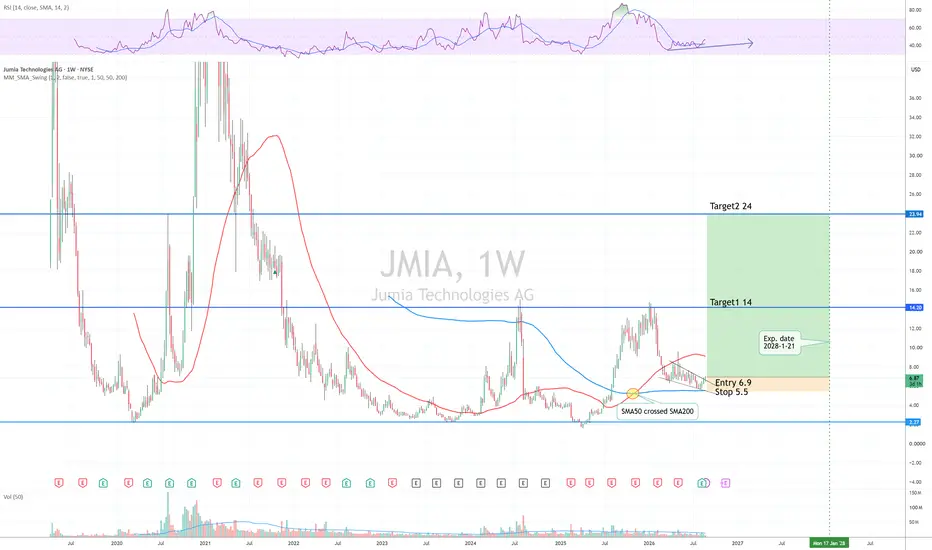
WU Long Weekly Falling Wedge , RSI divergence
Entry 7.6
Stop 6
Target 14
Risk management is much more important than a good entry point.
I am not a PRO trader. About 25% of my trades had been stopped quickly.
Bff (Buy for free)
BuyToOpen Jan 2028 C7 limit 1.25 ( delta= 0.76, IMT )
SellToOpen P5 limit 0.60 x2 ( delta= -0.15)
If WU will drop and stay below 5, this strategy is same as limit buy at 5 x200
If assigned, short term trading becomes long term investment.
Buy and hold, at least, collect 10% dividends.
#TSLA TESLA - Good Break , Offering Good Risk to Reward
We have a classic bullish setup on TSLA with a textbook falling wedge breakout on the 45-minute chart. The price has been compressing between converging downward trendlines, which shows selling momentum was drying up. We just got a clean daily close above the upper resistance line, confirming the breakout. As a trader, this looks like a solid risk-to-reward play: the plan here is to set a stop loss just under the recent swing low at 386.91 to manage risk, and ride the upward momentum toward the target level near 445.59.
C3.ai — Falling Wedge Breakout SetupC3.ai is showing a long-term falling wedge structure on the weekly chart.
Since the major post-IPO decline, price has continued to compress inside a broad descending wedge, with lower highs and lower lows tightening into the current range. After repeated downside pressure, price is now attempting to reclaim from the lower portion of the structure and push back toward the upper wedge resistance.
The main area I’m watching is the descending resistance line. A clean weekly breakout above that level could shift the chart from bearish compression into a potential reversal setup.
What stands out:
Long-term falling wedge compression
Multiple reactions near the lower boundary
Price attempting to reclaim from the lower wedge zone
Weekly structure improving after a major basing move
Potential upside toward prior resistance if momentum confirms
Best entries are usually on pullbacks or retests, not after vertical candles
The setup still needs confirmation. Falling wedges can be powerful when they resolve, but failed breakouts are common. I want to see price hold the reclaim, avoid rejection at wedge resistance, and build strength above the descending trendline.
Key areas I’m watching:
Breakout confirmation: weekly close above falling wedge resistance
Invalidation: loss of the recent reclaim and lower support structure
Upside targets: prior resistance zones if momentum expands
This is not about chasing a headline or a theme. It is about watching a beaten-down chart with long-term compression, improving weekly structure, and a possible risk/reward shift if buyers continue stepping in.
Educational only. Not financial advice.
OTHERS/BTC: 4-Year Breakout?OTHERS/BTC has been trending lower since the 2022 peak, forming what appears to be a multi-year falling wedge.
Falling wedges are often considered bullish reversal patterns because downside momentum weakens while price continues to compress.
After nearly 4 years of lower highs, OTHERS/BTC is now testing the upper boundary of the wedge and showing signs of a potential breakout.
At the same time:
BTC Dominance appears to be stalling near major resistance
Momentum is turning positive from historically depressed levels
Several altcoins are beginning to outperform Bitcoin on higher timeframes
A confirmed breakout could signal the start of a period where altcoins outperform Bitcoin after years of underperformance.
Is this the beginning of a new altcoin cycle, or just another fakeout?
Chart: OTHERS/BTC (2W)
IMPORTANT: Not financial advice. This is my personal market observation and interpretation of the chart.
A Skeptical Trader's Guide to Trading Repeated Failed BreakoutsTechnical patterns often look straightforward in textbooks. A recognizable formation develops, price eventually breaks through a key level, and traders begin evaluating potential opportunities. In reality, however, markets are rarely that cooperative.
One of the more challenging situations traders face occurs when a pattern appears valid, yet repeatedly fails to deliver the anticipated breakout. Each failed attempt chips away at confidence. The pattern may still be technically intact, but the market's inability to follow through can create growing skepticism among participants.
This distinction is important because technical analysis is not only about identifying patterns. It is also about understanding how market participants are reacting to those patterns.
The daily chart of 10-Year T-Note Futures provides an interesting case study of this concept. A Falling Wedge pattern developed over several months and eventually produced an upside breakout. Yet before that breakout finally gained traction, multiple attempts had already failed.
For some traders, those repeated failures may have been enough to justify a more conservative approach.
Rather than focusing on predicting what would happen next, this article examines how a trader might manage uncertainty when a technical pattern begins to lose credibility after several unsuccessful breakout attempts.
Understanding the Falling Wedge
The Falling Wedge is a chart pattern characterized by two downward-sloping trendlines that gradually converge over time. As the pattern develops, price fluctuations become progressively narrower, suggesting a reduction in downside momentum.
From a technical perspective, the pattern is often interpreted as a potential reversal or continuation formation depending on the broader market context. The key observation is that sellers continue pushing prices lower, but each subsequent push tends to lose strength.
Eventually, price reaches a point where a breakout above the upper trendline becomes possible.
Many technical traders monitor these formations because they provide clearly defined boundaries. The pattern itself offers structure, while the breakout provides a framework for developing a trading hypothesis.
However, one important reality is frequently overlooked.
Patterns do not exist in a vacuum.
The quality of a breakout often depends on what happened before the breakout occurred.
A breakout that succeeds on the first attempt may be viewed differently than a breakout that follows multiple failed attempts.
This distinction becomes particularly relevant in the case study shown on the chart.
When a Pattern Starts Losing Credibility
One of the most valuable lessons technical analysis can teach is that markets are ultimately driven by participant behavior.
A chart pattern can remain technically valid for weeks or months. Nevertheless, if traders repeatedly observe failed breakout attempts, confidence in the pattern may gradually deteriorate.
This phenomenon can be described as pattern fatigue.
Pattern fatigue occurs when a market repeatedly attempts to move in a particular direction but fails to sustain momentum. Over time, participants become increasingly skeptical about the probability of success.
The Falling Wedge shown on the chart illustrates this concept particularly well.
Throughout May, multiple attempts were made to break above the upper trendline of the pattern. Each attempt appeared promising initially, only to reverse and fall back into the structure.
From a purely technical perspective, the pattern remained valid.
From a psychological perspective, however, confidence was likely declining.
A trader observing these repeated failures might reasonably begin asking several questions:
Is the pattern still relevant?
Are buyers truly in control?
Is this breakout attempt any different from the previous ones?
Should additional confirmation be required before acting?
These questions reflect a healthy degree of skepticism.
In many cases, skepticism is not a weakness. It can be a risk-management tool.
The objective is not to become permanently bearish or bullish. The objective is simply to require stronger evidence before committing capital.
This is where trading styles often begin to diverge.
Aggressive Traders Versus Conservative Traders
Not all traders approach chart patterns the same way.
An aggressive breakout trader may choose to enter as soon as price moves beyond the trendline. The logic is straightforward: if the breakout succeeds, entering early may provide favorable positioning.
There is nothing inherently wrong with this approach.
However, repeated breakout failures can cause some traders to modify their process.
A more conservative trader may decide that the pattern itself is no longer sufficient evidence.
Instead, additional confirmation may be required.
This confirmation can take many forms:
Increased volume.
Stronger momentum.
A successful retest.
Market structure confirmation.
Support and resistance validation.
A continuation signal following a pullback.
The key idea is simple.
The more uncertainty created by previous failed attempts, the more evidence some traders may require before entering a position.
The chart provides an excellent example of how such an approach could be implemented.
Conservative Alternative #1: Waiting for the Pullback
After the eventual breakout occurred, one possible approach would have been to avoid chasing price immediately.
This concept is especially relevant after a series of failed breakouts.
Repeated failures often condition traders to expect disappointment. As a result, buying immediately after a breakout can feel uncomfortable.
A more conservative trader may instead choose to wait for price to revisit an area of support.
On the chart, a relevant buy-side UFO (UnFilled Orders) support zone was located between:
109’12’0 and 108’27’0
Interestingly, price retraced into that area immediately following the breakout.
For traders using market structure alongside technical patterns, this retracement provided an opportunity to evaluate whether buyers were still willing to defend previously identified support.
Rather than entering during the breakout itself, the trader could have waited for price to return toward the support zone and then assessed whether the original bullish thesis remained intact.
This approach introduces an important advantage.
Instead of reacting emotionally to the breakout, the trader allows the market to provide additional information.
The retracement becomes a test.
If buyers continue defending the support area, confidence in the breakout may increase.
If support fails, the trader avoids participating in a potentially unsuccessful setup.
Neither outcome guarantees success.
The objective is simply to improve decision quality through patience.
Conservative Alternative #2: Waiting for Confirmation After the Pullback
Some traders may choose to be even more selective.
For them, the retracement itself is still not enough.
After multiple failed breakout attempts, they may require evidence that buyers have regained control following the pullback.
This is where continuation confirmation becomes relevant.
On the chart, the retracement day established a clear high and low.
Once price subsequently traded above the high of that retracement day, the market provided another piece of information.
Buyers were no longer merely defending support.
They were actively pushing price beyond the prior day's range.
From a price-action perspective, this behavior can be interpreted as evidence of renewed upside participation.
Again, this does not guarantee that prices will continue higher.
No chart pattern can provide certainty.
However, for a trader who has already witnessed several failed breakouts, this additional confirmation may help justify participation.
The important lesson is not whether the trade ultimately succeeds.
The important lesson is understanding how confirmation can be layered into a trading process when confidence in a pattern has been weakened by repeated failures.
A technical pattern does not become more reliable simply because it has existed for longer.
In some situations, repeated failures may justify raising the standard of evidence before acting.
What If the Pattern Works? What If It Fails?
Every trading hypothesis eventually arrives at two critical questions:
What happens if the market moves in the anticipated direction?
What happens if the market proves the hypothesis wrong?
Surprisingly, many traders spend far more time thinking about the first question than the second.
Yet from a risk management perspective, both deserve equal attention.
In the case of the Falling Wedge shown on the chart, a traditional chart-pattern trader might begin by calculating a projected target.
This process typically involves measuring the height of the pattern and projecting that distance from the breakout point.
Applying this methodology to the current structure produces a projected objective near:
113’03’0
There is nothing inherently wrong with this technique. It has been used by technical analysts for decades and provides a systematic way of estimating potential price movement.
However, projected targets have one notable limitation.
They are purely mathematical.
The calculation itself does not consider the actual structure of the market that exists between the breakout point and the projected destination.
This is where some traders may choose to incorporate additional layers of analysis.
Looking Beyond the Pattern Projection
One challenge with pattern projections is that markets rarely move in straight lines.
Even when a pattern functions as expected, price frequently encounters support and resistance levels before reaching a theoretical objective.
Ignoring those areas can sometimes result in unrealistic expectations.
The chart highlights several relevant UFO resistance zones positioned below the projected target.
The first significant resistance area begins near:
111’12’5
This observation creates an interesting dilemma.
Should a trader focus exclusively on the textbook pattern target?
Or should market structure influence trade management decisions?
Reasonable traders may reach different conclusions.
Some may continue targeting the full projected objective.
Others may decide that the presence of meaningful resistance justifies a more conservative approach.
In this case, a trader emphasizing market structure might view 111’12’5 as a logical area to evaluate potential profit-taking decisions.
The rationale is straightforward.
If sellers have previously demonstrated interest in that region, price could encounter friction before reaching the larger technical projection.
The objective is not to predict a reversal.
Rather, it is to acknowledge the existence of nearby market structure that could influence future price behavior.
This distinction is important because risk management is often less about certainty and more about preparation.
Defining Invalidation
While traders frequently discuss entry techniques and profit objectives, invalidation is equally important.
Every trading idea begins with a hypothesis.
In this example, the hypothesis may be summarized as follows:
The Falling Wedge breakout remains valid and buyers continue to maintain control above support.
If that assumption proves incorrect, the trader needs a predefined mechanism for exiting the position.
Returning to the chart, the previously discussed UFO support zone extends between:
109’12’0 and 108’27’0
For traders using this area as a key component of their analysis, a move below the lower boundary may suggest that the bullish thesis is weakening.
More importantly, it could indicate that the breakout itself has failed.
This concept highlights one of the advantages of combining chart patterns with market structure.
The pattern identifies opportunity.
The surrounding structure helps define invalidation.
Rather than placing a stop loss at an arbitrary distance, some traders prefer using levels that directly challenge the assumptions underlying the trade.
If the market moves beneath the support zone, the original rationale for participating may no longer be present.
Whether the trader ultimately exits or reassesses the situation becomes a matter of individual process, but the principle remains the same:
A hypothesis should always include a mechanism for determining when it is no longer valid.
Understanding Treasury Futures That Trade in Fractions
Treasury futures are unique compared to many other futures contracts because they are quoted using fractional pricing conventions.
Traders familiar with stock indices, energy products, currencies, or metals often encounter a learning curve when first analyzing Treasury markets.
Instead of conventional decimal pricing, Treasury futures are generally quoted in points and fractions of a point.
For example, a quotation such as:
109’12’0
should not be interpreted in the same manner as a stock trading at 109.12.
Treasury futures use a fractional system where each tick equals 1/2 of 1/32 of one point.
This convention dates back many years and remains widely used throughout fixed-income markets.
Understanding this pricing methodology is important because even relatively small price movements can represent meaningful changes in contract value.
For newer market participants, Treasury futures may initially appear unusual compared to other futures markets.
However, once the fractional pricing structure becomes familiar, chart interpretation becomes considerably easier.
The key takeaway is simple:
Always understand how a market is quoted before evaluating risk, reward, or position sizing.
10-Year T-Note Futures Contract Specifications
The 10-Year Treasury Note Futures contract is one of the most actively followed interest-rate futures products.
Some key contract characteristics include:
Contract size: $100,000 face value of a U.S. Treasury Note.
Tick value: 1/2 of 1/32 of one point = $15.625 per contract.
Margin requirement: ~$1875 per contract.
Margin requirements are subject to change, traders should always verify current figures directly through their brokerage provider before evaluating a trade.
Because Treasury futures reflect expectations and activity within the fixed-income market, they are frequently monitored by traders, portfolio managers, hedgers, and institutional participants seeking exposure to interest-rate movements.
The contract's liquidity and long history make it a widely recognized benchmark within the Treasury futures complex.
Illustrative Trade Case Study
Using the chart as an educational example, a conservative trader might construct the following hypothetical framework:
Observe the Falling Wedge breakout.
Recognize the existence of multiple failed breakout attempts.
Wait for a retracement rather than immediately chasing the breakout.
Monitor the UFO support zone between 109’12’0 and 108’27’0.
Wait for price to demonstrate renewed upside decisiveness.
Observe price trading above the retracement day's high.
Use nearby UFO resistance around 111’12’5 as a potential area of interest.
Use a stop below the UFO support zone to define invalidation.
This example is not intended to suggest future market direction.
Instead, it demonstrates how additional confirmation can be incorporated into a trading process after repeated breakout failures create skepticism.
The educational lesson is not whether the trade succeeds.
The educational lesson is how a trader might adapt their process when confidence in a pattern has been weakened by prior unsuccessful attempts.
Risk Management: The Real Lesson Behind the Pattern
Many discussions about technical analysis focus on finding opportunities.
Far fewer discussions focus on managing uncertainty.
Yet uncertainty is the one characteristic present in every market.
The most valuable lesson from this chart may not be the Falling Wedge itself.
It may be the decision-making process surrounding the pattern.
Repeated failures created doubt.
Rather than ignoring that doubt, a conservative trader could choose to respond by requiring additional confirmation.
That confirmation might come from:
A successful retest.
Support validation.
Stronger price action.
Market structure alignment.
Trading above a key reference level.
Different traders will have different standards.
What matters is having a process.
A technical pattern should never be viewed as certainty.
It is merely a framework for organizing probabilities.
Risk management remains the mechanism that protects traders when those probabilities fail to materialize.
Conclusion
The Falling Wedge pattern discussed in this case study ultimately produced an upside breakout, but the path leading to that breakout is arguably more educational than the breakout itself.
Multiple failed attempts during May likely reduced confidence among many market participants. A trader who had witnessed those failures may have chosen not to trust the next breakout immediately.
Instead, patience could have become part of the strategy.
Waiting for a retracement.
Waiting for support to hold.
Waiting for price to trade above the retracement day's high.
Each additional requirement raises the threshold of evidence needed before participation.
Whether one agrees with that approach or not, the underlying principle remains valuable.
A technical pattern does not necessarily become more convincing simply because it remains on the chart longer.
Sometimes repeated failures justify becoming more selective.
In those situations, skepticism is not necessarily a sign of indecision.
It may simply be another form of risk management.
Data Consideration
When charting futures, the data provided could be delayed. Traders working with the ticker symbols discussed in this idea may prefer to use CME Group real-time data plan on TradingView: www.tradingview.com - This consideration is particularly important for shorter-term traders, whereas it may be less critical for those focused on longer-term trading strategies.
General Disclaimer
The trade ideas presented herein are solely for illustrative purposes forming a part of a case study intended to demonstrate key principles in risk management within the context of the specific market scenarios discussed. These ideas are not to be interpreted as investment recommendations or financial advice. They do not endorse or promote any specific trading strategies, financial products, or services. The information provided is based on data believed to be reliable; however, its accuracy or completeness cannot be guaranteed. Trading in financial markets involves risks, including the potential loss of principal. Each individual should conduct their own research and consult with professional financial advisors before making any investment decisions. The author or publisher of this content bears no responsibility for any actions taken based on the information provided or for any resultant financial or other losses.
Gold Approaching a Potential Bullish BreakoutGold appears to be trading inside a falling wedge pattern, which is generally considered a bullish reversal structure when it forms after a strong uptrend. Price is currently testing the upper boundary of the wedge, making this a key decision zone.
Short-Term Outlook
A daily close above the wedge resistance would confirm a bullish breakout.
Targets: 4,500 → 4,800 → 5,000
Stop-loss: Below 4,200
Long-Term Outlook
The primary uptrend remains intact despite the recent correction.
A confirmed breakout could mark the beginning of the next impulsive rally.
Targets: 5,000 → 5,400 → 5,600
Stop-loss: Weekly close below 4,000
Summary
Gold is attempting to break out of a falling wedge after a multi-month correction. If buyers push price above the wedge resistance and hold the breakout, the probability of a move toward 4,800–5,000 increases significantly. However, failure to break out could lead to another decline toward the 3,800–4,000 support zone before the longer-term uptrend resumes.