ICT Smart Trend Signals [TradingFinder] Volume OB + Pivots Delta
🔵Introduction
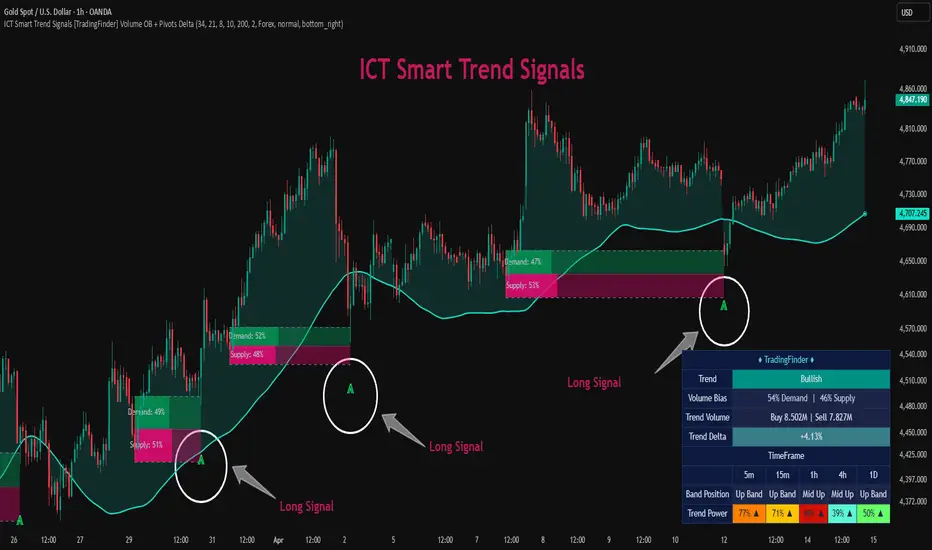
Understanding the forces behind price movement is one of the most important aspects of market analysis. ICT Smart Trend Signals combines ICT market concepts, Smart Money analysis, Volume Imbalance, Order Blocks, Demand & Supply zones, and Price Action confirmation into a complete volume-driven trading framework. Instead of analyzing price movement alone, this indicator focuses on the relationship between price action and market participation to identify trend direction, momentum strength, and potential trading opportunities.
The foundation of this system is its Volume Intelligence Engine, which analyzes market activity by separating volume into Buying Volume and Selling Volume to measure the balance between buyers and sellers. By calculating Demand Strength and Supply Strength, the indicator helps traders understand which side of the market has more control.

Strong Demand Strength indicates dominant buying pressure, while stronger Supply Strength highlights increased selling pressure. This allows traders to evaluate whether a market move is supported by real participation or if the current trend may be weakening.
Another important component is the analysis of Volume Data, Volume Pressure, and Trend Delta. Volume Pressure measures the imbalance between buying and selling activity to identify the dominant market force, while Trend Delta shows the difference between accumulated buying and selling volume during a trend.
Positive Trend Delta indicates stronger buyer participation, while negative Trend Delta reflects stronger seller control. These volume-based measurements provide additional context for understanding trend quality, momentum, and possible shifts in market direction.
The indicator also identifies Volume Imbalance Order Blocks, which are created from significant differences between buying and selling pressure. These zones represent areas where strong market participation has occurred and can act as important reaction areas when price returns to them. By combining Volume Imbalance with ICT concepts, Demand & Supply analysis, and market structure, the indicator helps traders focus on meaningful zones instead of relying only on traditional support and resistance levels.
Three different signal models are available to adapt to different market conditions. Order Block Reaction Signals identify potential opportunities when price interacts with Volume Imbalance Order Blocks and Demand/Supply zones. Trend Line Pin Bar Signals combine a dynamic volume-based trend line with Price Action confirmation to detect possible continuation setups during established trends. Trend Change Signals highlight potential shifts in market direction by monitoring changes in volume pressure, buyer and seller dominance, and overall trend conditions.
Beyond signal generation, the indicator provides a complete market analysis dashboard with Multi-Timeframe Trend Analysis, Dynamic ATR Trend Bands, Band Position, and Trend Power measurement. Traders can monitor trend direction, volume bias, trend delta, and trend strength across multiple timeframes to better understand the overall market context. This indicator can be used for scalping, intraday trading, and swing trading, depending on the timeframe where signals are generated. Lower timeframes can provide faster setups, while higher timeframes can help identify stronger trends and larger market structures.
🔵How to Use
Before using the signals, traders should first analyze the market condition from the indicator dashboard and trend system. The goal is not to take every signal, but to understand the current balance between buyers and sellers and use signals when market conditions support the setup.
The Trend Line and Volume Analysis provide the first layer of market understanding. Traders can observe whether the market is under bullish or bearish control by checking the trend direction together with Demand Strength, Supply Strength, and Trend Delta.
When the trend direction, volume pressure, and Delta are aligned, the market usually shows stronger participation from one side. For example, a bullish trend supported by higher Demand Strength and positive Trend Delta indicates stronger buyer activity, while a bearish trend with dominant Supply Strength and negative Trend Delta shows stronger seller participation.
The Volume Imbalance Order Blocks are used as key reaction areas. Instead of searching for entries in random locations, traders can wait for price to return to these zones and evaluate the reaction. A bullish Order Block can act as a potential demand area where buyers may defend the price, while a bearish Order Block can act as a potential supply area where sellers may appear. Combining the reaction from these zones with trend direction and volume conditions can help traders filter weaker setups.
The indicator provides three different signal models that can be used depending on the market situation. Each signal focuses on a different type of opportunity:
🟣Buy Signals
Bullish Volume Imbalance Order Block Signal
This signal is generated when price interacts with a bullish Volume Imbalance Order Block. Traders can use this setup when price returns to a demand-based zone and shows signs of buyer reaction.

A stronger bullish setup is usually supported by bullish trend conditions, higher Demand Strength, and positive Trend Delta, showing that buying pressure remains active around the zone.

Bullish Trend Line Pin Bar Signal
This signal is designed for trend continuation scenarios. When the market is already moving upward, a pullback toward the dynamic trend line followed by a bullish Pin Bar can indicate that buyers are defending the trend area.

Traders can use this signal together with volume confirmation to evaluate whether the pullback is a temporary correction or a possible trend weakness.

Bullish Trend Change Signal
This signal focuses on possible transitions from bearish conditions into bullish market phases. It appears when the indicator detects an improvement in buying pressure and a change in the overall volume-based trend state.

Traders can use this signal to monitor early stages of potential upward movements, especially when volume conditions begin shifting in favor of buyers.
🟣Sell Signals
Bearish Volume Imbalance Order Block Signal
This signal appears when price returns to a bearish Volume Imbalance Order Block and reacts from a supply-based area. Traders can use this setup to identify locations where sellers previously showed strong participation.

A stronger bearish setup is supported by higher Supply Strength, negative Trend Delta, and bearish trend conditions, indicating stronger selling pressure.

Bearish Trend Line Pin Bar Signal
This signal is used for continuation opportunities during bearish trends. When price retraces toward the dynamic trend line and forms a bearish Pin Bar, it can indicate that sellers are defending the trend area.

Combining this signal with supply dominance and negative volume conditions can help traders identify higher-quality bearish setups.

Bearish Trend Change Signal
This signal highlights possible transitions from bullish conditions into bearish market phases. It appears when selling pressure increases and the volume-based trend state begins shifting toward sellers.

Traders can use this signal to monitor potential downside movements and changing market conditions.
🔵Settings
Volume MA Length: Defines the calculation period used for the volume-weighted demand and supply analysis. Higher values provide a smoother view of market pressure, while lower values react faster to volume changes.
Volume Pressure Length: Controls the smoothing period of buying and selling pressure calculations. Increasing this value reduces noise and creates a more stable volume pressure analysis.
Trend Smoothing: Adjusts the smoothing of the Volume Center line. Higher values create a smoother trend line, while lower values make the indicator respond faster to market changes.
Pressure Threshold %: Defines the minimum volume pressure required to confirm bullish or bearish trend conditions. Higher values filter weaker movements and focus on stronger volume imbalances.
Slope Confirmation: When enabled, the indicator uses the slope direction of the Volume Center to confirm trend direction and reduce false trend changes.
ATR Length: Defines the ATR calculation period used for dynamic trend bands. Higher values create wider and smoother bands, while lower values make the bands more sensitive to volatility changes.
Band Distance: Controls the distance of the trend bands from the Volume Center. Increasing this value creates wider trend zones, while lower values generate tighter bands.
Ultra Volume Data: Enables additional volume data sources to combine volume information from multiple providers and create a broader volume analysis.
Market: Selects the market type for volume data sources. Available options include Forex, Crypto, and Stock.
Info Table: Displays the multi-timeframe dashboard containing trend direction, volume bias, trend volume, trend delta, band position, and trend power information.
Table Text Size: Controls the text size of the dashboard.
Table Position: Changes the location of the dashboard on the chart.
Alert: Enables alerts for generated signals. After enabling this option, traders can create TradingView alerts to receive notifications when new signals appear.
🔵Conclusion
ICT Smart Trend Signals combines volume analysis, market structure, and price action concepts to provide a complete framework for understanding market behavior. By analyzing Buying Volume, Selling Volume, Demand & Supply Strength, Volume Pressure, and Trend Delta, the indicator helps traders identify the dominant force behind price movements and evaluate the quality of existing trends. The integration of Volume Imbalance Order Blocks, Trend Line Pin Bar Signals, and Trend Change Signals provides different approaches for analyzing continuation setups, reaction zones, and possible market transitions.
This indicator is designed to be a flexible market analysis tool that can be used across different trading styles, including scalping, intraday trading, and swing trading. By combining multi-timeframe trend analysis, dynamic trend bands, and volume-based confirmations, traders can gain a clearer view of market conditions and make decisions based on the relationship between price movement and market participation rather than relying on price action alone.
Understanding the forces behind price movement is one of the most important aspects of market analysis. ICT Smart Trend Signals combines ICT market concepts, Smart Money analysis, Volume Imbalance, Order Blocks, Demand & Supply zones, and Price Action confirmation into a complete volume-driven trading framework. Instead of analyzing price movement alone, this indicator focuses on the relationship between price action and market participation to identify trend direction, momentum strength, and potential trading opportunities.
The foundation of this system is its Volume Intelligence Engine, which analyzes market activity by separating volume into Buying Volume and Selling Volume to measure the balance between buyers and sellers. By calculating Demand Strength and Supply Strength, the indicator helps traders understand which side of the market has more control.
Strong Demand Strength indicates dominant buying pressure, while stronger Supply Strength highlights increased selling pressure. This allows traders to evaluate whether a market move is supported by real participation or if the current trend may be weakening.
Another important component is the analysis of Volume Data, Volume Pressure, and Trend Delta. Volume Pressure measures the imbalance between buying and selling activity to identify the dominant market force, while Trend Delta shows the difference between accumulated buying and selling volume during a trend.
Positive Trend Delta indicates stronger buyer participation, while negative Trend Delta reflects stronger seller control. These volume-based measurements provide additional context for understanding trend quality, momentum, and possible shifts in market direction.
The indicator also identifies Volume Imbalance Order Blocks, which are created from significant differences between buying and selling pressure. These zones represent areas where strong market participation has occurred and can act as important reaction areas when price returns to them. By combining Volume Imbalance with ICT concepts, Demand & Supply analysis, and market structure, the indicator helps traders focus on meaningful zones instead of relying only on traditional support and resistance levels.
Three different signal models are available to adapt to different market conditions. Order Block Reaction Signals identify potential opportunities when price interacts with Volume Imbalance Order Blocks and Demand/Supply zones. Trend Line Pin Bar Signals combine a dynamic volume-based trend line with Price Action confirmation to detect possible continuation setups during established trends. Trend Change Signals highlight potential shifts in market direction by monitoring changes in volume pressure, buyer and seller dominance, and overall trend conditions.
Beyond signal generation, the indicator provides a complete market analysis dashboard with Multi-Timeframe Trend Analysis, Dynamic ATR Trend Bands, Band Position, and Trend Power measurement. Traders can monitor trend direction, volume bias, trend delta, and trend strength across multiple timeframes to better understand the overall market context. This indicator can be used for scalping, intraday trading, and swing trading, depending on the timeframe where signals are generated. Lower timeframes can provide faster setups, while higher timeframes can help identify stronger trends and larger market structures.
🔵How to Use
Before using the signals, traders should first analyze the market condition from the indicator dashboard and trend system. The goal is not to take every signal, but to understand the current balance between buyers and sellers and use signals when market conditions support the setup.
The Trend Line and Volume Analysis provide the first layer of market understanding. Traders can observe whether the market is under bullish or bearish control by checking the trend direction together with Demand Strength, Supply Strength, and Trend Delta.
When the trend direction, volume pressure, and Delta are aligned, the market usually shows stronger participation from one side. For example, a bullish trend supported by higher Demand Strength and positive Trend Delta indicates stronger buyer activity, while a bearish trend with dominant Supply Strength and negative Trend Delta shows stronger seller participation.
The Volume Imbalance Order Blocks are used as key reaction areas. Instead of searching for entries in random locations, traders can wait for price to return to these zones and evaluate the reaction. A bullish Order Block can act as a potential demand area where buyers may defend the price, while a bearish Order Block can act as a potential supply area where sellers may appear. Combining the reaction from these zones with trend direction and volume conditions can help traders filter weaker setups.
The indicator provides three different signal models that can be used depending on the market situation. Each signal focuses on a different type of opportunity:
🟣Buy Signals
Bullish Volume Imbalance Order Block Signal
This signal is generated when price interacts with a bullish Volume Imbalance Order Block. Traders can use this setup when price returns to a demand-based zone and shows signs of buyer reaction.
A stronger bullish setup is usually supported by bullish trend conditions, higher Demand Strength, and positive Trend Delta, showing that buying pressure remains active around the zone.
Bullish Trend Line Pin Bar Signal
This signal is designed for trend continuation scenarios. When the market is already moving upward, a pullback toward the dynamic trend line followed by a bullish Pin Bar can indicate that buyers are defending the trend area.
Traders can use this signal together with volume confirmation to evaluate whether the pullback is a temporary correction or a possible trend weakness.
Bullish Trend Change Signal
This signal focuses on possible transitions from bearish conditions into bullish market phases. It appears when the indicator detects an improvement in buying pressure and a change in the overall volume-based trend state.
Traders can use this signal to monitor early stages of potential upward movements, especially when volume conditions begin shifting in favor of buyers.
🟣Sell Signals
Bearish Volume Imbalance Order Block Signal
This signal appears when price returns to a bearish Volume Imbalance Order Block and reacts from a supply-based area. Traders can use this setup to identify locations where sellers previously showed strong participation.
A stronger bearish setup is supported by higher Supply Strength, negative Trend Delta, and bearish trend conditions, indicating stronger selling pressure.
Bearish Trend Line Pin Bar Signal
This signal is used for continuation opportunities during bearish trends. When price retraces toward the dynamic trend line and forms a bearish Pin Bar, it can indicate that sellers are defending the trend area.
Combining this signal with supply dominance and negative volume conditions can help traders identify higher-quality bearish setups.
Bearish Trend Change Signal
This signal highlights possible transitions from bullish conditions into bearish market phases. It appears when selling pressure increases and the volume-based trend state begins shifting toward sellers.
Traders can use this signal to monitor potential downside movements and changing market conditions.
🔵Settings
Volume MA Length: Defines the calculation period used for the volume-weighted demand and supply analysis. Higher values provide a smoother view of market pressure, while lower values react faster to volume changes.
Volume Pressure Length: Controls the smoothing period of buying and selling pressure calculations. Increasing this value reduces noise and creates a more stable volume pressure analysis.
Trend Smoothing: Adjusts the smoothing of the Volume Center line. Higher values create a smoother trend line, while lower values make the indicator respond faster to market changes.
Pressure Threshold %: Defines the minimum volume pressure required to confirm bullish or bearish trend conditions. Higher values filter weaker movements and focus on stronger volume imbalances.
Slope Confirmation: When enabled, the indicator uses the slope direction of the Volume Center to confirm trend direction and reduce false trend changes.
ATR Length: Defines the ATR calculation period used for dynamic trend bands. Higher values create wider and smoother bands, while lower values make the bands more sensitive to volatility changes.
Band Distance: Controls the distance of the trend bands from the Volume Center. Increasing this value creates wider trend zones, while lower values generate tighter bands.
Ultra Volume Data: Enables additional volume data sources to combine volume information from multiple providers and create a broader volume analysis.
Market: Selects the market type for volume data sources. Available options include Forex, Crypto, and Stock.
Info Table: Displays the multi-timeframe dashboard containing trend direction, volume bias, trend volume, trend delta, band position, and trend power information.
Table Text Size: Controls the text size of the dashboard.
Table Position: Changes the location of the dashboard on the chart.
Alert: Enables alerts for generated signals. After enabling this option, traders can create TradingView alerts to receive notifications when new signals appear.
🔵Conclusion
ICT Smart Trend Signals combines volume analysis, market structure, and price action concepts to provide a complete framework for understanding market behavior. By analyzing Buying Volume, Selling Volume, Demand & Supply Strength, Volume Pressure, and Trend Delta, the indicator helps traders identify the dominant force behind price movements and evaluate the quality of existing trends. The integration of Volume Imbalance Order Blocks, Trend Line Pin Bar Signals, and Trend Change Signals provides different approaches for analyzing continuation setups, reaction zones, and possible market transitions.
This indicator is designed to be a flexible market analysis tool that can be used across different trading styles, including scalping, intraday trading, and swing trading. By combining multi-timeframe trend analysis, dynamic trend bands, and volume-based confirmations, traders can gain a clearer view of market conditions and make decisions based on the relationship between price movement and market participation rather than relying on price action alone.
可在付費空間使用
此指標僅對TFlab [TradingFinder] Pro Trading Toolkits 訂閱用戶開放。加入訂閱即可訪問此腳本及TradingFinder的其他腳本。

💎Paid Space (VIP): tradingview.com/spaces/TradingFinder/
✅Telegram support team: t.me/TFLABS
🧠Free Forex, Crypto & Stock Trading tutorial, same as ICT, Smart Money & Price Action:
tradingfinder.com/education/forex/
✅Telegram support team: t.me/TFLABS
🧠Free Forex, Crypto & Stock Trading tutorial, same as ICT, Smart Money & Price Action:
tradingfinder.com/education/forex/
免責聲明
這些資訊和出版物並非旨在提供,也不構成TradingView提供或認可的任何形式的財務、投資、交易或其他類型的建議或推薦。請閱讀使用條款以了解更多資訊。
可在付費空間使用
此指標僅對TFlab [TradingFinder] Pro Trading Toolkits 訂閱用戶開放。加入訂閱即可訪問此腳本及TradingFinder的其他腳本。
💎Paid Space (VIP): tradingview.com/spaces/TradingFinder/
✅Telegram support team: t.me/TFLABS
🧠Free Forex, Crypto & Stock Trading tutorial, same as ICT, Smart Money & Price Action:
tradingfinder.com/education/forex/
✅Telegram support team: t.me/TFLABS
🧠Free Forex, Crypto & Stock Trading tutorial, same as ICT, Smart Money & Price Action:
tradingfinder.com/education/forex/
免責聲明
這些資訊和出版物並非旨在提供,也不構成TradingView提供或認可的任何形式的財務、投資、交易或其他類型的建議或推薦。請閱讀使用條款以了解更多資訊。