指標

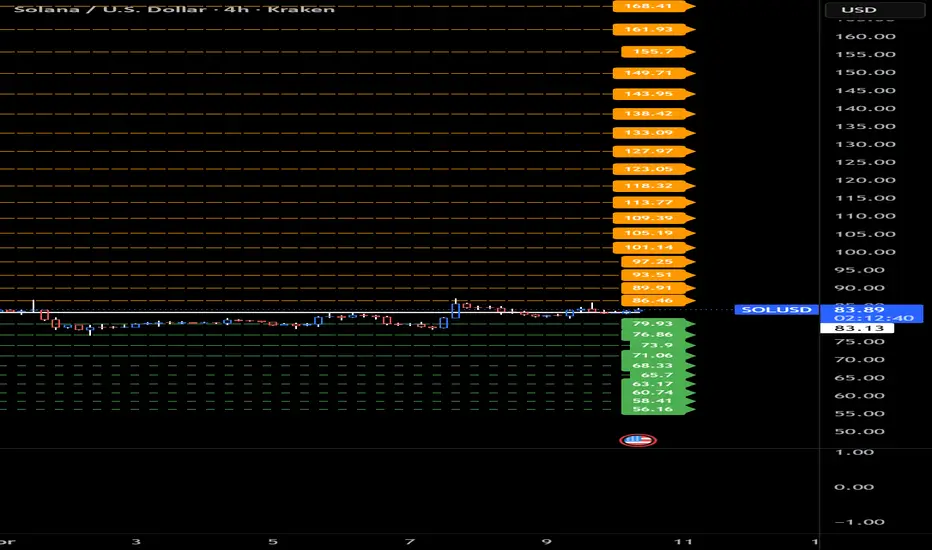
O'Neill TerminalThe O'Neill Terminal PineScript indicator, designed to overlay on price charts and present market dynamics using a physics-inspired orbital framework combined with a Bloomberg-style terminal interface.
The code is structured into six logical sections:
Bloomberg Design System
The script first defines a color palette that mimics the Bloomberg Terminal aesthetic. It includes amber as the primary highlight color, along with green, red, cyan, dark background, and gray. These colors are later used for chart elements and the on-screen telemetry panel.
Quantitative Engine (Niche Metrics)
This section calculates the core analytical components of the orbital model using a configurable lookback period (default 20).
Central Axis (axis)
A volume-weighted moving average (VWMA) acts as the equilibrium axis. This represents the gravitational center of the system where price tends to stabilize.
Z-Score (z_score)
Measures statistical deviation of price from its mean using standard deviation. It quantifies how far price has moved from equilibrium in sigma units, identifying extreme conditions.
Angular Velocity (velocity)
Calculated as the rate of change (ROC) of price over 5 periods. This represents rotational speed within the orbital framework.
Angular Acceleration (acceleration)
Calculated as the rate of change of velocity. This captures changes in momentum and helps identify divergence between speed and force.
Relative Mass (rel_mass)
The ratio of current volume to its moving average. This models the “mass” of capital entering the system, amplifying movement when elevated.
Kinetic Energy (kinetic)
Derived from ATR relative to price. This measures volatility intensity and represents vibrational energy inside the orbital structure.
Terminal Status Logic
The script assigns a market state based on Z-score thresholds:
Above +2 sigma - OVERBOUGHT
Below -2 sigma - OVERSOLD
Between ±0.5 sigma - EQUILIBRIUM
Otherwise - NEUTRAL
Each state is paired with a corresponding color for visual emphasis in the terminal.
Chart Plots
The indicator plots minimal visual elements:
The central axis (VWMA equilibrium line)
Upper hull boundary at +2 standard deviations
Lower hull boundary at -2 standard deviations
These boundaries represent the structural limits of the orbital system.
Bloomberg UI Helper Function
A reusable function formats rows in a table using monospaced font and aligned columns. This function is used to render the telemetry terminal with consistent styling.
Terminal Rendering
A table is created in the top-right corner of the chart, simulating a live telemetry terminal. It updates on the last bar and displays:
System header and status label
Orbital state (derived from Z-score)
Z-score value
Velocity (price ROC)
Acceleration (momentum change)
Relative mass (volume intensity)
Kinetic energy (ATR-based volatility)
Last price
Countdown timer to next candle close
Hull stability index
The Hull Stability index is calculated as:
stability = 100 − (|Z-Score| × 25)
This provides a percentage-based measure of how stable price is relative to the orbital hull. Lower values indicate structural stress and higher probability of reversal.
Overall, the indicator functions as a physics-inspired telemetry dashboard. It interprets price movement as an object inside a rotating system, where deviation from equilibrium, momentum dynamics, capital mass, and volatility energy combine to define market state and potential turning points. It was fun creating it :) 指標

指標

指標

指標
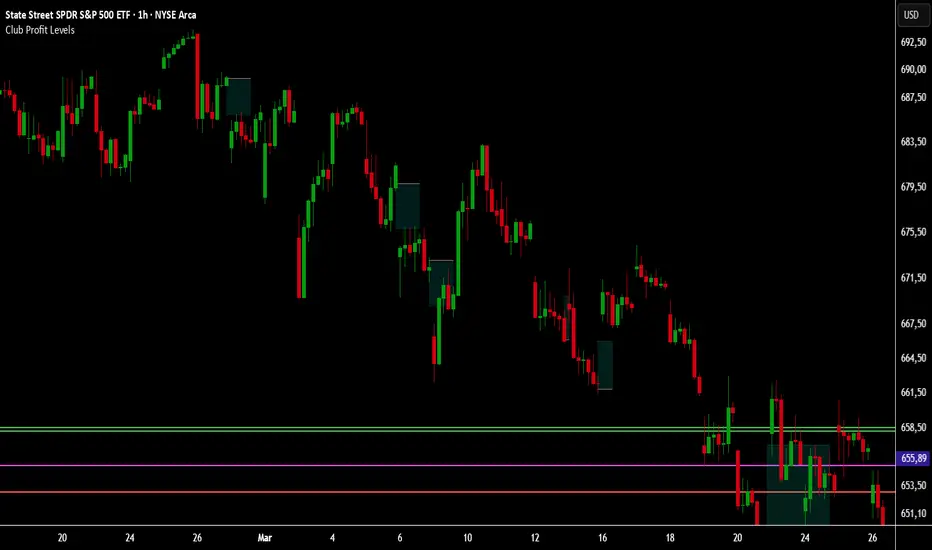
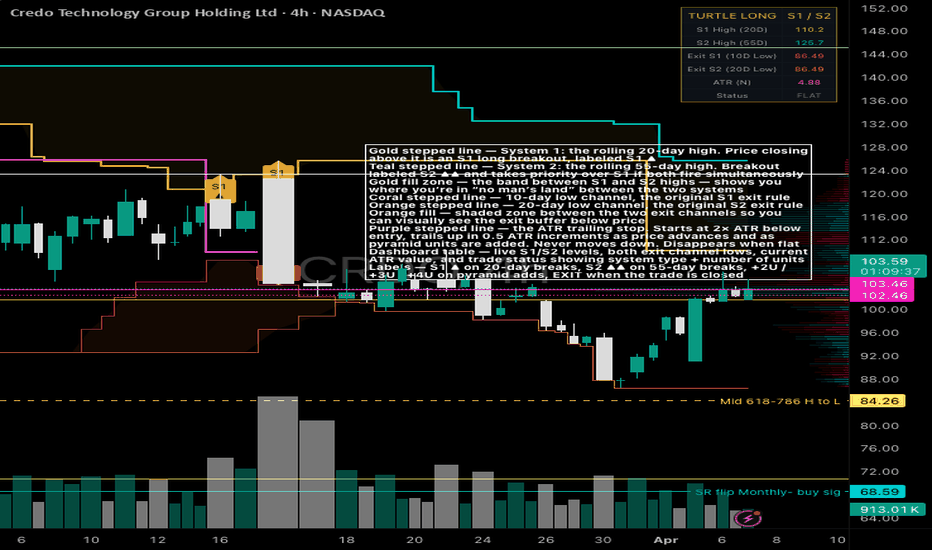
Turtle Soup_Long Sys1 & Sys2 Gold stepped line — System 1: the rolling 20-day high. Price closing above it is an S1 long breakout, labeled S1 ▲
Teal stepped line — System 2: the rolling 55-day high. Breakout labeled S2 ▲▲ and takes priority over S1 if both fire simultaneously
Gold fill zone — the band between S1 and S2 highs — shows you where you’re in “no man’s land” between the two systems
Coral stepped line — 10-day low channel, the original S1 exit rule
Orange stepped line — 20-day low channel, the original S2 exit rule
Orange fill — shaded zone between the two exit channels so you can visually see the exit buffer below price
Purple stepped line — the ATR trailing stop. Starts at 2× ATR below entry, trails up in 0.5 ATR increments as price advances and as pyramid units are added. Never moves down. Disappears when flat
Dashboard table — live S1/S2 levels, both exit channel lows, current ATR value, and trade status showing system type + number of units
Labels — S1 ▲ on 20-day breaks, S2 ▲▲ on 55-day breaks, +2U / +3U / +4U on pyramid adds, EXIT when the trade is closed 指標
指標

指標

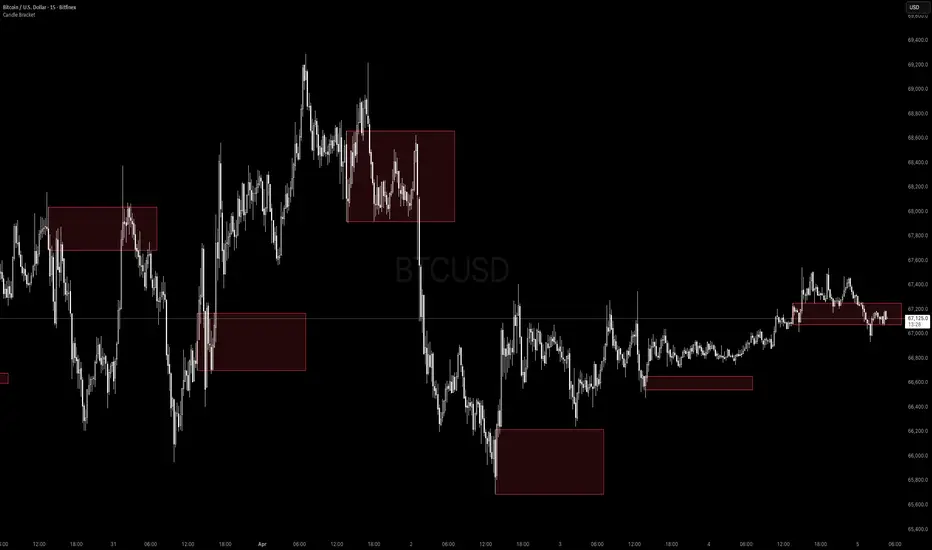
Candle Bracket - Mark Any HTF Candle's Range at a Specific TimeWhat It Does
Candle Bracket draws a visual range box using the High and Low of any higher timeframe candle at a user-defined time of day. Set it to the 9:30 AM 15-minute candle and you get the Opening Range. Set it to the London open, the New York open, or any key session candle — the indicator marks it automatically, every day.
Use Cases
- Opening Range Breakout (ORB) - Mark the 9:30 or 9:45 AM candle as your initial range
- Session Opens - London (3:00 AM ET), New York (9:30 AM ET), Asia (8:00 PM ET)
- News Candles - Mark a recurring economic release time (e.g. 8:30 AM CPI/NFP candle)
- Custom Reference Ranges - Any time-based candle you want as a daily anchor
Settings
- Fixed Timeframe - The HTF candle to pull from (e.g. 15, 30, 60, D)
- Target Hour / Minute - The exact time of the candle you want to mark
- Timezone - Defaults to America/New_York. Adjustable for any global session
- Rectangle Width (Bars) - How far the box extends to the right
- Box Color + Opacity Full visual customization
How to Use It
1. Set the timeframe to match your candle of interest (e.g. '15' for a 15-minute candle)
2. Set the target time to the candle's open time (e.g. '9:30' for the NY open candle)
3. The box draws automatically on every matching candle going back in history
4. Use the High and Low of the box as your key levels breakout, rejection, or retest
Notes
- Works on any asset and any chart timeframe
- Keeps the last 20 boxes by default to manage memory efficiently
- Best used on intraday charts (1m, 5m, 15m) when targeting session-level candles 指標

SR Breakout Arrows# SR Breakout Arrows - Documentation
> **Version**: v1.0
> **Author**: jeffprotrader168
> **Pine Script Version**: v6
> **License**: Mozilla Public License 2.0
---
## 📊 Overview
A fractal-based Support/Resistance breakout detection indicator. Uses `ta.pivothigh` / `ta.pivotlow` to identify local highs and lows as S/R levels, then signals with arrows when price breaks through these levels. Features optional RSI/CCI filtering and anti-repaint protection. Works on all markets and timeframes.
Ported from MQL4 (originally by Barry Stander 2004 / Lennoi Anderson 2015 / rewritten by Jeff Reed).
---
## 🎯 Key Features
- **Fractal-based S/R Detection**: Confirms fractals with 2 bars on each side, auto-extends horizontal lines until next fractal
- **Breakout Arrow Signals**: Draws triangle arrows below/above bars when close breaks S/R levels
- **Anti-Repaint Guarantee**: Signals only confirmed after bar close by default; historical arrows never disappear
- **RSI/CCI Filtering**: Optional dual-filter to reduce false breakouts
- **Deduplication**: Each S/R level triggers only one signal, preventing consecutive duplicate arrows
- **Bilingual Interface**: English / Traditional Chinese toggle
- **Full Color Customization**: S/R lines and arrow colors are fully configurable
---
## ⚙️ Configuration
### ⚙️ Basic Settings
| Parameter | Default | Description |
|-----------|---------|-------------|
| `i_language` | EN | Language selection (EN / Traditional Chinese) |
### 📊 Signal Settings
| Parameter | Default | Range | Description |
|-----------|---------|-------|-------------|
| `i_signal_dots` | 3 | | Minimum bars after fractal before breakout is valid; higher = more conservative |
| `i_apply_to_close` | true | — | When enabled, signals only appear after bar closes (anti-repaint) |
### 🔍 RSI/CCI Filter
| Parameter | Default | Range | Description |
|-----------|---------|-------|-------------|
| `i_rsicci_filter` | false | — | Enable RSI+CCI dual filtering |
| `i_rsi_period` | 14 | | RSI calculation period |
| `i_rsi_overbought` | 75.0 | — | RSI overbought level (buy signals require RSI below this) |
| `i_rsi_oversold` | 25.0 | — | RSI oversold level (sell signals require RSI above this) |
| `i_cci_period` | 14 | | CCI calculation period |
| `i_cci_buy_level` | 50.0 | — | CCI buy threshold (buy signals require CCI above this) |
| `i_cci_sell_level` | -50.0 | — | CCI sell threshold (sell signals require CCI below this) |
### 🎨 Display
| Parameter | Default | Description |
|-----------|---------|-------------|
| `i_show_arrows` | true | Show breakout arrows |
| `i_show_sr_lines` | true | Show S/R extension lines |
| `i_res_color` | Red | Resistance line color |
| `i_sup_color` | Blue | Support line color |
| `i_arrow_up_color` | Blue | Breakout up arrow color |
| `i_arrow_dn_color` | Magenta | Breakout down arrow color |
---
## 📈 Visual Elements
### Chart Elements
- **Resistance Line** (red stepline): Extends horizontally from upper fractal high until a new upper fractal appears
- **Support Line** (blue stepline): Extends horizontally from lower fractal low until a new lower fractal appears
- **Breakout Up Arrow** (blue triangle ▲ + BUY): Below the breakout bar, indicating bullish breakout
- **Breakout Down Arrow** (magenta triangle ▼ + SELL): Above the breakout bar, indicating bearish breakout
### Color Scheme
| Element | Default Color | Description |
|---------|--------------|-------------|
| Resistance Line | Red | Current resistance level |
| Support Line | Blue | Current support level |
| Breakout Up Arrow | Blue | Resistance Breakout: BUY |
| Breakout Down Arrow | Magenta | Support Breakout: SELL |
---
## 🔔 Alert Conditions
### Alert 1: SR Breakout: BUY
**Trigger Condition**: Close price breaks above resistance level (all filter conditions passed)
**Message Format**: `{ticker} Resistance Breakout: BUY at {close} ({interval})`
### Alert 2: SR Breakout: SELL
**Trigger Condition**: Close price breaks below support level (all filter conditions passed)
**Message Format**: `{ticker} Support Breakout: SELL at {close} ({interval})`
### Alert 3: SR Breakout: Any
**Trigger Condition**: Any direction breakout signal
**Message Format**: `{ticker} S/R Breakout at {close} ({interval})`
---
## 💡 Usage Tips
1. **Best Timeframes**: M15 to H4; fractals are more reliable on higher timeframes
2. **Complementary Indicators**: Pair with trend indicators (MA, ADX) to confirm breakout direction
3. **Trading Hours**: Avoid low-liquidity sessions (e.g., late Asian session) where breakout quality is lower
4. **Risk Management**: Arrows are entry references; combine with fixed or ATR-based stop-loss
### Suggested Configurations
**Conservative** (fewer false breakouts):
```
i_signal_dots = 5
i_rsicci_filter = true
i_rsi_overbought = 70, i_rsi_oversold = 30
```
**Aggressive** (fast reaction):
```
i_signal_dots = 1
i_rsicci_filter = false
```
**Balanced** (recommended default):
```
i_signal_dots = 3
i_rsicci_filter = false
i_apply_to_close = true
```
---
## 🔍 Technical Details
### Algorithm Explanation
The indicator follows a three-step process:
**Step 1: Fractal Detection**
Uses `ta.pivothigh(high, 2, 2)` and `ta.pivotlow(low, 2, 2)` to detect local highs and lows. Requires 2 bars on each side for confirmation, consistent with the classic fractal definition. When a fractal is detected, the corresponding S/R level is updated and the bar counter resets.
**Step 2: S/R Extension and Counting**
Each bar increments the counter until a new fractal resets it. The counter ensures breakouts occur sufficiently far from the fractal (`>= i_signal_dots`), avoiding false signals near the fractal point.
**Step 3: Breakout Detection**
When close price exceeds the S/R level, the counter meets the threshold, and the level hasn't been broken before, a breakout signal fires. Optional RSI/CCI filtering further screens low-quality breakouts.
### Anti-Repaint Mechanism
| Layer | Mechanism | Description |
|-------|-----------|-------------|
| 1 | `barstate.isconfirmed` gate | Only evaluates breakout after bar close |
| 2 | `var` persistence | State accumulates bar-by-bar; historical results are fixed |
| 3 | `last_broken_res/sup` dedup | Each S/R value triggers only once |
### Performance Considerations
- All visuals use `plot()` / `plotshape()` — no dynamic drawing object limits
- RSI/CCI computed once per bar, referenced via function to avoid redundant calls
---
## 📝 Version History
| Version | Date | Changes |
|---------|------|---------|
| v1.0 | 2026-04-03 | Initial release: full port from MQL4 to Pine Script v6 |
---
## 📌 FAQ
### Q1: How does this differ from the MQL4 version?
A: Core logic (fractal → S/R → breakout) is identical. The Pine version removes MQL4-specific GlobalVariable persistence (Pine auto-recalculates all history on load), arrow symbol codes (replaced with `plotshape`), and notification channel toggles (managed by TradingView platform). Adds color customization and bilingual interface.
### Q2: Why are some breakouts missing arrows?
A: Possible reasons: (1) `i_signal_dots` is set too high — not enough bars since fractal; (2) RSI/CCI filter is enabled but conditions aren't met; (3) The S/R level was already triggered by a previous breakout (dedup mechanism).
### Q3: Can both up and down arrows appear on the same bar?
A: Yes. Up and down breakouts are evaluated independently, allowing simultaneous signals in extreme market conditions.
### Q4: What happens with `i_apply_to_close = false`?
A: The latest unconfirmed bar participates in breakout evaluation, which may cause arrows to appear then disappear (repainting). Recommended to keep the default value `true`.
---
## 📞 Support & Feedback
For any questions or suggestions about this indicator, please feel free to open an Issue or Discussion.
---
*Last Updated: 2026-04-03*
指標

指標

Goldilocks Pivot Fractals v3.0v3.0 UPDATE — Three Signal Modes
This update adds a Signal Mode engine to the classic Williams
Fractals algorithm, giving traders three detection methods
from zero-delay scalping signals to fully confirmed swing
pivots.
WHAT'S NEW
Signal Mode Dropdown (Settings → Signal Mode):
Confirmed — The original Williams Fractals logic. Detects
pivot highs and lows by requiring n bars on each side to
confirm the fractal pattern. Signals are mathematically
confirmed but arrive after the lookback window completes.
Best for swing traders and higher timeframes (15m, 1H, 4H,
Daily) who prefer certainty. Labels display as
C: BUY / C: SELL.
Zero-Lag — Fires on the forming bar using momentum-reversal
detection. No lookforward bars required. When smoothed
momentum crosses zero and the bar closes in the signal
direction, the signal fires at bar close with zero delay.
Built for scalpers on fast instruments and lower timeframes
(1m, 2m, 5m). Labels display as Z: BUY / Z: SELL.
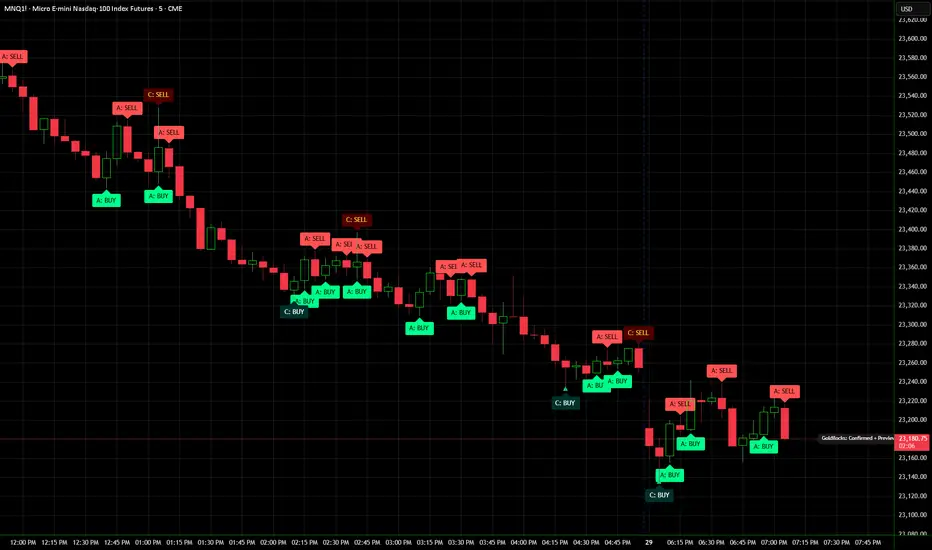
Confirmed + Preview — Runs both engines at the same time.
Alert labels (A: BUY / A: SELL) appear instantly when the
zero-lag engine detects a momentum reversal. Confirmed labels
(C: BUY / C: SELL) stamp later when the Williams Fractal
pattern fully validates. Early signal plus confirmed stamp,
side by side on the same chart.
ADDITIONAL IMPROVEMENTS
• All arrow markers converted to zoom-proof labels — arrows
hold their shape at every zoom level instead of shrinking
to invisible lines
• Independent toggles for Shapes, Alert Labels, and Buy/Sell
Labels — show exactly what you want, hide what you don't
• Arrow size control (tiny through huge)
• Alert label size control (independent sizing)
• Directional alert label colors — green background for
A: BUY, red background for A: SELL with black text for
high contrast on dark charts
• Sensitivity control for Zero-Lag mode
(Low / Normal / High)
• On-chart mode tag displays the active signal mode
• Full alert support across all modes
HOW TO USE
For scalping: Set Signal Mode to Zero-Lag. On a 2-minute MNQ
chart, the move can be 20-40 points in two bars. Waiting for
a confirmed fractal means watching someone else's profit.
Zero-Lag fires when the turn starts.
For swing trading: Set Signal Mode to Confirmed. The
classic Williams Fractal algorithm with n-bar confirmation on
each side. Let the pattern prove itself.
For both perspectives: Set Signal Mode to Confirmed + Preview.
The A: labels give you the real-time alert, the C: labels
confirm or invalidate. Use them together for higher-
conviction entries.
Adjust the Periods (n) setting to control the confirmation
window in Confirmed mode. Lower values detect smaller pivots
more frequently. Higher values filter for larger, more
significant swing points.
Works on any liquid market — futures, forex, crypto,
equities, indices. Use with trend confluence tools for best
results.
— NPR21
指標

Kevy Key Hour SetupKevy Key Hour Setup is a precision timing indicator built around the 3rd 5-minute candle of each hour as the primary directional trigger for NQ/MNQ futures and other liquid instruments.
At the start of each new hour, the indicator draws a zone box around the first candle of that hour to establish the broader hourly context. At the 10-minute mark, the 3rd 5-minute candle begins forming — this is the key candle. Once it closes at the 15-minute mark, the zone is officially locked with high and low boundary lines, a 50% midline, color-coded range fill (red above mid, green below mid), price labels, and configurable profit targets above and below.
Break signals fire the moment price closes outside the 3rd candle's range — a green LONG label below the bar on a topside break, a red SHORT label above the bar on a downside break. A max range filter prevents signals from firing on wide, choppy candles. Two sets of offset lines above and below the hourly candle high/low provide additional entry and trigger reference levels.
Built-in alerts:
🕐 New Hour Open — prep for the setup
✅ Zone Set at 15-min mark — 3rd candle closed, zone is live
🟢 LONG Trigger — close broke above 3rd candle high
🔴 SHORT Trigger — close broke below 3rd candle low
The Market Has a Rhythm
Every hour, institutional algorithms and market makers reset. The first 10 minutes of each hour (:00-:10) is the initial price discovery phase — market makers are feeling out where liquidity sits, running stops, and establishing the opening range for that hour. This is noise. You don't want to trade it.
The 3rd Candle Is the Tell
The 3rd 5-minute candle (:10-:15) is where the market starts to reveal its hand. By the time the first two candles have printed, the initial volatility has settled and a cleaner directional bias is beginning to form. The high and low of that 3rd candle represent the first meaningful range where both buyers and sellers have had a fair chance to respond to the hour's opening move. It's not random — it's the first candle of the hour where smart money has had time to position.
Why the Range Matters
The high and low of the 3rd candle become your decision levels. Price respecting and holding above the midline signals buyer control. Price sitting below the midline signals seller control. When price breaks and closes outside the range entirely, it signals that one side has won the argument for that hour and a directional move is likely to follow. The break is not a prediction — it's a confirmation.
The Max Range Filter
If the 3rd candle is too wide, the setup is disqualified. A wide candle means the market was already volatile and indecisive during that window — the range is too sloppy to use as a clean trigger. A tight, well-defined range produces a higher quality setup because the risk is defined and the breakout is more decisive.
The Offset Lines
The offset lines above and below the hourly candle give you a buffer zone around the key levels. Price often pokes through a level before committing, so the offset lines help you avoid getting triggered by a wick and instead wait for a more meaningful push through the level.
The Hourly Box
The hourly box drawn at the open of each hour gives you the broader context — it shows you where the market started the hour and how far price has moved relative to that opening candle. If the 3rd candle break aligns with price moving away from the hourly open in the same direction, that's added confluence.
The Bottom Line
The setup works because it's built on market structure that repeats every hour across liquid instruments. Institutions operate on schedules, algorithms reset on the hour, and liquidity cycles follow predictable rhythms. The 3rd candle is simply the first clean, unmanipulated read of where that hour wants to go — and the break of its range is your entry signal into that move.
指標

Smash Reversal(MastersinMarkets)Smash Reversal (MastersinMarkets)
Description
The Smash Reversal is a price-action-based technical indicator designed to identify exhaustion points in the market. It targets "Smash Bar" setups, which occur when a price trend overextends significantly beyond recent historical boundaries before showing signs of a reversal. This tool helps traders visualize these specific high-velocity exhaustion moments on any timeframe, providing a systematic way to monitor trend shifts without relying on lagging oscillators.
Core Logic
The script identifies two distinct phases for a valid signal:
The Smash Bar (Exhaustion) : For a bullish setup, a bar must close below the lowest low of the user-defined lookback period. For a bearish setup, it must close above the highest high of that period.
Price Action Filter : The logic incorporates an isOutside check to ignore "Outside Bars," ensuring that indecisive market range expansions do not trigger false exhaustion signals.
Confirmation Trigger : A signal is only plotted when the current bar’s price breaks the high (for buys) or low (for sells) of the preceding Smash Bar, confirming that momentum has officially shifted.
Uniqueness :
This indicator is unique because it combines relative price extremes with a strict confirmation requirement. While many reversal scripts trigger immediately upon a new low or high, the Smash Reversal requires:
A specific close-to-low/high relationship.
The exclusion of indecisive "Outside Bar" volatility.
Secondary price action confirmation before the signal appears. This multi-step validation is designed to protect traders from "falling knives" in strong trending environments.
Key Features :
Dynamic Lookback Inputs: Traders can independently adjust the "Smash Buy" and "Smash Sell" lookback periods to suit different market volatilities.
Visual Background Highlights: The script automatically shades the background of a valid Smash Bar (exhaustion candle) to alert the trader before the actual signal is triggered.
Non-Repainting Signals: The shapes are plotted using an offset to ensure that once a signal is confirmed and the bar closes, it remains fixed on the chart.
How to Use :
Identify the Setup: Look for the highlighted background areas on your chart. This indicates a potential "Smash" exhaustion is occurring.
Wait for the Triangle: Only enter a trade when the SeaGreen (Bullish) or Black (Bearish) triangle appears, as this signifies that price has successfully broken the Smash Bar’s extreme.
Settings Adjustment: If trading highly volatile assets like Nifty or Bank Nifty, consider increasing the lookback period to filter out minor price fluctuations.
Disclaimer :
Trading involves significant risk. This indicator is a tool for technical analysis and does not constitute investment advice. Past performance, as shown in any historical chart examples, is not a guarantee of future results. The future is fundamentally unknowable, and traders should always use appropriate stop-loss orders and risk management. 指標

Multi Timeframe Fractal Map [Herman]Multi Timeframe Fractal Map
This script is a multi-timeframe chart-reading framework that evaluates how the current candle interacts with the previous candle’s range across several timeframes, then combines that higher-timeframe context with intermarket comparison, structural execution levels, and session reference prices on one chart.
The core concept behind the script is a range interaction and acceptance/rejection model:
first, higher timeframe candles are reconstructed on the active chart,
then the current higher timeframe candle is compared with the previous higher timeframe candle,
then the script evaluates whether price is accepting expansion beyond that prior range or rejecting it,
then correlated markets are checked for confirmation or divergence,
and only after that are lower timeframe structural levels used for execution reference.
The script does not generate automated buy/sell orders.
Its purpose is to organize context first and execution second.
Why these components are combined
In discretionary intraday trading, traders often read:
higher timeframe structure on one chart,
range interaction and liquidity events on another,
intermarket confirmation separately,
execution levels on lower timeframes,
and session anchors such as PDH/PDL or Daily Open somewhere else.
This separation can lead to inconsistent interpretation.
This script combines these elements because each one evaluates a specific stage of price behavior: range interaction defines direction, intermarket comparison evaluates confirmation, and lower-timeframe structure is only used after that context is established.
The intended order is:
define higher timeframe structure,
classify current interaction with the previous higher timeframe range,
check whether correlated markets confirm or diverge,
establish current price location using reference levels,
use lower timeframe structural levels only after that context is already defined.
For that reason, the script is not intended as a group of unrelated tools. Each part is included to evaluate a different stage of the same chart-reading process.
1) Higher timeframe candle reconstruction
The script reconstructs multiple higher timeframe candles directly on the active chart.
For each selected higher timeframe, it maintains rolling values for:
open,
high,
low,
close,
and time.
These values are built dynamically from lower timeframe data, so the candles update while they are still forming.
This allows the script to show:
the current developing HTF candle body and wick,
prior completed HTF candles,
current HTF range expansion,
and countdown information for the active HTF candle.
The purpose of reconstruction is to keep higher timeframe structure visible on the execution chart instead of requiring the user to switch layouts.
2) Higher timeframe range interaction model
For each selected higher timeframe, the script compares the current candle with the previous candle’s range.
Using the previous candle as C1 and the current candle as C2, it evaluates:
sweep high when C2 high exceeds C1 high,
sweep low when C2 low breaks below C1 low.
It then evaluates where C2 closes relative to C1:
close above C1 high = acceptance above the prior range,
close below C1 low = acceptance below the prior range,
sweep without close beyond the boundary = rejection / failed expansion.
If neither side is swept, or if both sides are swept without clear directional acceptance, the state is treated as neutral.
This classification defines whether price is:
expanding and being accepted,
expanding but being rejected,
or not interacting with the prior range in a meaningful way.
3) Candle progression logic (Candle 2 / Candle 3)
The script evaluates sequential HTF candle behavior.
Candle 2
A Candle 2 condition is identified when:
the previous candle has a defined direction,
the current candle interacts with the prior extreme (high or low),
and the current candle closes back through or beyond that level.
This marks a potential reversal attempt.
Candle 3
A Candle 3 condition requires:
a valid prior Candle 2,
directional continuation,
and a close condition relative to the prior range (configurable strength).
This marks follow-through after the initial reaction.
The purpose of this progression is to distinguish between:
an initial reaction at a level,
and confirmed expansion following that reaction.
4) HTF classification table
The classification table summarizes the same range interaction logic across all active higher timeframes.
For each timeframe, the script uses:
C2 high, low, close,
and C1 high, low.
Classification rules:
LONG → C2 closes above C1 high
SHORT → C2 closes below C1 low
AVOID → all other cases, including:
both sides swept,
no sweep,
sweep without acceptance.
This output is deterministic and reflects current HTF behavior.
A combined bias is calculated by counting agreement across timeframes.
It summarizes alignment, not prediction.
5) Intermarket comparison (SMT)
The script compares correlated index markets to evaluate confirmation or divergence.
General conditions:
bearish divergence → one market forms a higher high while another does not confirm,
bullish divergence → one market forms a lower low while another does not confirm.
This comparison is aligned with the same reconstructed HTF structure.
Its purpose is to evaluate whether a move is supported across markets or shows relative weakness.
6) Sweep visualization
The script highlights sweep behavior directly on higher timeframe candles.
A sweep occurs when price moves beyond a previous HTF high or low.
The subsequent close determines whether that move is accepted or rejected.
This is part of the same range interaction model and is not a separate signal.
7) CISD structural execution levels
CISD levels are derived from changes in candle direction on lower timeframes, using the open price of the candle where the directional shift occurs.
The script tracks these levels as:
pending → identified but not yet confirmed,
confirmed → price closes beyond the level.
These levels represent local structure and are intended for execution reference only after higher-timeframe context is established.
For example, if a higher timeframe shows acceptance above the previous range and correlated markets confirm the move, a CISD break in that direction can be used as execution alignment.
8) HTF imbalance (FVG)
The script evaluates imbalance using non-overlapping price ranges:
bullish imbalance → earlier high is below a later low,
bearish imbalance → earlier low is above a later high.
If price trades back through the zone, it is considered invalidated.
These zones are shown in the context of reconstructed HTF candles.
9) Reference levels (location)
The script plots:
Previous Day High / Low,
Previous Day midpoint (50%),
Daily Open,
Midnight Open,
4H Open.
These levels define location only and are not used for directional classification.
10) Optional time segmentation
The script can divide the session into fixed time blocks and track their high and low.
This allows observation of:
compression,
expansion,
and failed expansion
within repeated time intervals.
How to use the script
The script is intended to be used in sequence:
Observe higher timeframe candles to define structure.
Evaluate how the current candle interacts with the previous HTF range.
Determine whether expansion is accepted or rejected.
Check intermarket comparison for confirmation or divergence.
Review multi-timeframe classification for alignment.
Use reference levels to determine location.
Use CISD levels for execution only if higher-timeframe context is aligned.
Lower timeframe signals should not be used independently.
Intended use
This script is intended for traders who:
use multi-timeframe analysis,
focus on range interaction and structural behavior,
use intermarket comparison as context,
and require structured decision-making on one chart.
Not intended as
an automated trading system,
a standalone signal generator,
or a guarantee of future performance.
Credits
Portions of the higher timeframe candle reconstruction were adapted from open-source work by Çağrı Dikici and are used with permission.
Disclaimer
This script is provided for analytical and educational purposes only.
It does not constitute financial or investment advice.
All trading involves risk. 指標

指標

指標

MTF ATR Wave (5m, 15m, 30m) by ogudora█ MTF ATR Wave (5m, 15m, 30m) by ogudora
A minute-timeframe ATR Supertrend companion indicator, designed to work alongside "MTF ATR (1H, 4H, 1D, 1W, 1M) with databox" — filling the gap between intraday micro-structure and higher-timeframe trend analysis.
█ WHAT IT DOES
This indicator plots ATR-based Supertrend lines for 5-minute, 15-minute, and 30-minute timeframes simultaneously on a single chart. It uses a gradient color system where shorter timeframes appear lighter and longer timeframes appear darker, giving you an instant visual read on how momentum is building — or fading — across minute-level structure.
█ WHY "WAVE"?
After a sell-off, recovery doesn't happen all at once. It cascades: the 5m Supertrend flips up first, then the 15m follows, and finally the 30m confirms. Watching these layers light up in sequence — like a wave rolling in — tells you whether a bounce has real traction or is just a dead cat.
█ KEY FEATURES
◆ Gradient Supertrend Lines
5m (lightest) → 15m (medium) → 30m (darkest). Uptrend linewidth=2, downtrend linewidth=1, so the indicator stays visually subordinate to the parent 1H/4H/1D lines.
◆ Trend-Change Circles (●)
A small dot appears at the exact price level where each timeframe's Supertrend flips direction.
◆ Warning / Break Signals (⚠️ / ⚡)
⚠️ Warning: Price breaks below an uptrend Supertrend line (potential trend failure).
⚡ Break: Price breaks above a downtrend Supertrend line (potential trend reversal).
Cooldown timers and daily count limits prevent signal spam.
◆ Reba Monitor (Recovery Progress Scorecard)
A table (top-left, off by default) scoring recovery health out of 9 points:
• ATR Score (0–3): How many of the 3 minute-TF Supertrends are in uptrend
• MA Score (0–6): Whether price is above the 20/50/200 EMA on 1-minute and 5-minute charts
Judgment labels: 🔴 Reba Fail → ⚪ Neutral → 🟡 Signs → 🟢 In Progress → 🟢 Confirmed
◆ Status Table (Databox)
Top-right table (off by default) showing for each timeframe:
TF | ↑↓ | Line Value | Deviation % | 100-Share Loss | Frozen Support | Missed-Move %
◆ 4 Color Presets
Switch the entire color scheme with one dropdown:
1. Green × Red (default)
2. Red × Blue (fully separates from the parent indicator's green/red)
3. White × Black (monochrome, zero interference with any overlay)
4. Cyan × Magenta
◆ Plot-Budget Optimised
Uses only 31 plot calls, leaving ample headroom to run alongside the parent indicator (which uses ~33) within TradingView's 64-plot limit.
█ HOW TO USE
1. Add this indicator alongside "MTF ATR (1H, 4H, 1D, 1W, 1M) with databox"
2. On a 1-minute or 5-minute chart, you'll see layered Supertrend lines cascading from 5m (closest to price) to 30m (furthest)
3. After a sell-off, watch the gradient flip from red to green — 5m first, then 15m, then 30m
4. Enable the Reba Monitor (Master Control) to get a numerical score confirming whether the bounce is holding above key EMAs
5. If the parent indicator's highlighter washes out the colors, try switching to the "Red × Blue" or "Cyan × Magenta" preset for contrast
█ RECOMMENDED SETTINGS
• Best viewed on 1m or 5m charts
• Pair with the parent indicator for full multi-timeframe coverage (1m → 1M)
• Status Table and Reba Monitor are OFF by default to keep the chart clean — enable when needed
• Individual colors and transparency can be fine-tuned via TradingView's style settings (gear icon → each plot line)
█ ALERTS
• 5m / 15m / 30m Warning and Break alerts
• Reba Score ≥ 7 (strong recovery signal)
• Reba Score = 9 (full confirmation)
• Reba Score ≤ 1 (recovery failure) 指標

指標

指標

指標
指標

指標