指標
基本面分析

DR Partials V3this is same as V2 but with some dif options, labels can be moved and all partial levels go away every 24h.
指標

Trend Structure & Untested LevelsTrend Structure & Tested Levels
Draws the swing trend as a zigzag, turns every swing into a support/resistance level, and tracks whether price has closed through it ("tested") or not ("untested").
Overview
A market-structure tool. It connects confirmed swing highs and lows into a clean zigzag trend line, then projects a horizontal level from each swing. Every level is classified by state — untested until a candle closes through it, after which the most recent break in each direction is flagged
指標
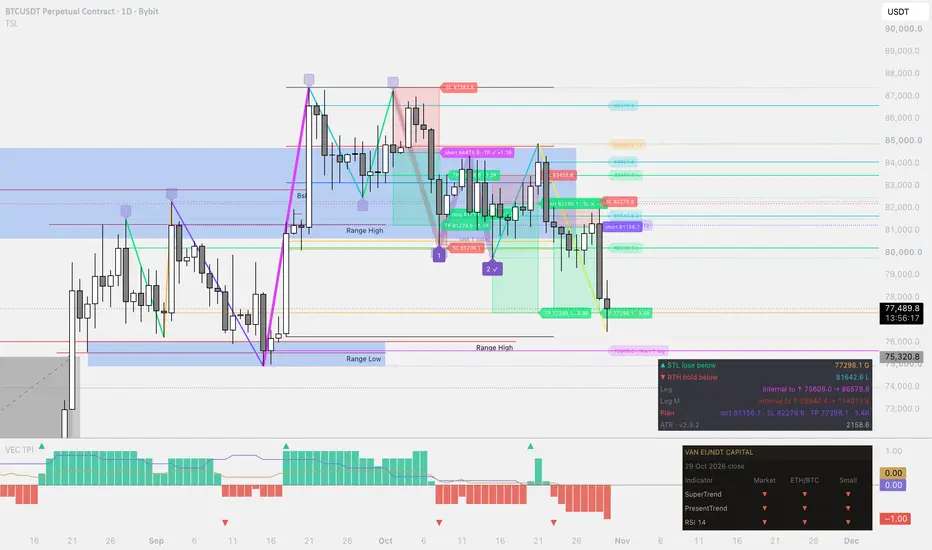
Smart Money Flow Engine v2.1 (Unlocking Signals)Trend Pulse — Adaptive Momentum Oscillator
Trend Pulse is a momentum oscillator designed to help traders spot shifts in trend strength before they show up clearly on price. It works on any market and timeframe.
How it works: The indicator blends a smoothed rate-of-change calculation with a volatility filter, so readings adapt to current market conditions instead of using fixed thresholds. Rising values suggest building bullish momentum; falling values suggest the opposite.
Features:
– Adaptive
指標

K-JohnWick : Oscillator Plus (with BB)Exclusive Advantages of K-JohnWick: Osc+ BB
1. The Power of Convergence: Volatility Bands Matched with Low-Lag Oscillator
Unlike standalone indicators that only show overbought or oversold levels, this advanced oscillator is dynamically integrated with volatility bands. It continuously calculates real-time price expansion and contraction inside the oscillator matrix.
The Advantage: It gives you an absolute edge in identifying mathematical exhaustion points (the exact macro tops and bottoms), p
指標

Coasyn Participation Intelligence FX DEMOCoasyn Participation Intelligence (Demo)
Coasyn Participation Intelligence is a TradingView indicator designed to provide a clear participation panel directly on your chart.
This demonstration version offers a preview of the indicator and its interface while introducing the Participation Intelligence concept.
Demo Features
Participation Intelligence panel
Clear visual dashboard
Lightweight chart display
Clean operator-focused interface
Pine Script® Version 6
The full version expands upon thi
指標

Bond Yield Spread V2Bonds Yield Spread with Selection possible
First Version was coded by © dennis8462
指標
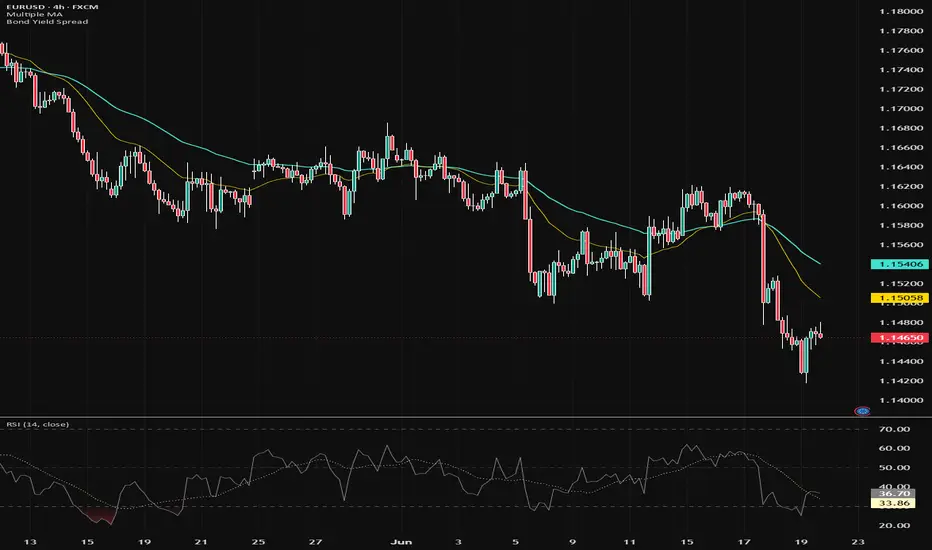
APEX Trend & Signal Engine [Viprasol]APEX Trend & Signal Engine — Regime-Aware Dual-Mode Toolkit
═══════════════════════════════════════════════════════════
THE PROBLEM IT SOLVES
═══════════════════════════════════════════════════════════
The single most expensive mistake in trading is using the wrong style for the
conditions — trend-following a sideways range (death by a thousand whipsaws), or
mean-reverting a strong trend (fighting a freight train). Most indicators apply ONE
style blindly and let you find out the hard way.
A
指標
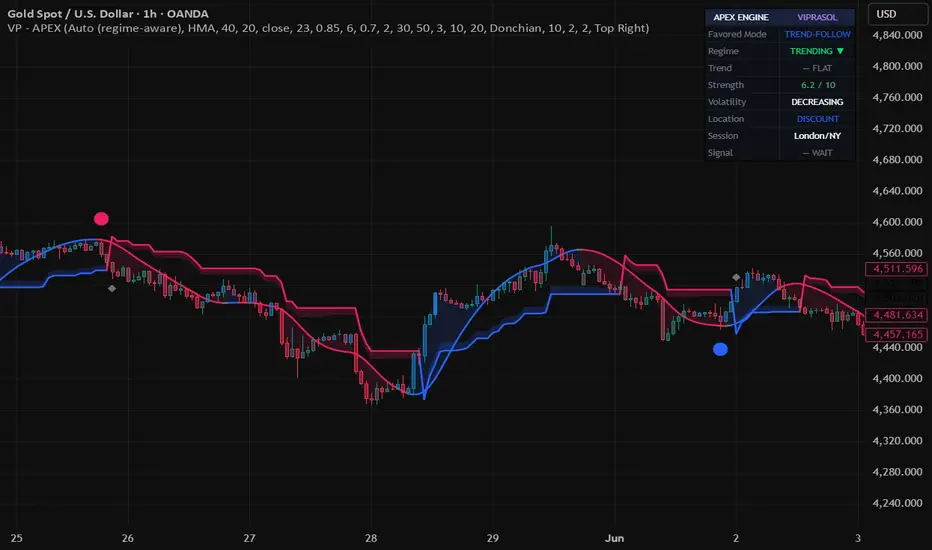
MA Confluence Engine [Viprasol]MA Confluence Engine — 15-MA Consensus Ribbon
═══════════════════════════════════════════════════════════
ONE CROSSOVER IS AN OPINION. FIFTEEN MAs AGREEING IS A TREND.
═══════════════════════════════════════════════════════════
A single moving-average crossover whipsaws constantly — two lines tangle in chop and
fire signal after signal that goes nowhere. MA Confluence Engine replaces that one
fragile opinion with the agreement of a 15-MA ribbon. It only signals when most of the
ribbon agrees
指標
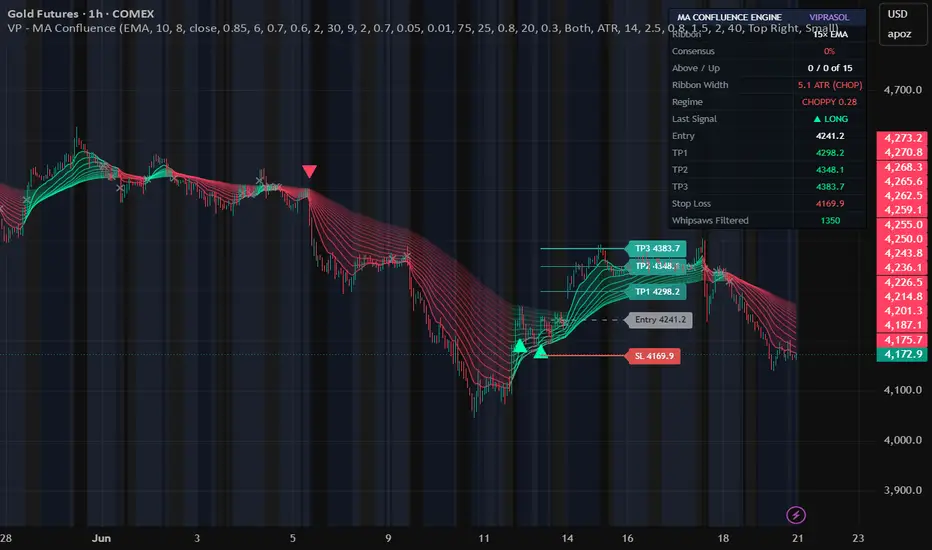
Historical Monthly Setup Probabilities for any assetThis indicator shows how price has historically behaved during each month of the year and can be used on any asset
It calculates the probability of a positive or negative monthly outcome based on past market data and presents the results directly on the chart
The goal is to provide historical context for the current month, rather than predict the future
The indicator can help identify months that have historically shown stronger upward or downward tendencies, while still leaving room for curr
指標

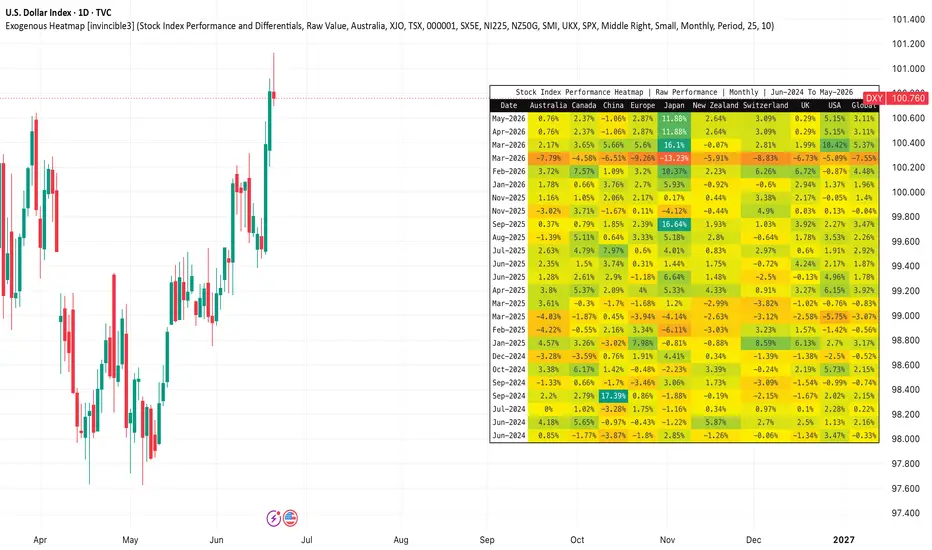
Exogenous Heatmap [invincible3]Exogenous Heatmap
The Exogenous Heatmap is a multi-country macro and market-performance dashboard designed to help traders and investors monitor external economic forces that may influence currencies, equities, commodities, and broader risk sentiment.
Instead of focusing only on price action from the current chart, this indicator visualizes key exogenous variables across major economies in a clean historical heatmap format. Users can compare countries by interest rates, GDP growth, balance o
指標
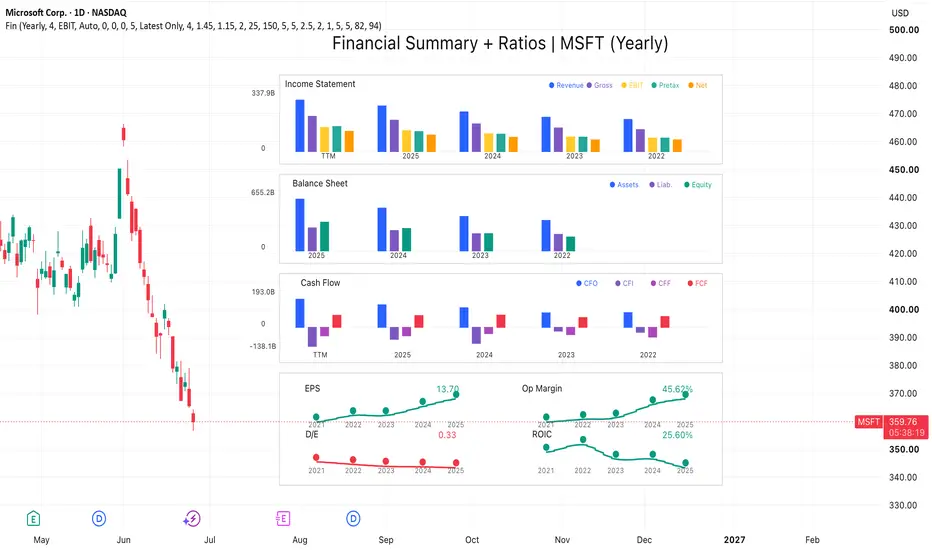
Stocks: Financial Summary [invincible3]Stocks: Financial Summary
Stocks: Financial Summary is a compact fundamental dashboard designed to visualize a company’s key financial statements directly on the TradingView chart.
The indicator displays three major financial sections:
Income Statement
Revenue, Gross Profit, EBIT or Operating Income, Pretax Income, and Net Income.
Balance Sheet
Total Assets, Total Liabilities, and Shareholders’ Equity.
Cash Flow
Cash Flow from Operations, Cash Flow from Investing, Cash Flow from Fin
指標
Dr. David Paul Earnings Swing System VectorVest v3 Multi-TFBuy signal fixed. Added Toggle for time chart periods optimization settings
指標

DR Partials V2this is a updated version of the old indicator. it has less noise and is cleaner for better visability.
指標

指標

Pips Measure & OHLC Table [XWiseTrade]Precise pips calculation and OHLC info for every candle.
This indicator provides:
• H-L and O-C pips on bar labels
• Hover tooltip with full OHLC table
• Optional static table for the last bar
• Customizable price digit display
Features:
• Accurate pip sizing (mintick-based)
• Three display modes (labels, tooltip, static table)
• Clean, professional formatting
Essential for forex traders tracking precise price movement and candle structure.
指標

Estimated Volume [XWiseTrade]Real-time projected volume for current and higher timeframes.
This indicator estimates the final volume of the current candle (and 3 selectable HTFs) based on elapsed time—perfect for spotting unusual activity early.
Features:
• Live estimated volume for current TF + 3 higher TFs
• Customizable table position
• Volume surge alert (when estimated volume exceeds previous candle by X%)
• Lightweight and accurate
Ideal for volume profile traders, breakout hunters, and anyone watching institutiona
指標

Auction Regime Atlas v1.0 # 🧭 Auction Regime Atlas v1.0
Auction Regime Atlas is a Pine Script v6 overlay indicator designed to visualize market acceptance, value migration, rejected auction areas, and contextual auction regimes directly on the chart.
❌ It is not a buy/sell signal tool.
❌ It is not a strategy.
❌ It is not an orderflow or liquidation-data replacement.
🎯 The goal is to help traders understand where price has been accepted, where value is forming, where price has moved away from value, and whether the cur
指標

FORBEST Trend CompassЭтот индикатор я создал не для поиска точек входа и не как источник сигналов. Его задача намного проще и, на мой взгляд, важнее — помочь быстро определить, кто сейчас контролирует рынок.
В основе индикатора лежат три скользящие средние:
🟢 MA 50 (зелёная) — отражает краткосрочный импульс рынка.
🟠 MA 100 (оранжевая) — показывает среднесрочное направление движения.
🟣 MA 200 (фиолетовая) — помогает определить долгосрочный тренд и общую структуру рынка.
Особое внимание стоит обратить на цвет фон
指標

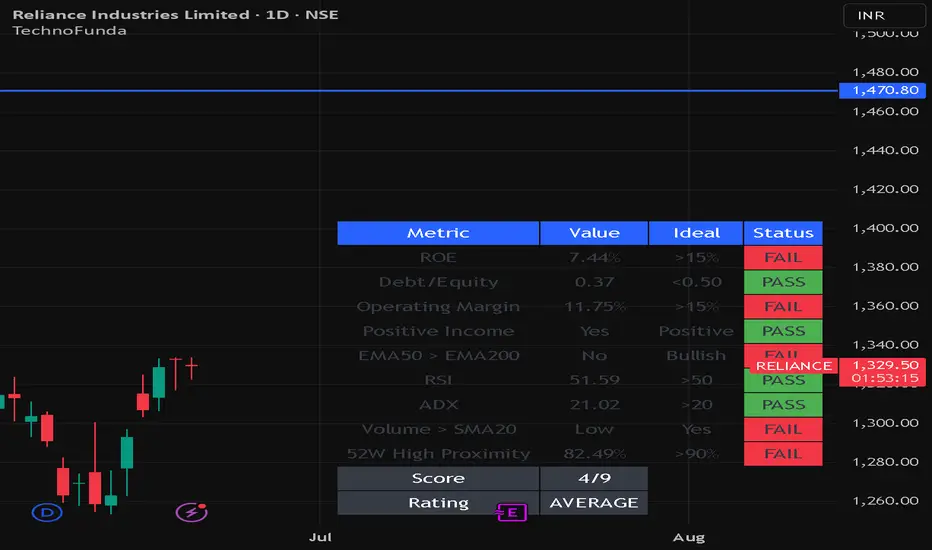
TechnoFundaTechnoFunda combines fundamental and technical analysis into a single dashboard.
Features:
• ROE > 15%
• Debt/Equity < 0.5
• Operating Margin > 15%
• Positive Net Income
• EMA50 > EMA200
• RSI > 50
• ADX > 20
• Volume > SMA20
• 52-Week High Proximity
Ratings:
8-9 = Excellent
6-7 = Strong
4-5 = Average
0-3 = Weak
Suitable for investors and positional traders.
指標
IOFI Elite Options Engine v4 (Realtime Execution)Institutional Engine is an advanced market-structure and order-flow based indicator designed to help traders identify high-probability trading opportunities in stocks, indices, futures, and options. The indicator combines multiple institutional trading concepts into a single framework, including trend detection, liquidity zones, momentum analysis, breakout validation, support and resistance mapping, and smart money activity tracking.
Key Features
✅ Institutional Trend Detection
✅ Smart Money E
指標

IOFI Elite Options Engine v4 (Realtime Execution)THIS INDICATOR IS PURELY FOR STOCK OPTIONS ONLY. The indicator basically shows stock option entry and exit precisely so that you do not incur losses and make sure you book maximum profit and also it shows you trend strength and rsi value with confidence scores. You may track it and make sure you evauate paper trade before you use it and enjoy making profits. This indicator is only a support system make sure you do your analysis before taking trade. Trade with discipline.
指標

Opening Price Level BreakoutA lightweight yet effective indicator designed for traders who need to monitor price breakouts at key historical levels — without cluttering their setup with multiple scripts.
What it does
Plots a fixed price level on the chart and fires an alert when the daily opening price breaks above it. Simple premise, high signal value: the opening price is a cleaner breakout trigger than an intraday cross, filtering out noise and false moves caused by wicks.
The problem it solves
TradingView's nativ
指標

Liquidity Zones + VWAP & EMA SystemLiquidity Zones + VWAP & EMA System
Educational Guide for New Traders
⚠️ IMPORTANT DISCLAIMER
This indicator is provided for educational purposes only. It is not financial advice, investment advice, or a recommendation to buy or sell any financial instrument. Trading involves substantial risk of loss and is not suitable for every investor. Past performance of any trading system or methodology is not indicative of future results. You are solely responsible for all trading decisions you make.
指標
