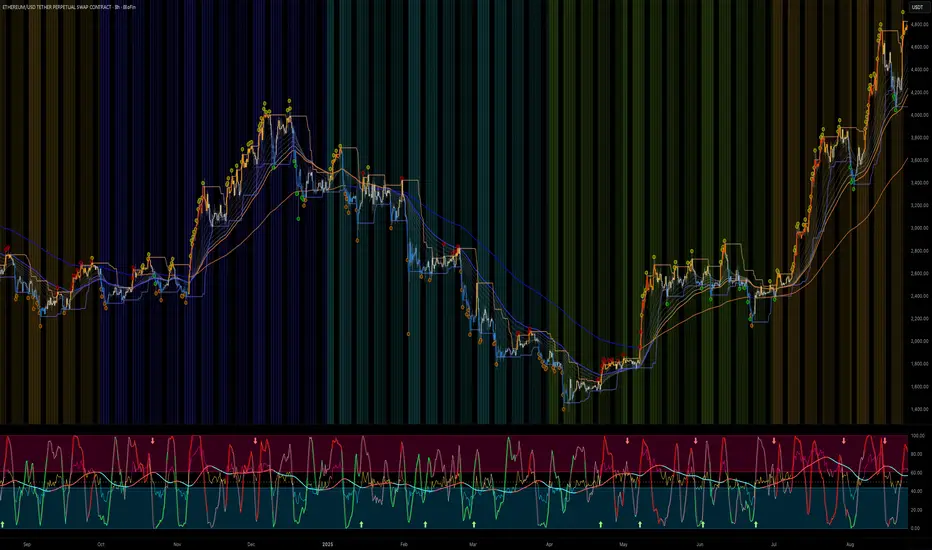
RSI jupanuce descriere sa mai bag - fac milionu de aici. zice ca trebuie sa mai scriu ceva aici, dar nu am ce指標由capitalshark提供16
Bollinger Bands on the RSIThe indicator uses Bollinger Bands on the RSI. Users can customize the RSI length and the Bollinger Bands length. The Bollinger Bands standard deviation can also be adjusted separately for more flexibility and convenience. In the Settings menu, you can find Trend Confirmation, which can be turned on or off depending on your preference. Trend Confirmation is used to reduce noise on the chart and is calculated using the bar before the trend. How the indicator can be used 1) As an RSI + EMA-styl指標由Zaimop提供16
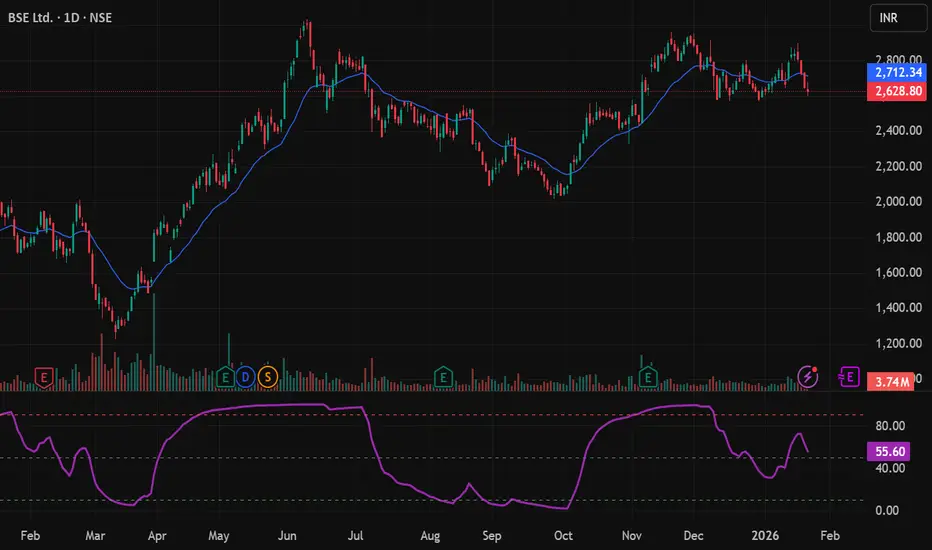
Mitesh RSI on 21 EMAMitesh Sir RSI settings as shared in Face2Face with Vivek Bajaj Sir指標由GraceEdge提供127
RSI Sigmoid (Saturation)# 📊 RSI Sigmoid (Saturation) Indicator --- ## 🎯 What Does This Indicator Do? This indicator transforms the traditional **RSI (Relative Strength Index)** using a **sigmoid function**, creating a mathematically "saturated" version that provides smoother, more controlled momentum signals. --- ## ✨ Key Features ### 🌊 **Saturation Effect** Unlike standard RSI which oscillates wildly between 0-100, this version uses a **hyperbolic tangent function** to compress extreme values: - 🔴 **Extreme rea指標由hasanaksoy199264提供2115
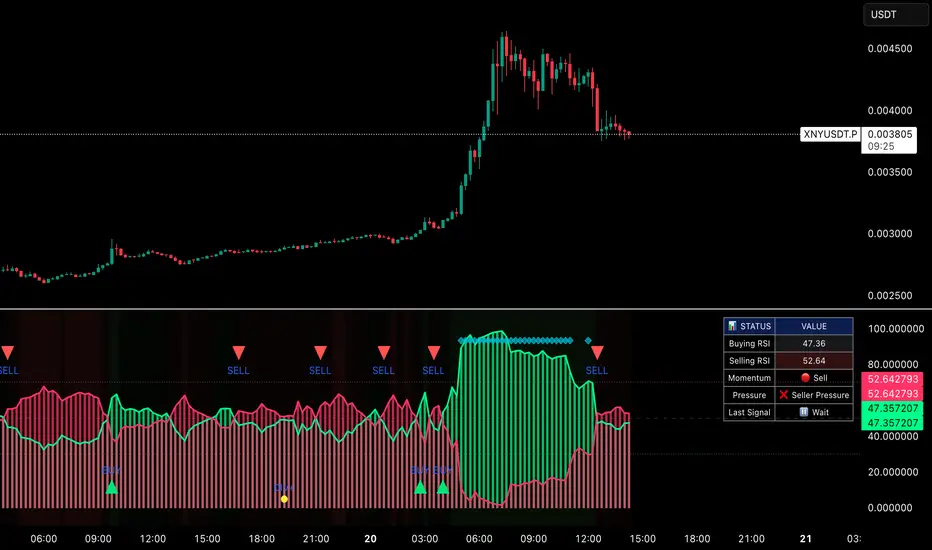
Pro Cumulative Volume RSI# Pro Cumulative Volume RSI - Professional Trading Indicator ## 📊 What is it? The **Pro Cumulative Volume RSI** is an advanced momentum oscillator that analyzes buying and selling pressure through volume distribution. Unlike traditional RSI that only tracks price movements, this indicator separates volume into buying and selling components, providing two distinct RSI calculations that reveal market dynamics from both perspectives. ## 🔍 How Does It Work? ### Volume Distribution Algorithm The 指標由hasanaksoy199264提供5444
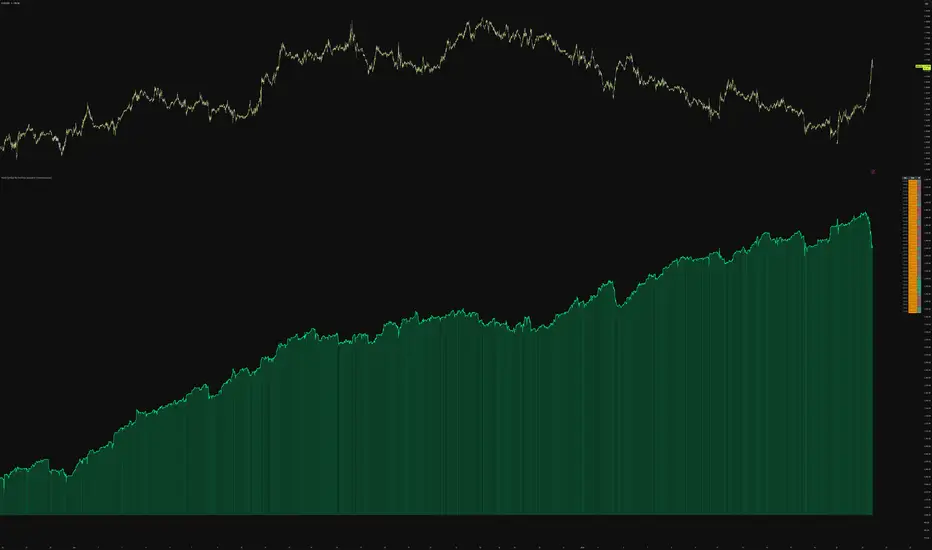
Multi-Symbol RSI Portfolio Simulator [Honestcowboy]The Multi-Symbol RSI Portfolio Simulator was build to test a theory, does the RSI indicator work in FOREX assets. Does it have predictive power. In this example the security function is used to fetch data for 40 different Forex pairs and it executes a very simple trading strategy. Sell when RSI hits 80, flatten if back below. Buy when RSI hits 20, flatten if back above. All executed on bar closes so no intra bar stuff. 🟦 🟦 🟦 Very Important Disclaimer This is a very crude indicator which doe指標由Honestcowboy提供22
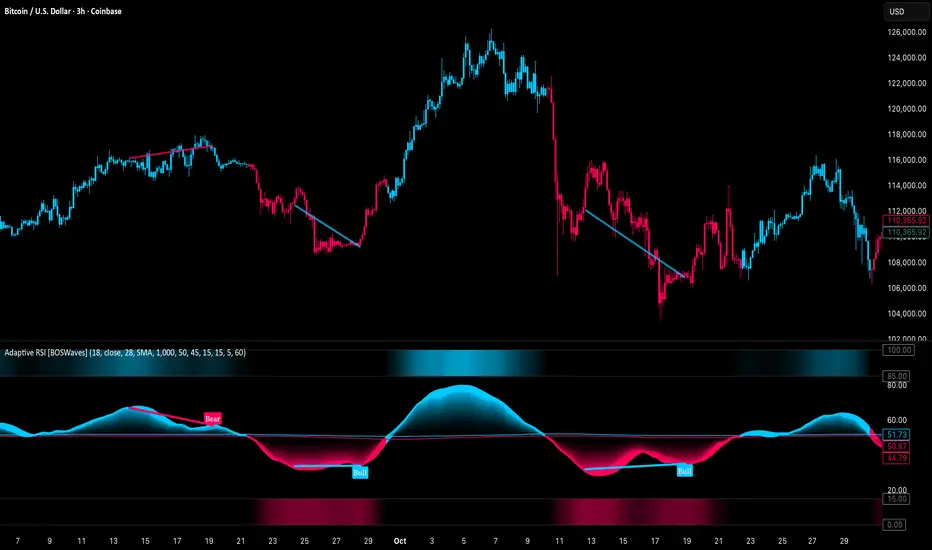
Adaptive RSI [BOSWaves]Adaptive RSI - Percentile-Based Momentum Detection with Dynamic Regime Thresholds Overview Adaptive RSI is a self-calibrating momentum oscillator that identifies overbought and oversold conditions through historical percentile analysis, constructing dynamic threshold boundaries that adjust to evolving market volatility and momentum characteristics. Instead of relying on traditional fixed RSI levels (30/70 or 20/80) or static overbought/oversold zones, regime detection, threshold pl指標由BOSWaves提供2804
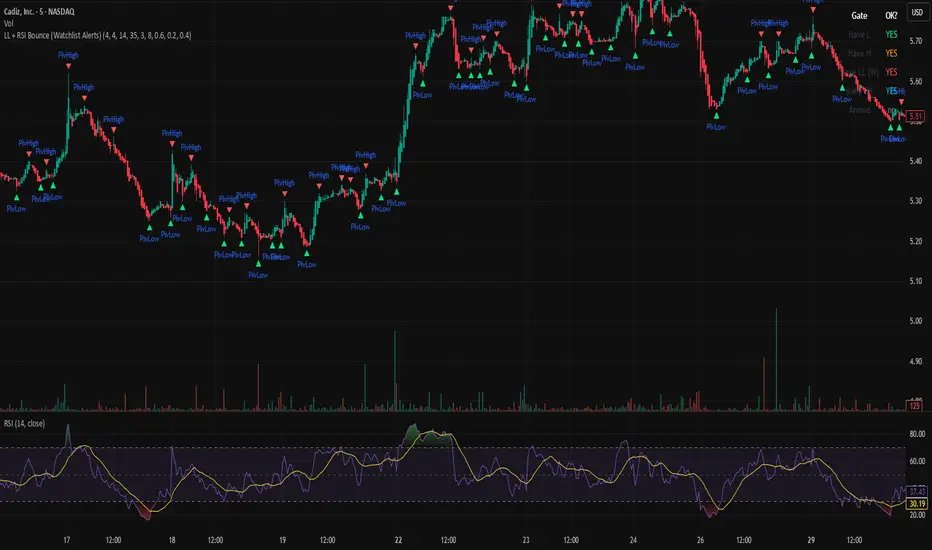
LL + RSI Bounce (Watchlist Alerts)Indicator detecting Lower lows followed by RSI bounce. 指標由chris_amato提供46
RSI VA(5MIN 7 , 1-4-1D 30)thank you everyone ! good luck.GOD BLESS YOU ALL nothing is impossible 指標由Okan3e提供10
RS Proxy Suite (Sector-Weighted) - by kuokkuokIndicator Description RS Proxy Suite (Sector-Weighted) is a Pine Script indicator for TradingView, designed for stock traders to calculate a stock's Relative Strength (RS) proxy score. This indicator simulates a market proxy universe by weighting multiple sector ETFs, evaluating a stock's strength relative to a benchmark like the SPX. Inspired by the M.E.T.S. (Multiple Edge Trading Strategy) system, it helps users identify market-leading stocks, potential breakout opportunities, and low-risk ent指標由Kuokkuok0503提供36
Sebastine All in One Indicator Sebastine All in One Indicator Introduction Markets speak in many dialects. Sometimes they whisper through volume, sometimes they shout via momentum, at times they breathe through volatility, and occasionally they leave footprints in OBV, PVT, RSI, or TSI. Most traders respond by stacking indicator after indicator—until the chart resembles a tangled fishing net. This indicator was built to untangle that net. Instead of plotting multiple indicators simultaneously, this tool lets you focus on one指標由sebastinecc提供33
RSI Statistics [Honestcowboy]⯁ Overview Research tool for analysing price behaviour based on RSI, find out how your favorite trading pair / timeframe combinations react to RSI. 5 Different projections based on 5 different value zones of RSI: RSI between 100-80 (very overbought) RSI between 80-60 (overbought) RSI between 60-40 (normal) RSI between 40-20 (oversold) RSI between 20-00 (very oversold) The script simply show price projections of different RSI environments so you can get an idea of what price could do wh指標由Honestcowboy提供115
Relative Strength Index (RSI) w/ Multi Time Frame w/ DivergencesThis indicator is an advanced evolution of the classic Relative Strength Index (RSI), designed to provide deeper market context by combining Momentum, Multi-Timeframe (MTF) analysis, and Divergences into a single, clean visual tool. Unlike standard indicators, RSI MTF Pro v2 allows you to configure the Main RSI and the Background Trend Zone independently, giving you full control over your strategy (e.g., watching a 15m RSI while monitoring the 4H trend). Key Features: 🚀 Dual MTF Engine: Compl指標由ardataskin提供288
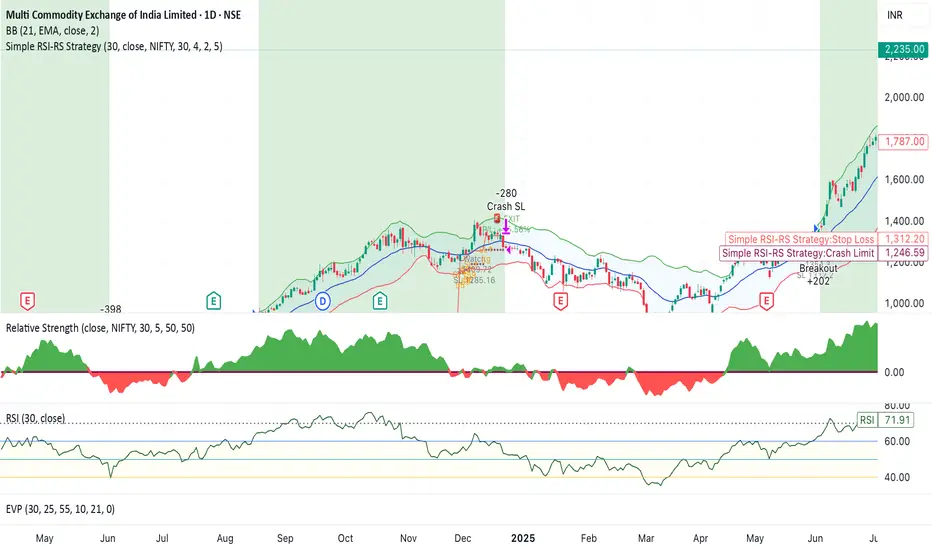
RSI-RS StrategyRSI-RS Strategy: Smart Trend Following 🚀 Overview This strategy combines Multi-Timeframe RSI with Mansfield Relative Strength to identify high-momentum breakouts in strong stocks. Unlike standard RSI strategies, it features a "Smart Trailing Stop" that tightens when momentum weakens but respects key RSI 50 support levels to avoid shaking you out of winning trades. Key Features ✨ 1. 🎯 High-Probability Entries Multi-Confirmations: Requires Monthly RSI > 60 and Weekly RSI > 60 (Trend is Up). Dual 策略由sandeepgoyal194提供已更新 1280
eBacktesting - Learning: RSI DivergenceseBacktesting - Learning: RSI Divergences is meant to train your eye to spot when a trend is losing momentum before price fully turns. How to study it (step-by-step) 1. Start with the trend - First decide if price is generally trending up or down (higher highs / higher lows vs lower highs / lower lows). - Divergences matter most after a trend has been running for a while. 2. Look for the “mismatch” - Bearish divergence: price prints higher highs, but RSI prints lower highs. - This ofte指標由BacktestingMaestro提供205
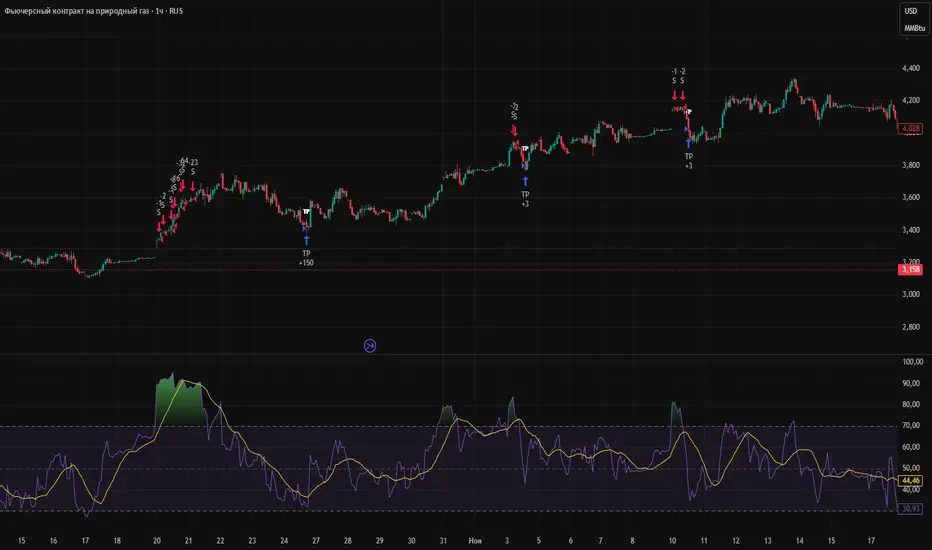
RSI + martingaleТорговая стратегия основанная на совмещении торговой системы Мартингейл и индекса относительной сила RSI. Скрипт входит в сделку после пересечения заданных уровней перекупленности и перепроданности RSI. Набирает позицию, по умолчанию умнажая размер каждой докупки x2. Закрывается по тейк-профиту. A trading strategy based on combining the Martingale trading system and the Relative Strength Index (RSI). The script enters the trade after crossing the set overbought and oversold levels of the RSI策略由sich1111提供54
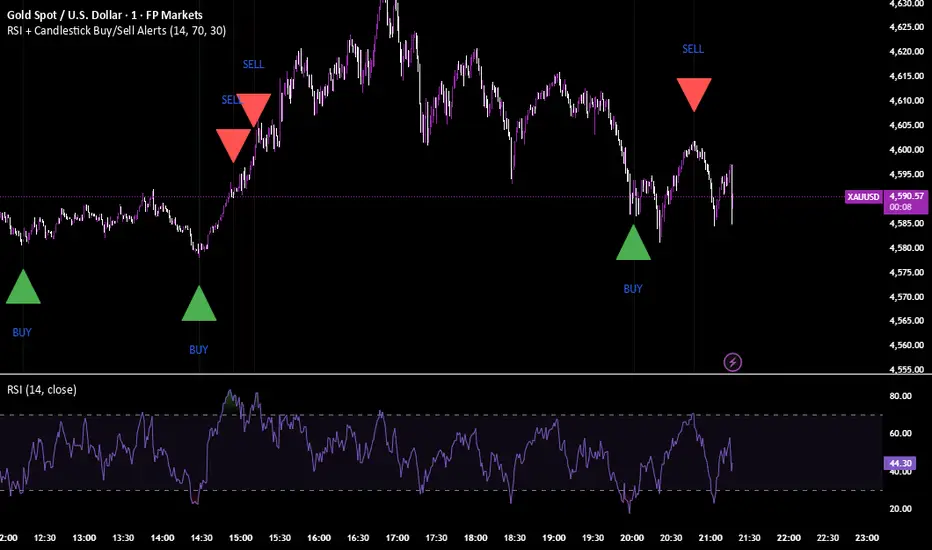
Leotin ScalperThis is a quick scalping indicator. Mostly used on the 1 minute timeframe. It uses the RSI on the 14 period with 30 and 70. When it crosses the 70 line it and a hanging man or shooting star candle forms, it will give a sell indication. when crossing the 30 line and a hammer or inverted hammer is formed it will give a buy indication.指標由TianLombaard提供已更新 132
AlgoYields - AAlgoYields A — Everyday Overlay for Clean, Actionable Context Please follow — more indicators & ideas coming soon! Equipped with alerts and customizable styles, this overlay is designed for daily use: attractive look for fast reads, low noise, high signal. It blends a few trusted tools into a single, elegant view so you can track trend, momentum, and breakouts without overcrowding. What’s inside Trading Session Backdrop Quarter-tinted background (distinct color per quarter) for quick m指標由theValleyMan提供124
RSI Divergence Pro Price Overlay High-Prob v6RSI Divergence Pro — Comprehensive Usage Guide 1) What This Indicator Does (in plain English) Goal: Detect high-probability reversal (and optionally continuation) points using RSI divergences, then draw clean visual lines on price (red/bearish, green/bullish) and attach a % Strength label to help you quickly decide if it’s worth trading. Core logic: • Finds confirmed peaks and valleys using ta.pivothigh and ta.pivotlow. • Bearish: Price makes Higher High while RSI makes Lower High. • Bullish: Pr指標由FXMAFIA20提供269
VIXO - VIX OscillatorVIXO (VIX Oscillator) is a volatility oscillator built from the CBOE Volatility Index (symbol: TVC:VIX). It helps visualize volatility regime shifts by combining a smoothed VIX RSI with a normalized VIX momentum component, plus a VIX histogram that becomes more/less prominent depending on how far VIX is from its moving average. It helps you assess whether market conditions may be approaching rare but powerful squeeze phases. WHAT THIS INDICATOR PLOTS 1) VIX RSI (cyan line) - RSI is calculate指標由emreiletrade提供34
Multi-timeframe RSI & Stochastic dashboard with visual gradient █ OVERVIEW The MTF RSI + Stochastic Dashboard displays RSI and Stochastic values across 6 customizable timeframes in a compact, visual format. Instead of switching between charts or opening multiple indicator windows, see all your momentum data at a glance. This indicator combines two of the most popular oscillators (RSI and Stochastic) and shows you where they agree—and where they don't. █ FEATURES - 6 Customizable Timeframes — Default: 1m, 5m, 15m, 1H, 4H, Daily (fully adjustable) - Combi指標由XrayTrade_com提供57
MDZ Strategy v4.2 - Multi-factor trend strategyWhat This Strategy Does MDZ (Momentum Divergence Zones) v4.2 is a trend-following strategy that enters long positions when multiple momentum and trend indicators align. It's designed for swing trading on higher timeframes (2H-4H) and uses ATR-based position management. The strategy waits for strong trend confirmation before entry, requiring agreement across five different filters. This reduces trade frequency but aims to improve signal quality. Entry Logic A long entry triggers when ALL of策略由VolForge提供已更新 41
Trend Harmony🚀 Trend Harmony: Multi-Timeframe Momentum & Trend Dashboard Trend Harmony is a sophisticated multi-timeframe (MTF) analysis tool designed to help traders identify high-probability setups by spotting "Market Harmony." Instead of flipping through charts, this indicator synthesizes RSI momentum and EMA trend structures from four different time horizons into a single, intuitive dashboard. 🔍 How It Works The core philosophy of this indicator is that the most powerful moves happen when short-ter指標由ebecihalil提供77
AlphaStrike: Zen ModeDescription: 1. The Philosophy: Reducing Cognitive Load Modern charts are often cluttered with dozens of noisy lines (Bollinger Bands, Moving Averages, Oscillators) that lead to "Analysis Paralysis." This script is designed with a "Zen" philosophy: P rocess the complexity in the background, but display only the decision. This is not a simple indicator overlay. It is a Risk-Based Trading Engine that runs multiple validation checks (Momentum, Volatility, and Price Action) simultaneously but 指標由KIRI7077提供157