Fractal Memory Strategy [Jayadev Rana]Fractal Memory Strategy trades the same engine as the Fractal Memory Projection indicator: it looks for the historical episode most similar to current price action, and only takes trend flips that agree with how that episode played out. Exits scale out at three volatility-adaptive targets.
HOW IT DECIDES
An ATR trailing stop tracks the trend. When it flips, the last 30 closes are converted to normalized log returns and compared against past windows by mean squared distance. The bars that followed the best analog give a net direction; the flip is only traded when the analog direction agrees (the filter can be disabled). Orders are processed on bar close, so no lookahead is involved. For visual context the strategy also draws the 50-candle ghost projection beyond the last bar - it is display-only and never affects order logic.
ENTRIES AND EXITS
On a confirmed bullish flip with agreement the strategy closes any short and enters long; the mirror applies to shorts. One unit of risk R equals ATR times (1.2 plus the ATR percentile rank over 200 bars), so targets and stops widen in volatile regimes and tighten in quiet ones. Position exits: one third at 1R, one third at 2R, the remainder at 3R, with a stop at 1.5R (all adjustable). Direction can be restricted to long-only or short-only.
PROPERTIES USED IN THE PUBLISHED BACKTEST
10,000 initial capital, 10 percent of equity per trade, 0.01 percent commission per order, 2 ticks slippage, no pyramiding, orders on close. These are deliberately conservative; adjust them to match your own broker before drawing any conclusion.
PANEL
Match similarity, volatility regime, forecast direction, closed trade count and win rate.
NOTES
The analog projection is a statistical reference, not a prediction, and past behaviour does not guarantee anything about the future. Results vary by symbol and timeframe; test on your own market with realistic costs before considering any live use. This is an educational tool, not financial advice. 策略

Fractal Memory Projection [Jayadev Rana]Fractal Memory Projection searches price history for the moment that most resembles the present, then shows what happened next - drawn on your chart as 50 lighter ghost candles ahead of the current bar - together with trend-flip BUY and SELL signals and volatility-adaptive targets.
HOW THE FORECAST WORKS
The last 30 closes are converted to normalized log returns (the pattern window). The script scans up to 750 past bars and scores every historical window of the same length by mean squared distance, so the comparison is about the shape of movement, not price level. The bars that followed the best match are replayed forward from the current close, rescaled by the ratio of current ATR to ATR at the match, and drawn as 50 semi-transparent ghost candles beyond the last bar. The panel reports the match similarity, how many bars ago it occurred, and the net forecast direction.
The projection is a statistical analog - a look at how the most similar past episode unfolded - not a prediction or a guarantee. It is display-only and never affects historical values, so nothing repaints.
BUY AND SELL SIGNALS
An ATR trailing stop tracks the trend. When it flips direction, a BUY or SELL label prints - by default only when the ghost-candle forecast agrees with the flip direction (toggle available). Alerts are included for both signals.
VOLATILITY-ADAPTIVE TARGETS
Target spacing is not fixed. A unit of risk R equals ATR multiplied by (0.8 + ATR percentile rank over 200 bars), so quiet markets produce tighter targets and volatile markets produce wider ones. Each signal sets TP1, TP2 and TP3 at 1R, 2R and 3R and a stop loss at 1.2R (adjustable). Only the most recent trade's levels are kept on the chart to stay clean.
PANEL
Match quality percent, bars since the match, volatility regime (Low, Normal, High), forecast direction, and current trend side.
SETTINGS
Pattern window, scan depth, forecast length, ghost candle colors, ATR length, trail multiplier, forecast-agreement filter, stop multiplier, and panel position are all configurable.
NOTES
Works on any symbol and timeframe with enough history (at least scan depth plus forecast length bars). This is an analysis tool, not financial advice. Test on your own data and manage risk before trading. 指標

Cardwell Dual Confluence [MarkitTick]💡 A comprehensive momentum and trend-following framework built to identify high-probability market shifts. By synthesizing Andrew Cardwell's established Relative Strength Index (RSI) range rules with dynamic trend filtering and volatility metrics, this tool provides a unified analytical engine. It moves beyond standard oscillator readings to map the underlying momentum regime, ensuring that signals are structurally aligned with the dominant trend.
● ✨ Originality and Utility
Traditional momentum oscillators often produce premature reversal signals during strong trends, leading to false entries in directionless markets. This indicator solves that problem by integrating a dual-tier confluence model. It does not rely solely on an isolated RSI moving average crossover; instead, it demands structural validation through Cardwell's defined momentum ranges.
The primary utility lies in its objective structural filtering: a momentum cross is only validated if the broader market regime structurally supports the direction of the momentum.
By combining a base timeframe momentum cross with a Higher Timeframe (HTF) trend regime and Average Directional Index (ADX) volatility filtering, this tool prevents overtrading in choppy, non-directional environments.
This deliberate combination of an oscillator, a trend filter, and a volatility metric acts as a logical confluence engine. It avoids the pitfalls of disjointed indicator mashups by ensuring every component serves a distinct mathematical purpose in validating the signal before it is printed to the chart.
● 🔬 Methodology and Concepts
The logic engine of this tool evaluates multiple distinct criteria before registering a valid signal.
• Momentum Crossover
The script calculates a base RSI and smooths it using two Running Moving Averages (RMA): a Fast RMA and a Slow RMA. A baseline momentum shift occurs when the Fast RMA crosses the Slow RMA, indicating a localized surge in buying or selling pressure.
• Regime Mapping
A structural trend is evaluated by comparing the closing price to a Simple Moving Average (SMA). Simultaneously, a secondary RSI is evaluated against Cardwell's defined structural ranges. A Bullish Regime requires the price to be above the SMA and the RSI to hold within a specific upper tier (defaulting to 40-80). A Bearish Regime requires the price to be below the SMA and the RSI to hold within a lower tier (defaulting to 20-60).
• Confirmation and Confluence
Regimes must persist for a user-defined number of consecutive bars to filter out transient market noise. Confluence is achieved when an RMA momentum crossover occurs within a tight, predefined window of a regime shift, ensuring both immediate momentum and the structural trend are perfectly aligned.
• Higher Timeframe and Volatility Verification
An optional HTF module checks the regime state of a larger timeframe using a strict non-repainting historical offset. Furthermore, the ADX is calculated to measure pure trend strength. If the ADX is below the user-defined minimum threshold, the market is deemed too choppy, and all signals are suppressed.
• Dynamic Trade Architecture
Once a signal is validated strictly on a confirmed bar close, the script projects dynamic Stop Loss and Take Profit levels using a multiplier of the Average True Range (ATR), actively adapting the trade geometry to current market volatility.
● 🔍 Deconstruction of the Underlying Scientific and Academic Framework
The analytical foundation of this tool rests on advanced momentum physics and statistical distribution theories.
• Cardwell RSI Range Theory
Developed by Andrew Cardwell, this theory posits that the Relative Strength Index is not merely an overbought/oversold oscillator, but a powerful trend-identifying metric. In a mathematically robust uptrend, the RSI establishes a baseline support near the 40 level and frequently reaches 80. Conversely, in a downtrend, it establishes resistance near 60 and drops to 20. The indicator algorithmically enforces these limits to objectively classify market environments.
• Running Moving Average (RMA) Dynamics
The script utilizes the RMA, also known as the Modified Moving Average (MMA) or SMMA, to smooth the RSI base. The RMA applies an exponential smoothing weight defined exactly as 1 / length . This specific mathematical weighting retains a longer memory of past data compared to a standard SMA, preventing the abrupt drop-offs that occur when large data points exit a simple moving average window. This makes the RMA crossover highly sensitive to genuine shifts in cumulative momentum without the lag of a standard exponential moving average.
• Average Directional Movement Index (ADX)
Created by J. Welles Wilder, the ADX quantifies trend strength independent of directional vector. By calculating the smoothed moving averages of the +DI and -DI directional movement indicators, the ADX isolates the absolute magnitude of price expansion. The script uses this mathematical isolation to construct an absolute threshold; requiring ADX to exceed a base level ensures that the statistical probability of trend continuation is mathematically viable before capital is exposed.
• Volatility-Scaled Projection (ATR)
Take profit and stop loss coordinates are mapped using Wilder's Average True Range. The ATR measures the greatest of the current high minus the current low, the absolute value of the current high minus the previous close, and the absolute value of the current low minus the previous close. By scaling targets using ATR multipliers, the tool shifts from fixed-point geometry to dynamic, standard-deviation-aligned targeting, ensuring targets expand during high volatility and contract during consolidation.
● 🎨 Visual Guide
The tool employs a clean, visually dynamic chart interface to transmit complex data instantly without cluttering the workspace.
• Heatmap Candles
Candle bodies and wicks are dynamically colored based on the active regime. Teal indicates a confirmed Bullish Regime, Red indicates a Bearish Regime, and Gray indicates a Neutral market state.
• Signal Labels
When all confluence parameters are met on a confirmed bar close, a solid blue "BUY" label appears below the bar, or an orange "SELL" label appears above the bar, complete with strict execution markers.
• Dynamic Trade Levels
Upon signal generation, the tool plots projected trade levels extending to the right of the price action. A solid Red line indicates the Stop Loss threshold. A dashed Blue line denotes the Entry price. Dashed Teal lines represent Take Profit 1, 2, and 3. Labels accurately print the precise price levels directly on the chart axis.
• Risk and Reward Fills
A semi-transparent Red linefill is plotted between the Entry and Stop Loss lines to visualize risk exposure, while a Teal fill between Entry and TP3 visualizes the total projected reward structure, allowing for instant visual evaluation of the trade setup.
• Integrated Dashboard
A comprehensive table is positioned on the chart, displaying real-time operational metrics. It details the current Cross Trend, Regime State, Confirm Bar count, Signal Gap status, Last Signal source, Trade Status, live ATR value, TP3:SL ratio, and HTF/Chop Filter states in an easy-to-read grid.
● 📖 How to Use
Deploying this tool requires patience and strict adherence to structural confirmation.
Wait for the Heatmap Candles to shift from Gray (Neutral) to Teal (Bullish) or Red (Bearish). This indicates that the broader moving average trend and the internal RSI ranges have aligned into a confirmed structural regime.
Observe the chart for a printed BUY or SELL label. This confirms that the RMA momentum cross has achieved mathematical confluence with the active regime within the defined allowable window.
Check the Dashboard to ensure the HTF Regime and Chop Filter (ADX) read as PASS. If the market is blocked by the Chop Filter, do not force an entry, as the statistical probability of a sustained run is low.
Upon entry, utilize the plotted ATR lines to structure your risk. Place your stop loss exactly at the solid red line, and scale out of your position at the dashed TP1, TP2, and TP3 levels as price action develops.
Wait for the Signal Gap cooldown period to elapse before considering consecutive entries in the same direction. This engineered delay prevents overexposure during erratic, volatile spikes.
● ⚙️ Inputs and Settings
The script features highly customizable parameters grouped logically for maximum workflow efficiency.
• Core Settings
Adjust the lengths for the Cross RMA (Fast/Slow) and the primary RSI source. Modify the Trend MA length and explicitly set the boundaries for the Bull Range (default 40-80) and Bear Range (default 20-60). Configure the Confluence Window to define exactly how close a cross and regime shift must occur to trigger a valid signal, and set the Signal Gap cooldown timer.
• Filters
Toggle the HTF Confirmation logic and select the desired higher timeframe for broader structural alignment. Enable the ADX Chop Filter and set the minimum required trend strength to strip out low-probability environments.
• Trade Tools
Define the ATR lookback length and customize the specific multipliers for the Stop Loss and the three Take Profit targets to match your unique risk-to-reward requirements. Modify the Line Extend Bars input to control how far into the future the trade levels are drawn.
• Visuals and Dashboard
Toggle individual visual components, including candle coloring, signal labels, and trade level plotting. Position the dashboard to any corner of the chart to prevent the obstruction of live price action.
• Alerts
Input specific JSON string payloads for Long, Short, Close Long, Close Short, SL, and TP actions. This allows the indicator to integrate seamlessly with automated execution platforms or third-party webhooks without requiring manual code modifications.
⚠️ Disclaimer
All provided scripts and indicators are strictly for educational exploration and must not be interpreted as financial advice or a recommendation to execute trades. We expressly disclaim all liability for any financial losses or damages that may result, directly or indirectly, from the reliance on or application of these tools. Market participation carries inherent risk where past performance never guarantees future returns, leaving all investment decisions and due diligence solely at your own discretion. 指標

指標

Regime-Conditional Correlation [RC Tools]RC Tools — Regime-Conditional Correlation
─────────────────────────────────────────────────────────────
█ OVERVIEW
Plain rolling correlation between two assets is well-covered ground. The angle here: correlation is not a constant — it changes with the market regime. This tool computes rolling correlation against a second symbol of your choice and buckets it by the same regime framework as the Regime Classifier, so you can see whether a correlation you're relying on actually holds up across market conditions, or only shows up in one of them.
█ WHAT IT DOES
Plots rolling correlation (Pearson, default 20-bar window) between the current chart's symbol and a compare symbol you choose. Colours the background by the current market regime (Trending — Expansion/Exhaustion, Ranging — Quiet/Volatile), using the identical directionality × volatility-percentile logic as the Regime Classifier. A table shows the current regime and correlation, plus the average correlation, its standard deviation, and the sample count for each of the four regimes historically.
█ THE THEORY BEHIND IT
A single "the correlation is 0.8" number hides a lot. Two assets can be tightly linked during calm trending markets and decouple completely during volatile chop — or vice versa. Regime-conditioning the correlation surfaces that structure instead of averaging it away. This matters directly for anything relying on a stable cross-asset relationship: hedges, pairs, or diversification assumptions that quietly break exactly when you need them most (in the volatile regime).
█ HOW IT IS CALCULATED
CORRELATION: standard Pearson correlation between the current symbol's close and the compare symbol's close (fetched via request.security on the same timeframe), over a rolling window (default 20 bars).
REGIME: identical to the Regime Classifier — Efficiency Ratio for directionality, percentile-ranked realised volatility for volatility state, crossed to give four states. Regime is measured on the CURRENT chart's own price action, not the compare symbol. See the Regime Classifier's description for the full methodology.
The correlation reading and the regime are both "as of now" — contemporaneous — so unlike the Regime Classifier's forward-return table, no forward-looking attribution is needed here: each confirmed bar's correlation is added directly to the running average for whichever regime was active on that same bar.
█ SETTINGS & CONFIGURATION
• Compare Symbol (default BTCUSD) — the second asset to correlate against
• Correlation Length (default 20 bars)
• Regime settings mirror the Regime Classifier exactly (Efficiency Ratio lookback, directionality threshold, realised vol lookback, percentile window, volatility percentile threshold) — keep these in sync if you run both indicators together
• Paint Main Chart Background — off by default; enable on only one of the two indicators if running both, to avoid overlapping backgrounds
█ HOW TO USE IT
Check whether a correlation you're relying on is regime-dependent before trusting it. Example: if a hedge shows strong negative correlation in Ranging — Quiet but the average correlation flips or weakens in Ranging — Volatile, that hedge may not protect you exactly when volatility spikes. Always check the sample count (N) per regime before drawing conclusions — a regime with few historical bars hasn't been tested enough to trust its average.
█ LIMITATIONS
• Correlation is measured over a short rolling window and is noisy by nature — it will swing even when the underlying relationship is stable.
• The compare symbol is fetched via request.security on the same timeframe; illiquid symbols, different exchange sessions, or timezone misalignment can introduce lag or missing values.
• Regime classification carries the same caveats as the Regime Classifier: it is backward-looking by construction, unstable near threshold boundaries, and needs substantial history to be reliable.
• Per-regime correlation statistics accumulate only from where the chart's loaded history begins — early sample counts are small and not yet statistically meaningful.
• This script does NOT repaint. All classification and correlation display values update on confirmed bar close only.
█ DISCLAIMER
For educational and informational purposes only. Nothing here is financial advice. Past correlation between any two assets does not indicate future results. Trade at your own risk.
指標

指標

MRB Cycle Oscillator Alpha**Overview**
The "MRB Cycle Oscillator Alpha" is a highly advanced, multi-dimensional momentum and trend-analysis tool. It is not just another MACD; it upgrades traditional momentum concepts by combining Triple Exponential Smoothing (TES), mathematically derived momentum "Cycle Candles," RSI-confluent Bollinger Bands, and an ADX/DMI-driven background. This provides traders with a unified dashboard for trend direction, momentum strength, and mean-reversion zones without cluttering the main chart.
**What makes it original? (Core Concepts)**
This script brings originality to the Community Scripts by fusing several independent mathematical concepts into a single cohesive oscillator:
1. **TES-MACD (Triple Exponential Smoothing):** Instead of standard EMAs, this indicator calculates the MACD utilizing a custom Triple Exponential Smoothing (TES) algorithm. This significantly reduces market noise and lag compared to a traditional MACD.
2. **Momentum Cycle Candles:** Instead of displaying a raw oscillator line, the script extracts the open, high, low, and close values directly from the TES-MACD's historical delta. It then applies a custom smoothing algorithm to generate "Cycle Candles." This unique transformation visualizes momentum shifts and trend persistence much more clearly than a standard line or histogram.
3. **RSI-Dynamic Bollinger Bands:** Bollinger Bands are applied directly to the oscillator (users can choose to base it on the MACD Line EMA or the Signal Line TES). Furthermore, the outer bands dynamically change color based on the traditional chart's RSI values (e.g., turning green when RSI is overbought, red when oversold). This provides a dual-confirmation for extreme conditions.
4. **ADX/DMI Background Matrix:** The indicator calculates ADX and ±DI in the background. If the ADX crosses a user-defined threshold, the chart background changes color based on the dominant DI (green for uptrends, red for downtrends). This acts as a macro-trend filter.
**How to use it**
* **Trend Confirmation:** Use the background color (driven by ADX/DMI) to filter your trades. Only look for long setups when the background is green, and short setups when red.
* **Momentum Shifts:** Watch the color and body of the Cycle Candles in the oscillator pane. A transition from red to green indicates a shift to bullish momentum.
* **Overextended Zones (Mean Reversion):** When the Cycle Candles pierce the outer Bollinger Bands, AND the bands themselves change color (triggered by RSI extremes), it signals a highly overextended market, warning of a potential reversal or pullback.
**Customization**
Every element is modular. Traders can disable the Cycle Candles view in favor of a standard line, toggle the Bollinger Bands, adjust the RSI thresholds for band coloring, and fine-tune the ADX/DMI periods for background filtering. 指標

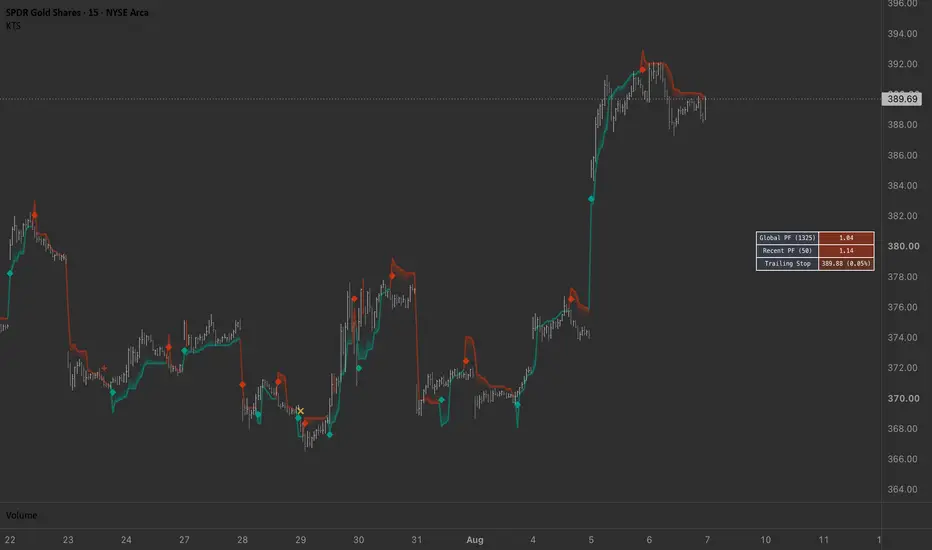
Kalman Trailing Stop (KTS)█ OVERVIEW
The Kalman Trailing Stop (KTS) is an advanced, math-driven trend-following system designed to keep you in winning trades longer while dynamically filtering out market noise.
Instead of relying on static moving averages or basic ATR multipliers, KTS utilizes a 2D Kalman Filter combined with Statistical Digital Signal Processing (DSP) and Williams Market Structure. It adapts to volatility and volume in real-time, effectively distinguishing between genuine trend shifts and temporary liquidity sweeps.
█ CORE MECHANICS
1. 2D Kalman Adaptive Trailing Stop
At the heart of the indicator is a robust 2D Kalman filter that tracks both price level and velocity.
Volume-Weighted Variance: The trailing stop becomes highly responsive during high-volume pushes (high trust) and flattens out during low-volume consolidation (low trust), preventing premature stop-outs.
Sigmoid Smoothing & Structural Anchoring: Instead of jagged, abrupt jumps, the stop uses sigmoid transitions to smoothly glide to new structural floors/ceilings derived from recent Intermediate-Term Highs and Lows (ITH/ITL).
Slope Confirmation: The trailing stop will only flip its directional bias if the underlying Kalman baseline slope confirms the reversal, neutralizing fake-outs.
2. Statistical Plunger Logic (Liquidity Sweeps)
Markets frequently sweep liquidity beyond technical levels before reversing. The "Plunger" logic mathematically identifies these traps.
Dynamic Sweep Multiplier: By tracking the kurtosis (fat-tail distribution) of price returns, the script dynamically expands its sweep threshold during periods of wild volatility.
Wick Filtering: It detects deep wicks that pierce the Kalman bands and close strongly back within the bar's range, highlighting statistically validated exhaustion points.
3. Algorithmic Pyramiding & Volatility Warnings
Scale-In Detection: KTS monitors volume footprints to identify safe zones to add to your position. It looks for a sequence of volume "dry-up" during a pullback, followed by a volume-backed breakout past recent market structure.
Livermore Ejector Concept: The indicator flags abnormal, massive range expansions that occur against the prevailing trend, acting as an early warning system for sudden momentum shifts.
4. Built-in Risk & Performance Engine
Dynamic Position Sizing: Automatically calculates raw position and pyramid sizes based on your account equity, risk percentage, and maximum leverage.
Live Performance Dashboard: A built-in HUD tracks both the Global and Recent Profit Factor (PF) of the main trend signals, alongside the real-time distance to your trailing stop.
█ VISUAL GUIDE
Colored Gradient Band: The main Kalman Trailing Stop. Green indicates an active long trend; Red indicates an active short trend.
Large Diamonds (♦️): Main Trend Entries. Triggered when price breaks the Kalman Stop with slope confirmation.
Small Triangles (🔼/🔽): Bullish and Bearish Plunger signals. These indicate deep liquidity sweeps and wick rejections at statistical extremes.
Small Crosses (➕): Algorithmic Pyramid signals. Opportunities to scale into the current trend based on volume dry-ups and structural breakouts.
Yellow X-Crosses (❌): Abnormal Reaction Warnings. Signals a massive volatility spike moving against your active position.
█ SETTINGS
Kalman Trailing Stop Settings
Kalman Responsiveness: Adjusts how quickly the system reacts to price changes (1-100).
Trailing Stop Distance (SD): Sets the baseline width of the trailing stop from the Kalman-smoothed price, measured in standard deviations of the True Range. A higher value (e.g., 3.0) gives the trade more breathing room, while a lower value tightens the stop.
Disclaimer
This script is designed for educational and informational purposes only. Trading involves significant risk. The built-in performance table is an un-optimized raw calculation and should not be used as a guarantee of future system profitability. 指標

Daily ATR Big Move DetectorDaily ATR Big Move DetectorThis indicator identifies significant intraday price moves relative to the Daily ATR (14).It automatically detects both bullish surges and bearish drops on your current chart timeframe (ideal for 5m, 15m, 30m charts) when a candle’s range exceeds 20% of the Daily ATR.Key Features:Highlights candles that represent 20%+ of the Daily ATR
Labels each qualifying candle with the exact percentage (e.g. “22.45% of Daily ATR”)
“Manipulation Candle” label automatically appears on moves ≥ 25% of Daily ATR
Color-coded:Green tones for bullish moves
Red/purple tones for bearish moves
Shows current Daily ATR value and candle percentage in a clean table
Works on any symbol (stocks, ETFs, futures, crypto, etc.)
Perfect for spotting potential manipulation moves, exhaustion candles, or high-conviction intraday momentum.Recommended Timeframes: 5min, 15min, or 30min charts (using Daily ATR as reference).
指標

SMI + Bollinger Bands## SMI + Bollinger Bands
SMI + Bollinger Bands is an overlay indicator that projects the Stochastic Momentum Index directly into the price space defined by Bollinger Bands.
Traditional SMI indicators are displayed in a separate oscillator pane. This script instead transforms the SMI value into a price-relative flow line, allowing momentum, volatility, and price structure to be viewed together on the main chart.
### Core concept
The indicator calculates two related systems:
1. A standard Bollinger Band structure based on a configurable moving average and standard deviation.
2. A double-smoothed Stochastic Momentum Index calculated from the relationship between the closing price and its recent high-low range.
The SMI is then normalized using the selected SMI Threshold and projected around the Bollinger basis:
* An SMI value equal to the positive threshold aligns with the primary upper Bollinger Band.
* An SMI value equal to the negative threshold aligns with the primary lower Bollinger Band.
* Values between the thresholds appear inside the primary Bollinger range.
* Momentum exceeding the threshold can extend beyond the primary bands and into the optional extended-band zones.
This projection makes it possible to compare momentum behavior directly with current price and volatility rather than interpreting an oscillator in a separate pane.
### Plotted elements
**Bollinger basis**
The center line of the Bollinger structure. The moving-average type can be selected from SMA, EMA, SMMA/RMA, WMA, or VWMA.
**Primary Bollinger Bands**
The upper and lower volatility boundaries calculated from the selected standard-deviation multiplier.
**Extended Bollinger Bands**
Optional outer volatility zones using a separately configurable standard-deviation multiplier. These areas can help visualize unusually extended price or momentum conditions.
**SMI Flow**
The yellow line represents the projected Stochastic Momentum Index. Its position shows where momentum currently sits relative to the Bollinger structure.
**SMI Flow-Base**
The white line is an EMA-smoothed version of the projected SMI Flow. It provides a slower reference line that can be used to observe momentum direction, compression, expansion, and crossings.
### Inputs
**Bollinger Band settings**
* Length: Lookback period used for the Bollinger basis and standard deviation.
* Basis MA Type: Moving-average calculation used for the basis.
* Source: Price source used for the Bollinger calculations.
* StdDev: Multiplier used for the primary Bollinger Bands.
* Extended StdDev: Multiplier used for the optional outer bands.
* Use Extended Bands: Enables or disables the extended volatility zones.
**SMI settings**
* %K Length: Lookback period used to determine the recent high-low momentum range.
* %D Length: Double-EMA smoothing applied during the SMI calculation.
* EMA Length: Smoothing applied to the projected SMI Flow-Base line.
* SMI Threshold: Defines which positive and negative SMI values align with the primary upper and lower Bollinger Bands.
### General interpretation
The indicator is intended as a visual analysis framework rather than a standalone entry system.
Traders may use it to study:
* Momentum changes relative to volatility.
* SMI Flow and Flow-Base crossings.
* Momentum expansion beyond the primary bands.
* Momentum rejection from extended zones.
* Divergence between price movement and projected momentum.
* Compression around the Bollinger basis.
* Confluence with trend, structure, volume, support, resistance, or other analysis.
A movement outside a band does not automatically indicate a reversal. Strong trends can remain extended, and crossings can occur repeatedly during sideways or volatile conditions. Market context and risk management remain necessary.
### Calculation behavior
This script does not use future data, lookahead calculations, or higher-timeframe requests. Values on the active candle may continue changing as the candle’s high, low, and close update. Historical values are finalized after their respective candles close.
### Disclaimer
This indicator is provided for research, education, and chart analysis. It does not provide guaranteed trade signals, financial advice, or predictions of future market performance. Users are responsible for independently evaluating all trading decisions and managing their own risk.
指標

Market Regime Engine [NQ Labs] WHAT THIS ANSWERS
Almost every indicator tells you WHAT the market is doing. Very few tell you
whether the current market has enough exploitable structure to be worth
risking money on at all. The Market Regime Engine is built for that second
question: should I be trading this right now, and if so, what style of
approach do current conditions actually favour?
It is not a signal generator. It produces no entries. It is a filter you run
underneath whatever you already trade.
WHY IT IS BUILT THIS WAY
Two design decisions separate this from a conventional regime or trend filter.
1. EVERY AXIS IS PERCENTILE-RANKED AGAINST ITS OWN HISTORY.
Most regime tools use fixed thresholds - an ADX of 25, an ATR multiplier of 3.
Those numbers are calibrated to whatever the author tested on. They are the
reason a tool behaves sensibly on one instrument and nonsensically on the
next. Here, each axis is ranked against its own recent distribution on the
current symbol and timeframe, so a 65th-percentile reading carries the same
meaning on a crypto pair as it does on an FX major. Nothing needs retuning
per market.
2. THE THREE AXES ARE ORTHOGONAL BY DESIGN.
Many "confluence" tools stack three views of momentum and present the
agreement as confirmation. Correlated inputs agreeing is not evidence. These
three measure genuinely different properties:
DIRECTIONAL EFFICIENCY - net distance travelled divided by the total path
walked to get there. A value near 1 is a straight line. A value near 0 means
price ended where it started after a great deal of work. This is the most
direct available answer to "is there a trend here", and it is independent of
direction.
VOLATILITY STATE - ATR ranked against its own history. Not "is volatility
high" in absolute terms, but "is volatility high for this instrument".
RETURN PERSISTENCE - lag-1 autocorrelation of log returns. Positive means an
up bar tends to be followed by an up bar, so momentum approaches have
something to work with. Negative means the market reverts. Near zero means
returns carry no usable memory.
THE SCORING LOGIC
The Tradeability Score (0-100) rests on one idea:
Efficiency is the signal. Volatility is the cost of being wrong.
Volatility only hurts you when there is no direction to exploit.
So the noise penalty is the product of how little direction exists and how
violent the market is. It approaches zero inside a strong trend no matter how
wild conditions get - because volatility inside a trend is opportunity, not
noise - and it peaks precisely where traders are most reliably ground down:
low efficiency combined with high volatility. That specific combination is
what the engine exists to flag.
THE FIVE REGIMES
TREND Efficiency high. Directional. Follow it.
VOLATILE CHOP Efficiency low, volatility high. No direction, maximum cost
of being wrong. The state that does the damage.
COIL Efficiency low, volatility low. Compression. Wait.
RANGE Efficiency low, volatility middling. Edges are tradeable.
TRANSITION Efficiency mid-range. No clean read. Reduce size.
A raw regime read must hold for a configurable number of consecutive bars
before it is confirmed. Without that filter, readings that straddle a
threshold flip back and forth for single bars.
REGIME MATURITY - THE PART I HAVE NOT SEEN ELSEWHERE
The engine records the length of every completed regime run on the current
chart and reports the current run against that learned baseline, together with
the sample size behind it.
A trend at 0.3x its typical duration and a trend at 2.4x are not the same
trade, even though every conventional indicator prints the identical reading
for both. A compression that has lasted three times longer than compressions
normally last on this instrument is a different proposition to one that
started six bars ago.
The sample size (n=) is shown deliberately. Below the configured threshold the
cell dims, because a baseline built from two observations is not evidence and
should not be dressed up as though it were.
HOW TO USE IT
The engine is a gate, not a trigger. The intended workflow:
1. Read the Verdict first. STAND DOWN means your edge, whatever it is, is
probably not present. The most valuable output of this tool is the trades
it talks you out of.
2. Read the Regime and Favoured Style. Trend-following systems belong in
TREND. Mean-reversion belongs in RANGE, and only when Persistence confirms
the market is actually reverting rather than merely quiet. COIL means the
setup has not arrived yet. VOLATILE CHOP means nothing you own works here.
3. Read Persistence before choosing an approach. If it reads Random, the
market has no memory to exploit in either direction, and both momentum and
mean-reversion are coin flips.
4. Use vs Typical for position management, not entry. An extended regime is
not a reversal signal. It is a reason to stop adding and to tighten what
you already hold.
5. Let the ribbon and score do the work on the price chart. The dashboard can
be forced onto the main pane so the engine occupies a pane without costing
you chart real estate.
SETTINGS THAT ACTUALLY MATTER
RANKING LOOKBACK is the important one. It must span several complete regime
cycles on your timeframe or every axis will rank near the middle and
everything will read TRANSITION. 250 bars on a daily chart is roughly a year -
a real baseline. 250 bars on a 5-minute chart is under a day, and is not.
On intraday timeframes, raise it substantially.
MINIMUM REGIME RUN trades responsiveness for stability. Higher values give a
calmer read and a cleaner duration baseline at the cost of confirming changes
later. Set it to 1 to see the unfiltered classification.
CHOP PENALTY controls how hard low-efficiency volatility is punished. Set it
to 0 and the score becomes pure efficiency rank.
EFFICIENCY and VOLATILITY thresholds are percentiles, not raw values. They do
not need adjusting per instrument. That is the point.
LIMITATIONS - STATED PLAINLY
- This is a lagging, descriptive tool. It classifies conditions that have
already formed. It does not forecast, and it cannot tell you a regime is
about to end.
- Confirmation costs lag. A genuine regime change registers a few bars late by
design. That is the price of not flickering.
- The maturity baseline is learned from visible chart history and rebuilds
whenever settings, symbol, or timeframe change. It is not persistent memory.
Early in a chart, or for a rarely-occurring regime, the sample is thin. The
n= value tells you when to discount it.
- On intraday equity charts, overnight gaps inflate ATR and distort the
persistence reading. Daily and above, or extended hours, handle this better.
- Autocorrelation is a weak statistic on short samples. Persistence readings
close to zero should be read as "no information", not as a subtle signal.
- Efficiency is directionless. TREND tells you a trend exists, not which way
it points. Pair it with something that reads direction.
- No regime classification is correct at the moment it matters most, which is
the turn. Nothing here changes that.
This script is open-source. Read the code, disagree with it, improve it.
This is an analytical tool for studying market conditions. It is not financial
advice, and it does not generate trade recommendations. Trading involves risk
of loss. 指標

Luxy UT God Mode - UT-Bot Forecast, Signals, Zones and RiskLuxy UT God Mode turns the classic UT Bot ATR trailing-stop into a complete, self-contained trading cockpit: momentum-adaptive buy/sell signals, a forward-looking Trend Duration Forecast, auto support/resistance zones, a 0-100 Confidence Score, a built-in multi-currency Risk Calculator, and automatic Stop Loss / Take Profit levels - all on one overlay, all non-repainting.
Note: Every forecast, probability, and statistic in this tool is a calculation based on the chart's own historical behavior. They describe past patterns, not guaranteed future results.
WHAT MAKES THIS DIFFERENT
A normal UT Bot only tells you the trend flipped. Luxy UT God Mode answers the three questions a trader actually asks at the moment of a signal:
1. Should I trust this flip? - a Confidence Score (0-100) blends seven engines into one number.
2. How long might this trend run? - a Trend Duration Forecast projects the expected remaining life of the current trend, drawn as a fading strip with survival-probability milestones.
3. What do I risk and how big do I trade? - automatic Stop Loss, R-based Take Profits, and a position-size calculator in your own account currency.
Everything is layered so you can run it bare-bones (just clean signals) or switch on the full "God Mode" stack.
METHODOLOGY AND CREDITS
This indicator implements proven concepts using entirely original code.
- UT Bot ATR trailing logic - original concept by @QuantNomad . This implementation is a significant rework: it adds volume weighting, momentum-adaptive sensitivity, a composite multi-method stop loss, a full multi-filter confirmation stack, multi-timeframe confluence, and the statistical trend-duration engine described below.
Important: this is an educational analysis tool. It does not guarantee any trading result. Always do your own analysis and manage risk.
THE SEVEN ENGINES (and the Confidence Score that fuses them)
Each bar, the script scores how well the current setup aligns and sums it into a single 0-100 Confidence Score with a visual progress bar:
UT Bot direction - is price above/below the momentum-adaptive trailing stop
SuperTrend - direction plus a distance-from-line strength bonus
Market Structure - position inside the recent swing range and structure breaks
ADX Regime - is the market trending (signals allowed) or choppy (blocked)
Multi-Timeframe - does a higher timeframe agree with the signal direction
Volume - is conviction backed by above-average volume
RSI Divergence - is a recent divergence supporting or opposing the signal
Read it at a glance: 80+ = strong, 60+ = good, 40+ = weak, under 40 = very weak. Hover the Confidence cell for the full per-engine breakdown.
1. TREND DURATION FORECAST - the headline feature
When the trend flips, the script projects how many more bars the new trend may last, based on the chart's own past trends.
How it works:
Every completed trend's duration is recorded, kept separately for bullish and bearish trends.
On each new flip the script estimates the expected duration using an exponentially-weighted average and standard deviation (recent trends weighted more heavily).
The estimate is drawn as a fading gradient strip that projects forward from the flip, with a "Trend Analysis" label and survival-probability milestones at 25% / 50% / 75% / 90% / 100% of the projection.
The percentages are empirical - they show the share of past same-direction trends on THIS chart that actually lasted at least that long. Not a fixed textbook curve.
Three forecast modes:
Simple - median duration only. Clean and fast.
Standard - exponentially-weighted average plus spread (recommended default).
Advanced - Standard plus five adaptive multipliers: Structure (proximity to S/R), Asset Type (volatility profile), Flip Strength (volume + filters passed), Error Learning (self-correction from its own past misses), and Regime (trending vs choppy).
When history is thin, the forecast honestly falls back to a combined estimate and flags it, rather than showing false precision.
2. MOMENTUM-ADAPTIVE UT BOT CORE
The trailing stop is not a fixed ATR multiple. The effective sensitivity adapts each bar to:
Momentum - faster momentum widens the trail to stay in strong moves
Relative volume - conviction adjusts the distance
Asset type - auto-detected (crypto, forex, futures, index, fund, CFD, bond, stock) with a per-class multiplier, or set it manually
Volatility mode - Fixed, Dynamic, or Aggressive auto-adjustment to the current volatility regime
The result is a trailing engine that behaves differently on a calm blue-chip than on a volatile small-cap or crypto pair - without you re-tuning it.
3. ANTI-WHIPSAW AND SIGNAL FILTER STACK
Signals only fire when they survive the filters you enable, so you control the trade-off between frequency and quality:
ADX Regime - block signals in choppy, non-trending conditions
Cooldown and Confirmation - minimum bars between signals and N-bar direction confirmation
Swing - only trade aligned with recent swing structure
Full Candle - require the whole candle beyond the trailing line (no straddles)
Volume, RSI, Hull MA, SuperTrend - optional confirmation layers
High-Volatility and % Change - only trade meaningful moves
2-Bar Confirm - extra confirmation for volatile markets
Every active filter appears as a row in the table with a live pass/fail state, so you always know why a flip did or did not become a signal.
4. SUPPORT / RESISTANCE ZONES
The script clusters significant swing pivots into persistent price zones and draws only the two that matter right now: the nearest resistance above price and the nearest support below price. Each zone shows its price and touch count (e.g. "S 4.19 (3x)" = a support tested three times). A level that price has broken through drops off automatically, and an optional Zone Filter can block buys into resistance and sells into support. Pivot strength is adjustable so you can show only major levels.
5. AUTOMATIC STOP LOSS, TAKE PROFIT AND RISK CALCULATOR
On every signal the script draws a complete trade plan:
Stop Loss - choose from seven methods: ATR, % based, tick based, swing, scaled ATR, Smart Adaptive (auto-scales to volatility), or Safer (widest of several).
Take Profit - TP1 / TP1.5 / TP2 / TP3 as R multiples of the stop distance, with optional price and % labels, and a freeze-on-touch check mark for journaling.
Entry line - marks the signal price; all lines can auto-limit to 10 bars for a clean chart.
Risk Calculator - enter account size and risk (% or fixed amount) and it returns the position size in shares/contracts, in your own currency, with live FX conversion (USD, EUR, GBP, JPY, CAD, AUD, CHF) or a manual rate.
6. MULTI-TIMEFRAME CONFLUENCE AND RSI DIVERGENCE
The table shows the trend of up to seven higher timeframes (5m, 15m, 30m, 1H, 4H, D, W) via an EMA 9/21 cross, so you can see whether the bigger picture agrees before you act. An optional MTF filter blocks counter-trend signals. Separately, RSI divergence (regular bullish and bearish) is detected, labeled on the chart, and fed into the Confidence Score.
7. LIVE STATUS TABLE
A configurable dashboard (position and size adjustable) summarizes everything: asset type, Confidence Score, adaptive mode, current signal, win-rate / average-bars statistics, multi-timeframe row, divergence, forecast, position size, and one row per active filter - each with a detailed tooltip.
HOW TO USE IT - QUICK START
Step 1 - Add it and pick your sensitivity. Defaults suit intraday (5-15m). For scalping lower the Sensitivity/ATR; for swing raise them (see the Sensitivity tooltip for presets).
Step 2 - Read a signal. A Buy (aqua, below bar) or Sell (orange, above bar) appears only after the bar closes and all enabled filters pass. Check the Confidence Score and the Multi-TF row for context.
Step 3 - Use the trade plan. The Entry, Stop Loss and Take Profit lines draw automatically. Read the Position row for size. Use the Trend Duration Forecast strip as a realistic hold-time expectation - scale out near the median, reassess if price runs past the projection.
Step 4 - Set alerts. Use "Any alert() function call" to receive BUY/SELL and trend-flip alerts on bar close, or pick the specific "Momentum Buy/Sell Signal" conditions. All alerts fire on confirmed bars only.
TUNING FOR MORE OR FEWER SIGNALS
Too few signals: turn off MTF, then Full Candle, then lower the ADX threshold or the Anti-Whipsaw filter. Too many / choppy: raise the ADX threshold, enable Volume and Full Candle, increase Cooldown, or add 2-Bar Confirm. Every filter is independent and shown live in the table.
TECHNICAL NOTES
Pine Script v6, overlay, max bars back 5000.
No repaint: signals, lines, forecast and alerts are committed on bar close (barstate.isconfirmed); all higher-timeframe data uses lookahead_off.
Works on stocks, crypto, forex, futures and indices, on any timeframe.
Higher timeframes and longer history produce more reliable forecasts; a new symbol needs a number of completed trends before the duration model is meaningful.
LIMITATIONS
Trend-following by nature: signals arrive after a trend establishes, not at exact tops/bottoms.
Best in trending conditions; use the ADX regime and filters to avoid chop.
The duration forecast needs history to become meaningful and is a statistical estimate, never a guarantee.
DISCLAIMER
This script is an educational analysis tool, not financial advice. Trading stocks, crypto, forex and futures involves substantial risk of loss - you can lose all invested capital. Forecasts, probabilities and win-rate statistics are calculated from historical chart data and do not guarantee future performance. Test on paper first, and you are solely responsible for your own trading decisions.
Feedback and suggestions are welcome in the comments. Happy trading.
指標

Institutional Flow MatrixInstitutional Flow Matrix is an open-source market-analysis framework designed to organize trend direction, confirmed market structure, institutional price zones, momentum, and location within a dealing range into one readable chart.
The purpose of this indicator is not to predict every price movement or generate constant entries. It is designed to answer a more practical sequence of questions:
1. What is the current directional bias?
2. Is market structure supporting that direction?
3. Is price trading from a meaningful location?
4. Has price returned to an active institutional zone?
5. Is momentum aligned with the proposed setup?
The script combines these questions into a structured workflow while keeping the default chart intentionally clean.
WHY THIS INDICATOR WAS BUILT
Many market-structure indicators display every swing, imbalance, liquidity level, zone, and signal at the same time. While that information can be useful for detailed analysis, it can also make the chart difficult to interpret during live trading.
Institutional Flow Matrix was built around a visual hierarchy:
* Directional bias is the primary layer.
* Active Order Blocks are the principal reaction zones.
* Momentum is a confirmation layer.
* Premium and Discount provide market location.
* Fair Value Gaps, liquidity pools, sweeps, and higher-timeframe levels are optional study tools.
The default Balanced preset focuses on the information most relevant to a directional pullback setup. Minimal mode removes most supporting visuals for live execution. Full mode reveals the additional market-structure tools for deeper analysis.
WHAT MAKES THE IMPLEMENTATION DIFFERENT
The individual concepts used by this script, including pivots, moving averages, ATR trend filters, Order Blocks, Fair Value Gaps, and Premium/Discount ranges, are established forms of technical analysis.
The original contribution of Institutional Flow Matrix is how those components are synchronized and managed as one decision framework.
Key design elements include:
* Confirmed structure events rather than unconfirmed swing guesses.
* A persistent directional state requiring agreement between structure, EMA alignment, and an ATR-based trend filter.
* Order Block freshness validation before a zone is accepted.
* Separate visual duration and analytical lifetime controls for zones.
* Automatic mitigation and expiration of old zones.
* Limited drawing-object counts to prevent long-term chart clutter.
* A weighted confluence model centered on trend, structure, zone interaction, market location, and momentum.
* Three visual presets that change the information hierarchy without changing the underlying calculations.
* Confirmed-bar signals and event-based alerts.
This is not intended to be a collection of unrelated indicators. Each module has a defined role in the same setup process.
DIRECTIONAL BIAS
The chart background represents the script's confirmed directional state.
A bullish state requires agreement between:
* Bullish market structure.
* Fast EMA positioning above the slow EMA.
* Bullish ATR trend conditions.
A bearish state uses the opposite conditions.
The background changes only after the required conditions are confirmed. A larger BUY or SELL label marks a confirmed change in this directional state.
These shift labels are different from the smaller confluence signals. A shift label identifies a change in directional bias. A confluence signal requires additional location, zone, and momentum conditions.
MARKET STRUCTURE
Confirmed pivot highs and lows form the structure engine.
The script tracks:
* Higher Highs
* Higher Lows
* Lower Highs
* Lower Lows
* Breaks of Structure
* Changes of Character
A bullish break occurs when a confirmed bar closes above the latest unbroken confirmed swing high. A bearish break occurs when a confirmed bar closes below the latest unbroken confirmed swing low.
Swing labels are retrospective by design. A pivot can only be confirmed after the selected number of right-side bars has closed. Once confirmed, its label is placed on the candle where the swing originally occurred. The label was not known on that earlier candle.
ORDER BLOCKS
Order Blocks are the primary reaction zones in the indicator.
After a confirmed structure break or qualifying displacement event, the script searches backward for an opposing candle. A candidate candle can be filtered by:
* Candle range relative to ATR.
* Body size as a percentage of candle range.
* Optional volume expansion.
* Wick-based or body-based zone construction.
Before accepting the candidate, the script checks whether price has already invalidated it. This prevents many stale zones from being created after the fact.
Active Order Blocks can be invalidated by either:
* A close beyond the opposite edge.
* A wick beyond the opposite edge.
The selected mitigation method is used consistently during both zone creation and live zone management.
Order Blocks have separate controls for visual extension and analytical age. This allows users to control how long a box remains visible independently from how long it remains eligible for signal calculations.
PREMIUM, DISCOUNT, AND EQUILIBRIUM
The script creates a rolling dealing range from the highest high and lowest low over the selected lookback.
The range is divided into:
* Premium: the upper portion of the range.
* Discount: the lower portion of the range.
* Equilibrium: the 50% midpoint.
Premium and Discount do not generate trades by themselves. They provide location.
In general:
* Bullish setups receive stronger contextual support in Discount.
* Bearish setups receive stronger contextual support in Premium.
* Equilibrium represents the midpoint of the current rolling range.
Because the range is rolling, its boundaries can change when a new lookback high or low is formed.
MOMENTUM RIBBON
The momentum module uses three exponential moving averages and an ATR-normalized difference between the fast and slow averages.
Bullish momentum requires:
* Fast EMA above the slow EMA.
* Positive normalized momentum.
* Momentum above its signal average.
Bearish momentum uses the opposite conditions.
Diamond markers identify confirmed momentum crossings. The ribbon is intended as confirmation rather than a standalone entry system.
CONFLUENCE SIGNALS
The script calculates a 0-100 Confluence Score from five conditions:
* Directional bias: 25 points.
* Market structure: 15 points.
* Momentum alignment: 15 points.
* Active Order Block interaction: 25 points.
* Premium or Discount location: 20 points.
The score measures condition alignment. It is not a probability, win rate, accuracy estimate, or forecast of future performance.
By default, BUY and SELL signals require:
* Confirmed directional bias.
* Matching confirmed structure.
* Interaction with an active Order Block.
* Correct Premium or Discount location.
* Matching momentum.
* Minimum Confluence Score.
* Completion of the selected signal cooldown.
Signals are displayed only when the complete condition changes from false to true. This prevents repeated labels while the same setup remains active.
OPTIONAL ADVANCED MODULES
Full mode provides additional analytical tools:
* Fair Value Gaps with ATR size filtering.
* Equal-high and equal-low liquidity pools.
* Confirmed liquidity sweeps.
* BOS and CHoCH labels.
* HH, HL, LH, and LL labels.
* Previous day, week, and month highs and lows.
* Optional momentum candle coloring.
These features are disabled or hidden from the default Balanced view to preserve readability.
VISUAL PRESETS
Minimal:
Designed for traders who want the least chart interference. It suppresses the background, ribbon, Premium/Discount display, trailing line, dashboard, and advanced structure annotations.
Balanced:
The default view. It emphasizes directional background, active Order Blocks, Premium/Discount context, momentum ribbon, diamonds, signals, and the dashboard.
Full:
Designed for detailed study. It adds structure labels, BOS/CHoCH events, Fair Value Gaps, liquidity tools, higher-timeframe levels, and optional candle coloring.
FOR NEWER TRADERS
A simple workflow is:
1. Start with the Balanced preset.
2. Use the background to identify the current directional bias.
3. Wait for price to return to an Order Block matching that bias.
4. Check whether price is in Discount for a bullish setup or Premium for a bearish setup.
5. Confirm that the momentum ribbon agrees.
6. Treat the signal as a point for further analysis, not an automatic order.
The equilibrium line can be used as a reference for the midpoint of the current dealing range. It is not automatically an entry or exit instruction.
FOR ADVANCED TRADERS
Experienced users can customize:
* Pivot confirmation sensitivity.
* ATR and EMA trend parameters.
* Wick-based versus body-based Order Blocks.
* Displacement-created zones.
* Candle body, range, and volume filters.
* Close-based versus wick-based mitigation.
* Zone visual duration and analytical age.
* Premium and Discount percentages.
* Fair Value Gap size.
* Liquidity sensitivity.
* Momentum lengths.
* Individual signal requirements.
* Minimum confluence threshold.
* Signal cooldown.
* Higher-timeframe reference levels.
Advanced users can also disable individual hard requirements and use the Confluence Score as a more flexible filtering system.
ALERTS
Alert conditions are included for:
* Break of Structure.
* Change of Character.
* New Order Block.
* BUY signal.
* SELL signal.
* Bias-aligned Order Block entry.
* Trend and momentum confluence.
* Liquidity sweep.
Alerts should be created using Once Per Bar Close when confirmed signals are required.
NON-REPAINTING AND TIMING
Structure breaks, directional shifts, zone creation, zone mitigation, momentum events, and confluence signals are evaluated on confirmed bars.
Pivot-based swing labels require future bars to confirm that a swing occurred. After confirmation, the label is displayed on the original pivot candle. This is delayed confirmation with retrospective placement, not advance knowledge of the swing.
Previous-period levels use completed higher-timeframe data.
LIMITATIONS
* This indicator does not predict future prices.
* It does not calculate position size, stop loss, or account risk.
* It is not a complete automated trading system.
* Signals can fail during volatile, illiquid, or range-bound conditions.
* Rolling Premium, Discount, and equilibrium levels can move when the lookback range changes.
* Confirmed pivots introduce an intentional delay.
* Order Block definitions vary among trading methodologies; this script uses the documented candle-search and filtering rules described above.
* Volume behavior differs across asset classes and data providers.
* Parameter settings that work on one symbol or timeframe may not be appropriate for another.
Suggested starting points are the 15-minute and 1-hour charts for intraday analysis and the 4-hour chart for broader swing structure. Users should test settings on their own symbols and trading sessions.
OPEN-SOURCE PURPOSE
The script is published open-source so traders can inspect the calculations, understand why signals occur, verify the confirmed-bar methodology, and adapt the framework for their own research.
The goal is to provide a readable and transparent market-structure workflow rather than a black-box prediction tool.
DISCLAIMER
This indicator is provided for educational and analytical purposes only. It is not financial advice and does not guarantee profitable results. Historical chart behavior does not ensure future performance. Users are responsible for their own analysis, testing, risk management, and trading decisions.
指標

Price Action Concepts [b1k]Price Action Concepts
everything i actually watch on an intraday chart, in one indicator. built off my Essential Time Ranges and folded in the tools i kept loading separately.
what's inside:
Time ranges — hourly high/low + midpoint, opening range (30s up to 30m, pulled from lower-timeframe data so it's accurate on any chart and extends across RTH), initial balance (9:30-10:30), and the RTH box.
Range metrics — ADR(10), AWR(8), today's day range and this week's range, plus % of each used so you know how much is left in the tank. ADR/AWR projected off the open (open +/- range/2), same read as Quant Matrix.
Value areas — VAH / VAL / POC for the session you choose (RTH or ETH), both TPO and volume profile, plus the last 3 sessions. volume draws as a zone, TPO as lines. also marks TPO single prints and volume imbalances (low-volume nodes) for the fast-move levels.
1kpier levels — overnight high/low, previous day and week high/low, wickless 15m candles, and a reference grid.
HoD/LoD timing — where the high and low of the range printed and how long it took to get there.
Session distributions — the Quant Matrix boxes (each session sized to its own average range, centered on the open) and the distribution table, total or by day of week, points or percent.
built around ES/NQ but the ratios carry across instruments. every element has its own color, line type and width, so you can set it up to read the way you want and turn off what you don't use.
- b1kPier
指標

Dynamic Buying and Selling Power (ADTM)
什么是 ADTM?
ADTM(Dynamic Buying and Selling Power Indicator,动态买卖气指标)是一种经典的动量与反转量化指标。它通过对比开盘价的跃升与下挫,精确量化开盘后多空双方的推进力度(即爆发力),并将这种力量对比归一化在 的固定区间内。
与传统单纯依赖收盘价(Close)的振荡指标不同,ADTM 更加关注 开盘价(Open)相对于前一交易日的位置以及当日极值(High/Low)的延伸空间 ,从而能够更敏锐地捕捉到市场资金的日内异动。
---
为什么使用它?
在波诡云谲的市场中,单纯的均线或 lagging 指标容易产生钝化。ADTM 的优势在于:
无量纲化区间:其输出被严格限制在 之间,避免了绝对数值对趋势研判的干扰。
日内真实动能:通过计算买方动态能量(DTM)和卖方动态能量(DBM),能够更早地在左侧识别出多空力量的衰竭点。
极佳的反转提示:特别适合配合超买超卖边界进行逆势(反转)波段的卡点操作。
---
怎么用?
本指标的使用逻辑非常直观,默认参数为经典配置: N = 23(求和周期),M = 8(信号均线周期)。
左侧买点(超卖区):
当蓝色 ADTM 曲线跌破 -0.5 时,意味着市场短期内空头宣泄极快,进入超卖状态。这通常是极佳的左侧分批布局或观察止跌反转的买点。
左侧风险(超买区):
当蓝色 ADTM 曲线突破 +0.5 时,意味着多头短期冲锋过急,进入超买状态。此时应防范多头力竭回撤,注意锁定利润或降低仓位。
中轴信号:
0轴为多空分界线。当 ADTM 在 0 轴上方运行时,多头占优;反之,空头占优。
均线交叉:
蓝色主线(ADTM)与橙色信号线(MA_ADTM)的黄金交叉与死亡交叉,可作为右侧动能确认的辅助信号。
---
在哪里用?
本指标采用纯粹的价格几何结构算法,具有极强的普适性:
适用市场:广泛适用于 A 股、美股、加密货币、商品期货以及外汇等主流交易市场。
适用周期:在日线(Daily)及以上大周期中表现尤为稳定,能够有效过滤盘整期的日内噪音;在小周期(如 1H/4H)中,配合趋势背景亦可用于日内波段捕捉。
---
原创与致谢声明
指标原创作者: 本指标的核心算法源自经典量化分析领域的经典设计。
脚本重构与发布: 由本人进行 Pine Script v6 的标准化重构、算法优化与开源发布。
风险提示: 任何技术指标都无法百分之百预测市场。建议将 ADTM 融入自身的交易系统中,结合量价结构、关键支撑阻力位以及严谨的资金管理共同使用。
---
What is ADTM?
ADTM (Dynamic Buying and Selling Power Indicator) is a classic momentum and reversal quantification tool. It precisely quantifies the offensive strength (i.e., explosive power) of both bulls and bears after the market opens by comparing the upward jumps and downward drops of the opening price, and normalizes this power comparison within a fixed range of .
Unlike traditional oscillators that rely solely on the closing price (Close), ADTM places greater emphasis on the opening price (Open) relative to the previous trading day's position, as well as the extension space of the day's extremes (High/Low) , enabling it to more keenly capture intraday anomalies in market capital flow.
---
Why Use It?
In volatile and unpredictable markets, simple moving averages or lagging indicators are prone to desensitization (flattening). The advantages of ADTM are:
Dimensionless interval: Its output is strictly confined within , eliminating the interference of absolute price levels on trend assessment.
Intraday true momentum: By calculating Dynamic Buying Momentum (DTM) and Dynamic Selling Momentum (DBM), it can identify exhaustion points of bullish/bearish power earlier on the left side.
Excellent reversal signals: Particularly well-suited for contrarian (reversal) swing trading by utilizing overbought/oversold boundaries.
---
How to Use It?
The usage logic of this indicator is highly intuitive, with default parameters set to the classic configuration: N = 23 (Summation Period), M = 8 (Signal MA Period).
Left-side Buy Signal (Oversold Zone):
When the blue ADTM line drops below -0.5, it indicates that bearish forces have been excessively unleashed in the short term, entering an oversold state. This is typically an excellent opportunity for left-side accumulation or observing for a bullish reversal.
Left-side Risk Signal (Overbought Zone):
When the blue ADTM line rises above +0.5, it indicates that bullish forces have pushed too aggressively in the short term, entering an overbought state. At this point, one should be cautious of bullish exhaustion and pullbacks, and consider locking in profits or reducing positions.
Zero-Line Signal:
The 0.0 axis serves as the bull-bear dividing line. When ADTM is above 0, bulls are in control; when below 0, bears are in control.
Moving Average Crossover:
The golden cross and death cross between the blue main line (ADTM) and the orange signal line (MA_ADTM) can serve as auxiliary signals for right-side momentum confirmation.
---
Where to Use It?
This indicator employs a pure geometric price-structure algorithm, offering strong universality:
Applicable Markets: Widely applicable to A-shares, U.S. stocks, cryptocurrencies, commodity futures, forex, and other major trading markets.
Applicable Timeframes: Performs particularly well on Daily and higher timeframes, effectively filtering out intraday noise during consolidation periods. On lower timeframes (e.g., 1H/4H), it can also be used for intraday swing trading when combined with the broader trend context.
---
Acknowledgments & Originality Statement
Original Author: The core algorithm of this indicator originates from classic designs in the field of quantitative analysis.
Script Re-engineering & Release: This script has been fully refactored, optimized, and released as open-source by myself.
Risk Disclaimer: No technical indicator can predict the market with 100% accuracy. It is strongly recommended to integrate ADTM into your own trading system, combining it with volume-price structure, key support/resistance levels, and strict risk management practices. 指標

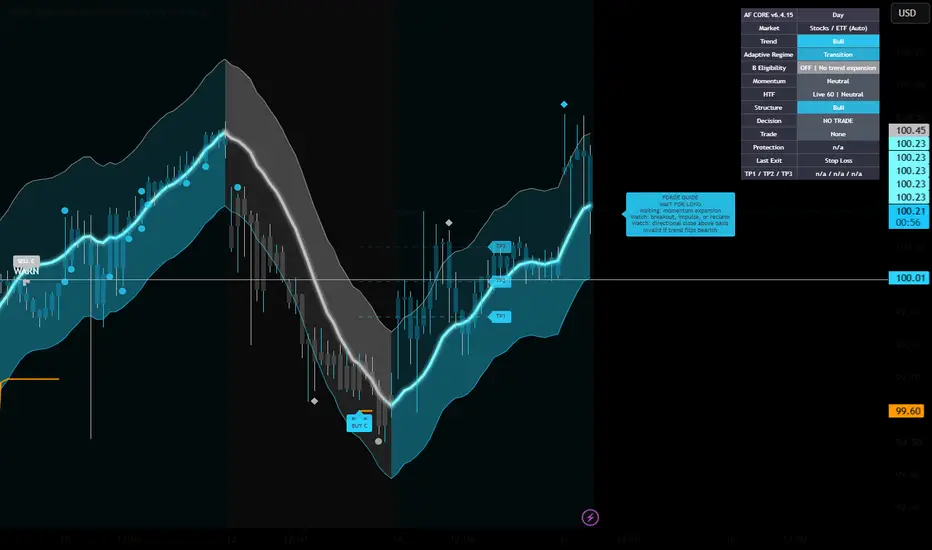
Alpha Forge Core v6.4.15Alpha Forge Core v6.4.15
Advanced trend, momentum, structure, trade-management, and webhook automation indicator.
This multi-layer decision-support tool is designed to help traders evaluate trend direction, momentum, market regime, price structure, entry conditions, and active trade management from one chart.
Rather than relying on a single crossover or isolated signal, the system combines several confirmation layers to assess whether conditions support a potential long or short setup.
It is intended for discretionary chart analysis, TradingView alerts, and compatible webhook-based automation.
What the indicator analyzes
The script evaluates:
Trend direction
Moving-average alignment
Momentum strength
Adaptive market regime
Higher-timeframe confirmation
Price structure
Breakout conditions
Pullback and reclaim behavior
Entry distance and price extension
Volatility
Signal quality
Active trade state
Protective stop placement
Profit-target progression
Breakeven protection
Trailing-stop protection
These components are combined into a single decision process rather than displayed as unrelated signals.
Automatic market detection
The system can detect the general symbol type using TradingView market information.
Supported categories include:
Stocks
ETFs
Crypto
Forex
Futures
Other supported symbols
When automatic behavior is enabled, the detected market can influence the effective operating configuration.
Crypto scalping behavior
When a crypto symbol is detected, the script can automatically apply its faster Crypto Scalping configuration.
This mode is designed for shorter-term crypto charts and removes higher-timeframe influence from the effective scoring process.
Recommended crypto timeframe:
5 minutes
Pine Script cannot automatically change the chart timeframe. When the current chart does not match the recommended timeframe, the Guide may display a reminder.
Operating presets
Scalping
Designed for shorter timeframes and faster-moving setups. This preset uses more responsive conditions and shorter trade-development windows.
Day
Designed for intraday trading with a balance between responsiveness and confirmation. This is the recommended starting point for many stock and ETF charts.
Swing
Designed for higher timeframes and slower-developing setups. This preset applies more selective confirmation and allows additional time for trades to develop.
Custom
Allows the available settings to be controlled manually.
Suggested starting points:
Stocks and ETFs: 15-minute chart with Day mode
Crypto: 5-minute chart with automatic Crypto Scalping
Short-term scalping: 3-minute to 5-minute charts
Swing trading: 30-minute to 4-hour charts
These are general starting points only. Settings should be evaluated on the intended symbol and timeframe.
Signal grades
Potential entries can be filtered by grade.
Available options include:
A Only
B Only
A and B
All Grades
A-grade setups represent stronger internal alignment.
B-grade setups may appear earlier or with fewer confirmation layers while still meeting the selected eligibility rules.
C-grade setups represent lower-confirmation conditions and are available when All Grades is selected.
Grades describe the amount of confirmation present at the time of the setup. They do not guarantee a particular outcome.
Entry behavior
The engine can identify several types of setup behavior.
Breakout entries
These occur when price moves through an important structure level with sufficient directional confirmation.
Impulse entries
These identify stronger directional expansion when momentum and price accelerate together.
Early reclaim entries
These occur when price briefly loses a key level and then reclaims it with confirmation.
Continuation entries
These identify opportunities within an established trend after a valid pullback or consolidation.
B-grade re-entry
When enabled, the system can permit a controlled re-entry after a valid pullback instead of repeatedly triggering during the same move.
Range and extension protection
The script includes filters intended to reduce weaker entries during unsuitable conditions.
These can include:
Blocking continuation setups in range conditions
Requiring trend-regime eligibility
Limiting entries when price is too far from its reference level
Avoiding repeated entries during an active trade
Waiting for candle-close confirmation
Requiring directional confirmation
These filters are designed to improve consistency, but they may also reduce signal frequency.
Higher-timeframe confirmation
Higher-timeframe alignment can be used as an additional confirmation layer.
The script supports both responsive and confirmed higher-timeframe behavior.
When higher-timeframe influence is disabled, scoring is normalized so that the missing HTF component does not unfairly reduce setup quality.
Trade lifecycle
The indicator tracks a complete trade state from entry through exit.
The lifecycle can include:
Entry confirmation
Protective stop placement
TP1
TP2
TP3
Breakeven activation
Trailing-stop activation
Stop-loss exit
Breakeven exit
Trailing-stop exit
Final target exit
Only one active position is tracked at a time. New entries are blocked until the current position is closed.
Protective stops
Stops can use a combination of structure and ATR-based distance.
Available controls may include:
ATR stop multiplier
Structure buffer
Maximum stop distance
Same-bar target and stop priority
Breakeven activation
Trailing-stop source
Trailing-stop distance
These settings should be matched to the symbol’s volatility and the trader’s risk plan.
Profit targets
The system supports three target levels:
TP1
TP2
TP3
Target progress is shown on the chart and in the dashboard.
Breakeven and trailing protection can be activated after a selected target is reached.
Forge Guide
The Guide has been rebuilt as a forward-looking coaching panel.
Instead of repeating dashboard information, it focuses on what matters next.
It can display:
What the system is waiting for
What to watch next
Whether a setup is armed
Trigger conditions
Invalidation conditions
Remaining setup window
Whether price is too extended
Current trade objective
Active protection
Target progression
Trailing-stop status
Typical Guide states include:
WAIT
WATCH LONG
WATCH SHORT
LONG NEAR READY
SHORT NEAR READY
STAND ASIDE
DO NOT CHASE
MANAGE LONG
MANAGE SHORT
PROTECT PROFIT
The Guide is intended to explain the current condition in plain language without replacing personal judgment.
Dashboard
The compact dashboard focuses on live decision information.
It may display:
Effective preset
Detected market
Trend
Adaptive regime
B eligibility
Momentum
Higher-timeframe state
Structure
Current decision
Active trade
Protection
Last exit
TP1, TP2, and TP3 status
Historical testing statistics and diagnostic counters are not shown in the public dashboard so the chart remains clean and easy to read.
Alerts and webhook automation
The script supports TradingView alerts and JSON webhook messages.
For long-only automation:
buy opens a long position
sell closes the long position
A sell action may be generated when the active long closes through:
TP3
Stop loss
Breakeven
Trailing stop
Another enabled long-exit condition
The JSON format includes fields for:
Secret token
Ticker
Asset type
Action
Price
Strategy
Timeframe
Order type
Stop loss
Take-profit levels
For webhook use:
Enter the secret token in the alert settings.
Enable bot JSON alerts.
Create one TradingView alert using Any alert() function call.
Enter the webhook URL supplied by the connected execution service.
Recreate alerts whenever the script or alert configuration is changed.
Existing alerts continue running the older saved script snapshot until they are recreated.
Important notes
This indicator is a chart-reading and decision-support tool.
It does not predict future price movement and does not guarantee profitable outcomes.
Historical chart behavior may differ from live execution because of:
Spread
Slippage
Liquidity
Latency
Broker rules
Order handling
Market gaps
Partial fills
Signals should be evaluated alongside personal risk management, position sizing, market conditions, and independent analysis. 指標
Reversal Confluence Sniper [JOAT]Reversal Confluence Sniper
Hunts exhaustion reversals by requiring several independent exhaustion signals to appear together, so it fades stretched moves with confirmation rather than hope.
What it is
Fading a trend is dangerous when done on a single cue. This indicator only flags a potential reversal when multiple, independent signs of exhaustion coincide at the same moment — turning a risky counter-trend guess into a confluence-gated setup. It is an original reversal engine, not a lone oscillator flip.
How it works
The engine looks for several exhaustion conditions and requires enough of them to align:
• Momentum extreme — an oscillator reaching and rolling over from an overextended level, showing the push is losing force.
• Volatility stretch — price extended a statistically large distance from a mean or band, marking an unsustainable move.
• Rejection candle — a wick or close that rejects the extreme, showing the aggressive side failed to hold new ground.
• Participation — a volume or effort read that flags climax or fade behaviour rather than steady continuation.
A Buy (bullish reversal) prints when enough downside-exhaustion factors align; a Sell when enough upside-exhaustion factors align. A minimum-gap control prevents repeated prints while a market chops around an extreme.
Trade levels
Each signal draws a red risk box to a stop placed beyond the exhaustion extreme and a green reward box to the third target, with inner dividers and right-edge labels for entry, stop and each take-profit at your R multiples. Placing the stop beyond the extreme respects the idea that if price makes a new extreme, the reversal thesis is wrong.
The dashboard
An adjustable sniper-scope panel shows which exhaustion factors are currently active, a combined conviction reading, the active signal, and a live first-target-before-stop tally from closed bars only, so you can see how much confluence backs each setup.
How to use it
• Works on any asset and timeframe.
• Most effective for timing entries at the end of a stretched move, ideally into a higher-timeframe level or zone.
• Because it fades momentum, pair it with structure or a level tool and keep stops disciplined — reversals that do not confirm should be cut quickly.
Settings
The exhaustion factor lengths and thresholds, the number of factors required to trigger, risk multiple and target R multiples, plus visual and dashboard controls.
Originality and usefulness
The contribution is the confluence gate itself: several independent exhaustion measures that must agree before a counter-trend signal is allowed, with a transparent readout of which factors fired and integrated, non-repainting trade framing. It is designed to make fading safer by demanding evidence, not to promise reversals.
Notes and limitations
• Counter-trend trading is inherently higher risk; strong trends can stay stretched far longer than expected and overrun any reversal signal.
• Requiring more factors reduces false signals but also reduces frequency — this trade-off is yours to set.
• The tally reflects only past bars on the current chart and is not a forecast.
• Educational and analytical tool, not financial advice.
— made with passion by officialjackofalltrades
指標

Swing Reversion Zones Swing Reversion Zones is an adaptive mean-reversion channel built around a smoothed price trajectory. It highlights the first moments when price reaches the upper or lower boundary of the channel.
The indicator is designed to help traders evaluate how far price has moved away from its local smoothed structure and identify areas where a return toward the central trajectory may become possible.
Boundary touches are displayed as semi-transparent bubbles:
🔴 Red bubble — touch of the upper boundary
🟢 Green bubble — touch of the lower boundary
The bubbles show that price has reached a user-defined deviation zone. They are not automatic buy or sell commands.
━━━━━━━━━━━━━━━━━━
🧭 Core Concept
The indicator is based on the concept that price may revert toward a smoothed central trajectory after reaching a sufficiently large deviation from it.
The central line is not calculated as a conventional moving average. Instead, the script uses Gaussian weighting.
Bars located closer to the calculated point receive greater weight, while the influence of more distant observations gradually decreases.
This approach is designed to:
• reduce the influence of short-term market noise
• preserve the natural shape of price movement
• create a smooth central trajectory
• measure deviations relative to local market structure rather than a conventional fixed moving average
━━━━━━━━━━━━━━━━━━
⚙️ How the Channel Is Calculated
The calculation consists of several connected stages.
1. Central Trajectory
For each historical bar, the script calculates a smoothed value of the selected price source.
The weight of each observation is determined by a Gaussian function. The closer an observation is to the point being calculated, the more influence it has on the resulting value.
The Smoothing Length parameter controls the degree of smoothing:
• lower values make the central line more responsive to local price movements
• higher values create a smoother trajectory that reflects broader market structure
2. Base Deviation
After calculating the central trajectory, the script measures the absolute distance between the selected price source and the smoothed line across the processed data.
These distances are averaged to produce the base deviation value.
Unlike channels based on ATR or standard deviation, Swing Reversion Zones uses the mean absolute error between price and the Gaussian-smoothed trajectory.
3. Upper and Lower Boundaries
The distance from the central trajectory to each boundary is calculated as:
Mean Absolute Deviation × Channel Width
The resulting value is:
• added to the central trajectory to create the upper boundary
• subtracted from the central trajectory to create the lower boundary
Both boundaries remain symmetrical around the central line.
━━━━━━━━━━━━━━━━━━
🎛 Manual Channel Width Adjustment
The Channel Width setting allows users to define how sensitive the channel should be.
Lower Channel Width values
• move the boundaries closer to the central line
• produce more frequent price touches
• increase the number of bubbles
• make the indicator more sensitive to smaller deviations
Higher Channel Width values
• create a wider channel
• produce fewer boundary touches
• highlight more substantial price deviations
• reduce the number of bubbles displayed on the chart
This allows the channel to be adapted to:
• a specific trading instrument
• the selected timeframe
• current volatility conditions
• the user’s preferred analytical approach
The script does not impose a universal channel width. The user decides which degree of deviation is meaningful for the selected market.
━━━━━━━━━━━━━━━━━━
🫧 How the Touch Bubbles Are Generated
The indicator does not place a bubble on every bar that remains outside the channel.
Instead, it marks the initial touch of a boundary.
Upper Boundary Touch
A red bubble appears when:
• the current bar’s high reaches or exceeds the upper boundary
• the previous bar’s high was below the previous upper-boundary value
Lower Boundary Touch
A green bubble appears when:
• the current bar’s low reaches or falls below the lower boundary
• the previous bar’s low was above the previous lower-boundary value
This logic highlights the moment when price initially enters a deviation zone. It avoids placing a new bubble on every subsequent bar while price remains beyond the same boundary.
The bubbles are positioned directly on the channel boundary rather than at the candle’s exact high or low. This makes it easier to see which calculated channel level was reached.
━━━━━━━━━━━━━━━━━━
✦ Originality and Practical Usefulness
Gaussian smoothing and mean absolute deviation are established mathematical concepts.
The originality of Swing Reversion Zones does not come from mechanically combining unrelated indicators. It comes from the way its components are integrated into one consistent calculation framework.
Within the script:
A Gaussian-smoothed central trajectory is calculated across the available data.
The channel scale is derived from the actual average distance between price and that trajectory.
The user manually controls the final channel width through a single multiplier.
Touch bubbles are calculated directly from the user-defined channel geometry.
Changing the settings recalculates both the channel boundaries and the historical map of boundary touches.
The bubbles are not produced by a separate signal indicator placed over the channel. Their position and frequency depend entirely on the current Gaussian trajectory, the measured price deviation and the selected Channel Width value.
The result is an interactive analytical tool that allows users to define which price deviations should be considered significant for a particular market and timeframe.
━━━━━━━━━━━━━━━━━━
📌 How to Use the Indicator
After adding the indicator to a chart, begin with the default settings and observe how price interacts with the channel boundaries.
The adjustment process can then be divided into two stages.
Step 1. Adjust the Smoothing
Change Smoothing Length until the central line reflects the type of price structure you want to analyse.
A more responsive central line may be suitable for examining local fluctuations.
A smoother central line may be more appropriate for evaluating deviations from a broader price structure.
Step 2. Adjust the Channel Width
After selecting the desired smoothing level, adjust Channel Width.
The objective is not necessarily to make the boundaries touch every swing high and low. The objective is to define a deviation level that is meaningful for the selected instrument.
A channel that is too narrow may produce many insignificant touches.
A channel that is too wide may produce very few or no touch markers.
Settings should be evaluated separately for different:
• instruments
• asset classes
• timeframes
• volatility regimes
━━━━━━━━━━━━━━━━━━
🔍 Interpreting Boundary Touches
A lower-boundary touch indicates that price has reached the selected negative deviation from the central trajectory.
An upper-boundary touch indicates that price has reached the selected positive deviation.
These areas may be useful for identifying potential mean-reversion conditions. However, reaching a boundary does not guarantee a reversal.
During a strong directional move, price may:
• repeatedly reach the same side of the channel
• continue moving after a bubble appears
• remain outside the boundary for several bars
• return toward the central line only after a further expansion
For this reason, bubbles should be treated as information about the current position of price relative to the channel, not as a complete trading system.
Users may combine the touch markers with additional analysis such as:
• higher-timeframe trend direction
• swing-high and swing-low structure
• support and resistance levels
• candle behaviour following a touch
• volume analysis
• personal risk-management rules
━━━━━━━━━━━━━━━━━━
🛠 Settings
Smoothing Length
Controls the Gaussian kernel width and the degree of smoothing applied to the central trajectory.
Lower values increase responsiveness.
Higher values create stronger smoothing.
Channel Width
Multiplies the mean absolute deviation between price and the central trajectory.
This is the main setting for controlling the distance between the central line and the channel boundaries, as well as the frequency of touch bubbles.
Source
Defines the price series used in the calculation.
The default source is the closing price.
Users may select another available source, including open, high, low, HL2 or other standard price series.
Style
The visual settings allow users to adjust:
• upper-boundary colour
• lower-boundary colour
• line thickness
• bubble transparency
━━━━━━━━━━━━━━━━━━
♻️ Repainting Behaviour
Swing Reversion Zones intentionally uses repainting Gaussian smoothing.
Historical points of the central trajectory are calculated using observations located on both sides of the corresponding point. As new bars become available, previously calculated values may change.
The width of the channel is also based on the average error measured across the processed data. Changes in the available dataset may therefore affect the deviation value and the position of both boundaries.
As new data appears, the following elements may change:
• the central trajectory
• the upper and lower boundaries
• the position of historical bubbles
• the number of historical bubbles
• individual historical touch locations
The indicator is also recalculated when the user changes:
• the trading instrument
• the timeframe
• the price source
• the smoothing length
• the channel width
Repainting is an intentional part of the indicator’s design. It is used to create a smoother historical representation of the price trajectory.
Historical bubbles must not be interpreted as fixed past signals that were necessarily available in exactly the same form in real time.
For the same reason, the visual history of the indicator should not be used to estimate historical profitability or as a substitute for proper strategy testing.
━━━━━━━━━━━━━━━━━━
🔔 Alerts
The script includes two alert conditions:
Upper Channel Touch — price reaches the upper boundary
Lower Channel Touch — price reaches the lower boundary
Alert conditions are calculated relative to the current position of the channel.
To reduce intrabar fluctuations, users may configure alerts to trigger only after the bar closes.
However, waiting for bar close only reduces intrabar changes. It does not make the indicator non-repainting. The historical channel geometry may still change as new data becomes available.
━━━━━━━━━━━━━━━━━━
⚠️ Limitations
Swing Reversion Zones is an analytical indicator, not a trading strategy.
It does not:
• open or close positions
• calculate stop-loss or profit targets
• determine position size
• account for commissions or slippage
• calculate performance statistics
• guarantee that price will return to the central trajectory
• evaluate the quality of each individual trading opportunity
Standard candlestick charts are recommended for interpretation.
On non-standard chart types, OHLC values may be synthetic. As a result, boundary touches may not correspond to actual traded market prices.
Users remain responsible for selecting the indicator settings, applying additional confirmation methods, defining entry and exit rules, and managing risk. 指標

Prev Day/Week VP Levels MADE BY ADAM
Previous Day & Week Volume Profile Levels (POC / VAH / VAL)
This indicator automatically plots the previous day's and previous week's volume profile levels — Point of Control (POC), Value Area High (VAH), and Value Area Low (VAL) — as clean horizontal levels extended to the right of the chart, replicating the look of manually drawn key levels.
How it works
Sessions are defined by a custom reset hour in a chosen timezone rather than midnight exchange time. The default is 19:00 New York (crypto perpetual sessions); set it to 18:00 for CME futures like MNQ/NQ to match the Globex daily open. Weeks run from the Sunday-evening session open through the Friday close.
All profiles are calculated on a separate, configurable calculation timeframe (default 5-minute) through request.security, independent of the chart timeframe. This means the levels are identical on every chart resolution and remain visible even on a 1-minute chart, where the chart itself doesn't hold enough history to cover a full week. Each period's profile distributes bar volume across price rows (default 100), locates the POC as the highest-volume row, and expands the value area around it until it contains the configured share of total volume (default 70%).
Once a day or week completes, its levels are drawn across the current period and stay fixed until the next rollover — the exact levels a trader would mark by hand at the start of each session.
Features
Previous day and previous week POC, VAH, VAL (each toggleable)
Custom session reset hour and timezone (DST-safe)
Configurable calculation timeframe, row count, and value area percentage
Minimalist styling: line color, width, style (solid/dashed/dotted), plain text labels (pdaypoc, pweekvah, etc.) with adjustable offset and size
No repainting: only completed periods are plotted
Intended use
Built for intraday traders who anchor their execution around prior-session value: value area rotations, POC retests, acceptance/rejection outside prior value, and confluence with order flow or options-derived levels. 指標

Uptrick: Vector Trail TrendIntroduction
Uptrick: Vector Trail Trend (VTT) is an overlay tool that combines a velocity-projected trend line with an ATR-based adaptive trailing band to identify directional bias and trend reversals. A secondary momentum module layered on top flags statistically extreme momentum conditions that traders can use as dynamic take-profit references within the prevailing trend. The script also includes a configurable overlay presentation and an on-chart dashboard summarizing current trend state.
Originality
This script combines three distinct calculation layers that are not typically merged in a single publication, and each is included for a specific reason.
The first layer builds a trend center from a smoothed moving average of price, then projects that line forward using a smoothed rate of change of the trend center itself, scaled by a user-defined projection factor. This produces a trend reference that leans in the direction of recent acceleration rather than simply lagging price, which is the basis used for the trailing band below it.
The second layer wraps that projected trend center in an ATR-based band that only trails in the favorable direction and resets on a confirmed close beyond the opposite band, similar in mechanism to a ratcheting stop line. This layer is responsible for the directional flips and the up and down signals plotted on the chart.
The third layer is independent of the first two and evaluates RSI relative to its own rolling mean and standard deviation, expressed as a Z-score. This is used to flag when momentum has reached a statistically extreme reading relative to its recent history, which the script surfaces as separate dynamic take-profit markers. This layer exists because trend direction and momentum exhaustion are different pieces of information, and combining them gives traders both a directional read and a separate overextension read without conflating the two into a single signal.
The overlay is user-selectable between a gradient fill between price and the trail, a dual EMA trend ribbon, both together, or neither, so the visual presentation can be adjusted without changing the underlying trend or TP logic.
Features
Velocity-projected trend center using a smoothed moving average and a smoothed rate of change projection
ATR-based adaptive trailing band with directional flip logic
Confirmed-bar trend state calculation to avoid intrabar repainting of the trend flip
Dynamic take-profit engine based on a Z-score of RSI relative to its own rolling mean and standard deviation
Selectable TP marker style, cross or circle
Up and down trend signal labels plotted at the trail
Selectable overlay mode: vector gradient fill, trend ribbon, both, or none
Adjustable gradient and ribbon transparency
Optional candle coloring based on active trend direction
Adjustable trail line width
On-chart dashboard showing trend, signal, Z-score, TP state, distance from trail in ATR units, and active overlay mode
Nine selectable dashboard positions
Seven alert conditions: up signal, down signal, long dynamic TP, short dynamic TP, any trend signal, any dynamic TP, and all VTT signals combined
Inputs
Trend Settings: source, trend length, velocity smoothing length, vector projection factor.
Trail Settings: ATR length, ATR multiplier.
Dynamic TP Settings: show/hide dynamic TPs, TP marker style, momentum (RSI) length, Z-score length, TP extreme level threshold.
Overlay: overlay style selection, gradient transparency, ribbon fast length, ribbon slow length, ribbon transparency.
Visuals: show/hide up and down signals, candle coloring toggle, trail width.
Dashboard: show/hide dashboard, dashboard position.
How It Works / How to Use
The trend center is calculated from a moving average of the chosen source, then projected forward using a smoothed measure of its own rate of change. An ATR-based band is built around this projected line and only moves in the direction favorable to the current trend, flipping only on a confirmed close beyond the opposite band. This flip is what produces the up and down signals and the trend color change.
Once a trend is established, the script tracks RSI relative to its own recent mean and standard deviation. When this Z-score reaches the user-defined extreme level and then crosses back toward normal, a dynamic take-profit marker is plotted for the active trend, using the opposite color for visual distinction, indicating that momentum has cooled from an extreme reading.
Traders can use the trail flips for directional bias and entries, and the dynamic TP markers as a secondary reference for potential exhaustion points within that trend. The overlay mode, transparency, candle coloring, and dashboard are all cosmetic and can be adjusted without affecting the underlying calculations.
Conclusion
Uptrick: Vector Trail Trend combines a velocity-projected trend line, an adaptive ATR trailing band, and a momentum Z-score take-profit layer into a single overlay tool, giving traders both a directional trend read and a separate momentum-exhaustion reference from one indicator.
Disclaimer
This script is provided for informational and educational purposes only and does not constitute financial advice. Past performance, whether shown historically or implied through the script's logic, does not guarantee future results. Always perform your own due diligence and risk management before making trading decisions.
指標

RSI Divergence + EMA Trend FilterDescription:
Divergence is one of the most discussed concepts in technical analysis and one of the most misapplied. The core idea is simple: when price makes a new high but the RSI makes a lower high, momentum is weakening even as price advances. That disconnect between price action and momentum is what divergence measures — and it often precedes reversals before price itself confirms the change in direction.
This strategy formalizes that concept into a rule-based, backtestable system with two components: RSI divergence detection and an EMA trend filter that determines which divergences to act on.
What divergence actually measures
RSI measures the speed and magnitude of price changes. When price reaches a new swing high but RSI fails to reach a correspondingly higher reading, it means the buying pressure behind the new high was weaker than the buying pressure behind the previous high. The market got to a higher price but required less momentum to do it — which suggests the move is losing conviction. Bearish divergence (price higher, RSI lower) signals potential exhaustion in an uptrend. Bullish divergence (price lower, RSI higher) signals potential exhaustion in a downtrend.
Important: divergence is a momentum signal, not a reversal guarantee. Price can continue making new highs with weakening RSI for a significant period before actually reversing. This is why divergence signals work best when combined with a trend filter that identifies the broader market context.
The EMA filter
The 200 EMA defines the dominant trend regime. Bearish divergence signals — where momentum is weakening on the upside — are only acted on when price is below the 200 EMA, meaning the broader trend is already bearish and divergence represents a potential resumption of that trend after a counter-trend bounce. Bullish divergence signals are only acted on when price is above the 200 EMA, where they represent potential continuations of the dominant uptrend after a pullback with improving momentum.
This filter deliberately reduces the total number of signals. Many valid divergences occur against the dominant trend and produce short-lived reversals that reverse again quickly. By requiring trend alignment, the strategy trades fewer setups but acts on the ones with a higher probability of following through.
How divergence is detected
The strategy identifies swing highs and swing lows using a lookback period — the number of bars on each side of a pivot that must be lower (for a high) or higher (for a low) to qualify as a genuine swing point. When two consecutive swing highs show price making a higher high but RSI making a lower high, bearish divergence is flagged. When two consecutive swing lows show price making a lower low but RSI making a higher low, bullish divergence is flagged.
The lookback length is the most important input to tune. A shorter lookback detects more swing points and generates more signals, but many will be minor pivots in the context of noise. A longer lookback requires more significant swing points and generates fewer, higher-quality signals. On daily charts, a lookback of 5 works well. On lower timeframes, 3 to 4 is more appropriate.
Exits
Positions exit at an ATR-based stop-loss and a fixed ATR-based take-profit. The stop is placed beyond the swing point that generated the divergence signal — for a bearish divergence, the stop sits above the swing high; for a bullish divergence, below the swing low. This is intentional: if price breaks through the very level that defined the divergence, the signal is invalidated regardless of what RSI was doing. The take-profit is set at 2x ATR to maintain a positive reward-to-risk ratio across the system.
What to evaluate in backtesting
Look at the signal distribution across different market environments. Divergence strategies tend to perform differently in trending versus ranging markets — in strong trending environments, bearish divergences against the dominant trend will produce many false signals even with the EMA filter. Look at whether the EMA filter is doing real work by temporarily disabling it and comparing signal quality. Check average trade duration — divergence signals that take too long to play out often give back open profit before the take-profit level is reached.
This is not a high-frequency strategy. On daily charts with a 5-bar lookback, signals may appear only a few times per month on a given instrument. That frequency is appropriate — divergence setups require specific conditions to form and should not be forced.
Shared for educational purposes and discussion. This is not investment advice. Backtest on your own instruments and timeframes before drawing conclusions about expected performance. 策略

Multi-Timeframe Squeeze Board LiteWhat it shows
Multi-Timeframe Squeeze Board — Lite answers one question at a glance: "Where is this symbol compressed, and which way is momentum leaning, on every timeframe that matters?" For the chart's symbol it displays a compact table with one row per timeframe — 15m, 1h, 4h, Daily, Weekly — and two readings per row:
- Sqz — the TTM Squeeze compression state as a colored dot, using the standard three-level cascade: orange = high squeeze (deepest compression), red = mid squeeze, black = low squeeze, green = no squeeze (volatility released / normal).
- Mom — the squeeze momentum oscillator as a colored arrow using the classic 4-color scheme: aqua = positive and rising, blue = positive but falling, yellow = negative but rising, red = negative and falling. The arrow points up when momentum is increasing bar-over-bar and down when it is decreasing.
A stacked squeeze (orange/red dots on several adjacent timeframes) marks a market coiling across horizons; the momentum colors tell you which side the pressure is building on.
How it works
Each row runs the full TTM Squeeze calculation on its own timeframe via request.security() with lookahead = barmerge.lookahead_off (no future data, ever):
1. Bollinger Bands: SMA(close, 20) basis, 2.0 × population standard deviation.
2. Keltner Channels: the same SMA(close, 20) basis, with band width = SMA of True Range over 20 bars (simple average of TR — not Wilder's ATR) at three multipliers: 1.0, 1.5, 2.0.
3. A squeeze is on when the Bollinger Bands sit fully inside the Keltner Channel on both sides. The narrower the Keltner band that still contains the BB, the deeper the compression — hence the 1.0-multiplier band defines the high squeeze, 1.5 the mid, 2.0 the low.
4. Momentum is the linear regression of price's deviation from the average of the Donchian midline and the SMA, over the same 20 bars.
By default the board evaluates confirmed bars only: every row shows the last fully closed bar of its timeframe, so a dot or arrow never changes after it appears. See Limitations for the tradeoff.
Inputs
- Squeeze length — lookback for BB, KC and momentum (default 20, the canonical TTM setting).
- Confirmed HTF bars only — ON (default): stable, non-repainting readings that lag up to one bar of each row's timeframe. OFF: rows track the still-forming higher-timeframe bar — more current, but the reading can flip until that bar closes.
- Table position / Table size — where the board sits and how large it renders.
How to use it
Apply it to a 15m chart (or lower) so all five rows populate. Scan the Sqz column top-to-bottom: multiple orange/red dots stacked across timeframes indicate multi-horizon compression — historically the precondition for expansion moves. Then read the Mom column for directional lean while the compression resolves. The board is a context tool: it tells you where energy is stored, not when or in which direction it must release.
Limitations — please read
- Confirmed-bar lag: with the default non-repainting mode, the Weekly row updates once per week, the Daily row once per day, etc. That is the honest cost of stability. Turning the toggle off shows the live forming bar instead, and those readings can change until the bar closes.
- Rows below the chart's timeframe show "–": Pine's request.security() cannot reliably reconstruct lower-timeframe series, so instead of showing a possibly wrong dot the board declines to show one. Use a 15m chart to see everything.
- A squeeze has no direction. Compression means stored energy, not a buy or sell signal. The momentum color is a lean, not a prediction.
- Warm-up: each timeframe needs about 20 bars of history before its row populates (shown as "·" until then).
This board covers one symbol — the chart's.
指標

Ichimoku Cloud Thickness SpectrumOverview
Ichimoku Cloud Thickness Spectrum is an overlay for studying the geometry and relative thickness of the projected Ichimoku cloud. It plots the classical Tenkan-sen, Kijun-sen, Senkou Span A, Senkou Span B, and an optional Chikou Span, then adds a configurable research layer derived only from the distance and relationship between the two Senkou spans.
The script is designed to make three questions easier to inspect:
- How wide is the projected cloud in a unit suited to the current instrument?
- How unusual is that width compared with the cloud's own recent history?
- Is the smoothed cloud thickness expanding, contracting, or comparatively stable?
This is a context and visualization tool. It does not generate buy or sell instructions, forecasts, targets, stops, position sizing, or performance claims.
Original contribution
Cloud thickness is a known Ichimoku concept. The original contribution of this implementation is the integrated workflow used to transform raw Span A/B distance into a configurable research display:
1. Selectable ATR, percentage, or raw-price normalization.
2. Rolling empirical percentile ranking of the selected thickness measure.
3. Percentile-weighted cloud opacity and an optional dense inner core.
4. A stabilized expansion/contraction spine with a near-zero denominator floor and release-ratio hysteresis.
5. Confirmed thin-cloud seams filtered by thin-state membership, two-sided prominence, and minimum spacing.
6. Directional projected-cloud twist markers.
7. Separate handling of the newly calculated forward cloud and the historically shifted cloud aligned with the current price bar.
8. A bilingual confirmed/live readout, confirmed-bar alerts, and Data Window diagnostics.
The classical Ichimoku formulas are standard, widely known calculations. The percentile, motion-state, seam-filtering, visualization, readout, and alert logic were implemented for this script. No source code from another Community Script is reused.
Core calculations
- Tenkan-sen: midpoint of the highest high and lowest low over the Conversion length.
- Kijun-sen: midpoint of the highest high and lowest low over the Base length.
- Senkou Span A: average of Tenkan-sen and Kijun-sen.
- Senkou Span B: midpoint of the highest high and lowest low over the Span B length.
- Raw cloud thickness: absolute distance between Senkou Span A and Senkou Span B.
- Cloud midpoint: average of Senkou Span A and Senkou Span B.
Thickness modes and percentile ranking
- ATR: raw cloud thickness divided by ATR. This is the default and relates cloud width to recent price range.
- Percent: raw cloud thickness divided by the absolute close, multiplied by 100.
- Raw: the unnormalized price distance between Span A and Span B.
The selected measure is ranked against its own rolling history with a percent-rank calculation. A reading near 10 is relatively thin within the selected lookback, while a reading near 90 is relatively thick. The result is specific to the symbol, timeframe, settings, and available history; it is not a universal market-strength score.
Stabilized expansion and contraction
The selected thickness measure is smoothed with an EMA. A one-bar percentage change is then calculated. Near a cloud twist, Span A and Span B can converge and the previous thickness can approach zero, which can make an unrestricted percentage change unstable. To reduce this effect, the denominator cannot fall below a configurable fraction of a slower EMA baseline.
The state classifier also uses release-ratio hysteresis. Entry into expansion or contraction requires the main sensitivity threshold, while release from an existing state uses a smaller configurable threshold. This reduces bar-to-bar color chatter. The state uses the previous bar and does not rely on intrabar-only persistent memory.
Visual interpretation
- Teal cloud: Senkou Span A is at or above Senkou Span B.
- Red cloud: Senkou Span A is below Senkou Span B.
- More transparent cloud: lower thickness percentile.
- More visible cloud: higher thickness percentile.
- Dense inner core: optional emphasis when thickness percentile is above the selected threshold.
- Blue midpoint spine: thickness is in an expanding state.
- Purple midpoint spine: thickness is in a contracting state.
- Gray midpoint spine: thickness motion is inside the release threshold.
- Yellow upward/downward triangle: confirmed bullish/bearish projected-cloud twist.
- Small pink X: confirmed local thin-cloud seam that passed the thin-state, prominence, and spacing filters.
The cloud opacity and inner core encode relative thickness only. They do not guarantee support, resistance, continuation, reversal, or breakout behavior.
Filtered thin-cloud seams
A thin seam is not every low-thickness bar. It must be a confirmed local minimum in the thickness percentile, remain at or below the user-defined thin threshold, rebound by at least the selected prominence on both sides, and pass the minimum-spacing filter.
The pivot becomes known only after the selected number of right-side bars has closed. By default, a marker is not placed to the left of the bar where confirmation became available. The optional Allow seam placement before confirmation setting can place the marker at the original pivot-projected cloud position after confirmation. This changes the visual location only and does not make the event available earlier.
Projected cloud versus current aligned cloud
The newly calculated Span A and Span B values are displayed forward by the selected displacement. This positive offset shifts calculations made from current and historical bars into future chart positions; it does not access future market data.
Price-context calculations use a different alignment. They reference the historically shifted spans that are actually visible at the current price bar. Optional inside-cloud highlighting and current-cloud transition alerts therefore do not compare current price with the newly calculated cloud plotted in the future.
Forward readout, alerts, and research outputs
The three-line readout displays the thickness state and percentile, the selected normalized thickness value and motion state, and the future-cloud direction with Live or Confirmed status. English is the default. Japanese changes the readout, hover tooltip, and combined dynamic alert messages; input names and tooltips are bilingual.
Use confirmed values in readout is enabled by default. While the latest realtime bar is open, the label uses the previous closed bar. Once the latest bar is confirmed, it uses that bar. Users can disable the setting to inspect the open realtime bar, in which case the label shows Live and may change until close.
Confirmed-bar alert conditions are available for projected twists, thin/thick state transitions, current-cloud position transitions, expansion/contraction changes, and filtered thin seams. A combined bilingual alert is also available through Any alert() function call. Additional raw, normalized, percentile, motion, seam, current-cloud, direction, and state values are provided in the Data Window.
Realtime behavior and limitations
The script does not use request.security(), lookahead, or future bars. On an open realtime bar, Tenkan-sen, Kijun-sen, the projected spans, cloud opacity, and motion state can update as the bar's high, low, and close change. Confirmed historical values do not use intrabar-only memory. The supplied alert conditions are evaluated on confirmed bars, and the combined alert() call uses once-per-bar-close frequency.
Percentile readings require sufficient history and can show a warming-up state. Results depend on the symbol, timeframe, Ichimoku lengths, normalization basis, percentile lookback, and available data. Non-time-based charts and sparse datasets may behave differently from standard time-based candles.
A thick cloud is not automatically strong support or resistance. A thin or contracting cloud is not a breakout prediction. This script provides research context and should be combined with the user's own analysis and risk process.
日本語概要
Ichimoku Cloud Thickness Spectrumは、一目均衡表の将来雲について、方向だけでなく、厚み、履歴内の相対順位、拡大・収縮状態を研究するためのオーバーレイ型インジケーターです。転換線、基準線、先行スパン1・2、任意の遅行スパンを表示し、追加分析はすべて先行スパン1と2の距離および関係から算出します。
主な特徴
- 雲の厚みをATR比率、価格比率、価格差から選択可能。
- 選択した厚みを直近履歴内のパーセンタイルへ変換。
- 厚み順位を雲の透明度と任意の高密度インナーコアへ反映。
- ゼロ近傍の分母下限とヒステリシスを備えた拡大・収縮中心線。
- 薄い状態、左右プロミネンス、最小間隔を満たした確認済み局所薄化点。
- 上向き・下向きを分けた確認済み将来雲ツイスト。
- 将来へ描画する新規計算雲と、現在価格バーへ整列した過去計算雲を分離。
- 英語・日本語を切り替えられる将来ラベル、確定足アラート、データウィンドウ研究値。
雲の厚みという概念自体は既知です。本実装の差異は、生の雲幅を正規化し、履歴順位化し、厚みの動きを安定化し、薄化点を確認・選別し、それらを一貫した視覚表現と研究出力へ統合している点です。標準一目均衡表の計算式は広く知られた古典計算であり、追加した順位化、状態判定、薄化点フィルター、表示、ラベル、アラートのロジックは本スクリプト用に実装しています。他のCommunity Scriptのソースコードは再利用していません。
表示の読み方
- 青緑の雲: 先行スパン1が先行スパン2以上。
- 赤の雲: 先行スパン1が先行スパン2未満。
- 透明度が高い雲: 厚み順位が低い。
- 濃い雲とインナーコア: 厚み順位が高い。
- 青の中心線: 厚みが拡大状態。
- 紫の中心線: 厚みが収縮状態。
- 灰色の中心線: 安定状態。
- 黄色の三角: 確認済みの上向き・下向き将来雲ツイスト。
- 小さなピンクのX: 条件を満たした確認済み局所薄化点。
厚み順位は銘柄、時間足、設定、参照期間、利用可能な履歴に依存する相対値です。雲の濃さやインナーコアは支持抵抗の保証ではありません。
確認、シフト、ライブ動作
将来雲は、現在および過去バーから計算した先行スパンを正のoffsetで将来位置へ描画したもので、未来データを取得していません。現在価格との関係には、現在バー上に実際に整列している過去計算の先行スパンを使用します。
薄化点は右側に指定本数の確定バーを必要とするため、認識に意図的な遅延があります。初期設定では確認可能になったバーより左側へ表示しません。任意設定で元の投影位置へ表示する場合も、認識自体は確認後です。
未確定リアルタイムバーでは、高値・安値・終値の更新に伴い、転換線、基準線、先行スパン、雲の透明度、拡大・収縮状態が終値確定まで変化する場合があります。将来ラベルは初期設定で確定値を使用し、用意したアラートは確定足で判定します。
本インジケーターは研究・可視化ツールです。売買指示、将来予測、目標価格、損切り、ポジションサイズ、成績統計、投資助言を提供しません。厚い雲を必ず強い支持抵抗、薄い雲や収縮中の雲を必ずブレイクする状態とは定義していません。 指標