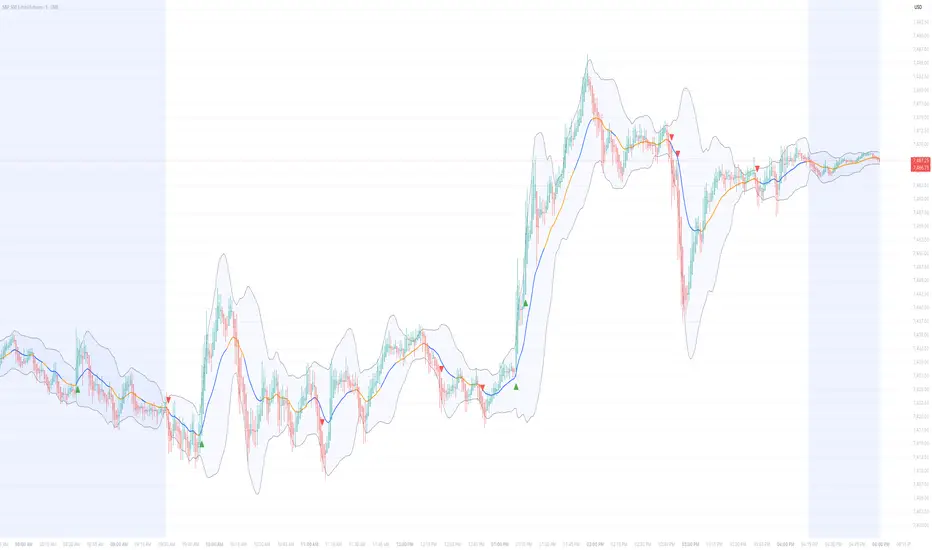
Swing ATR Mean BandsSwing ATR Mean Bands Swing ATR Mean Bands Swing ATR Mean Bands Swing ATR Mean Bands Swing ATR Mean Bands Swing ATR Mean Bands指標由calltech346e提供20
Pure Volume [SkaleHub]Overview Standard volume bars can be incredibly noisy and hard to read. This tool smooths out that data using a built-in moving average line, replacing individual bars with a single, flowing area chart. The Edge It filters out the chop to clearly show whether overall market participation is expanding or contracting, giving you a "pure" read on institutional interest and volume momentum. Key Features: Noise Reduction: Strips away chaotic, alternating volume bars and replaces them with a single指標由SkaleHub提供6
Advanced Precision Bollinger BandsDynamic Basis Alert: The center line turns orange when the bands are in a historical "squeeze" (low volatility). This acts as a visual warning to stop blind mean-reversion trading, as an explosive move is building. Volume Integration: Standard Bollinger Bands fail when price grinds against an outer line on weak volume, convincing traders a trend is starting when it isn't. The green/red triangle signals on this script only fire if the breakout candle is backed by heavy trading volume. Intra-c指標由Captain_Kidd提供3
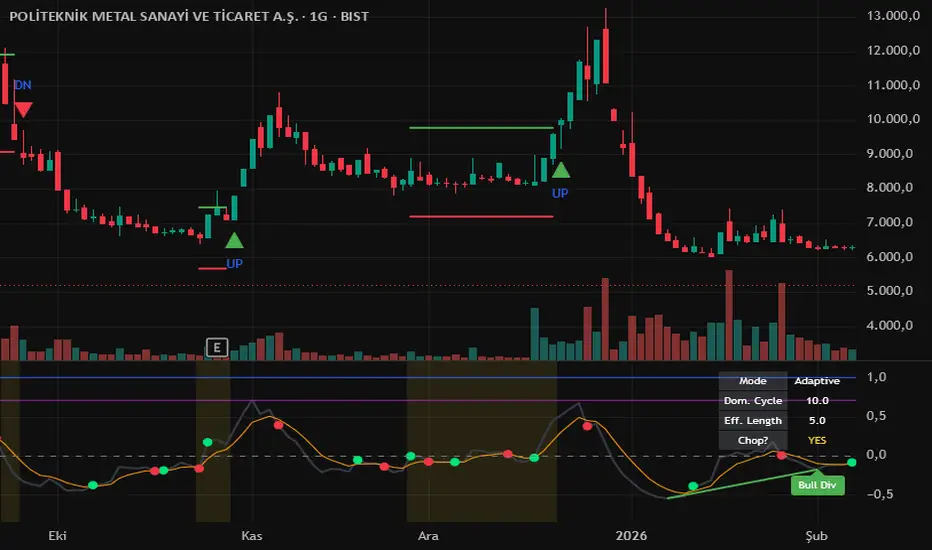
Stable Cycle Core (Adaptive Ehlers Edition)## English **Stable Cycle Core — Adaptive Ehlers Edition** A next-generation cycle oscillator that doesn't rely on a fixed length. Most oscillators (RSI, MACD, Stoch) use a hard-coded period like 14 — which is arbitrary. This script instead **measures the market's actual dominant cycle period in real time** and adapts itself to it. **Engine: Ehlers Autocorrelation Periodogram** Based on John F. Ehlers' work in *Cycle Analytics for Traders*. The pipeline: 1. **High-Pass filter** removes long-t指標由onderarslantas107提供46
DIP TOP OSCILATOR Divergence## English **Stable Cycle Core Chop Filter & Divergence** A clean, lower-panel cycle oscillator built around a normalized momentum of EMA, smoothed by a short signal line. The goal is to read the market's rhythm without the noise of standard oscillators. **How it works** - **Cycle line (black):** EMA momentum normalized by ATR — adapts to volatility automatically, so readings stay comparable across timeframes and instruments. - **Signal line (orange):** Smoothed cycle. Crossovers print **gre指標由onderarslantas107提供22
Volume Participation Curve [JOAT]Volume Participation Curve Introduction VPC Volume Participation Curve is an open-source volume seasonality indicator that compares current volume against historical participation for the same time bucket. It helps answer a simple but important question: is current activity meaningful compared with what usually happens at this time? Instead of treating all volume bars equally, VPC builds recurring buckets by minute, hour, day, or month, then compares live volume against the expected bucke指標由officialjackofalltrades提供23
Hap Elliot [Dual Engine & Projections]Hap Elliot Are you tired of subjective wave counts? Elliott Wave Theory (EWT) is one of the most powerful concepts in technical analysis, but mapping it manually is subjective, time-consuming, and prone to human error. Meet the Hap Elliot indicator—your streamlined, highly effective "magic pill" for Elliott Wave Analysis. We have transformed the complex guidelines of EWT into a strict, easy-to-digest mathematical algorithm. Featuring a unique Dual Engine Pivot System and Nested Sub-Waves, thi指標由agahakanaga提供已更新 22 2.6 K
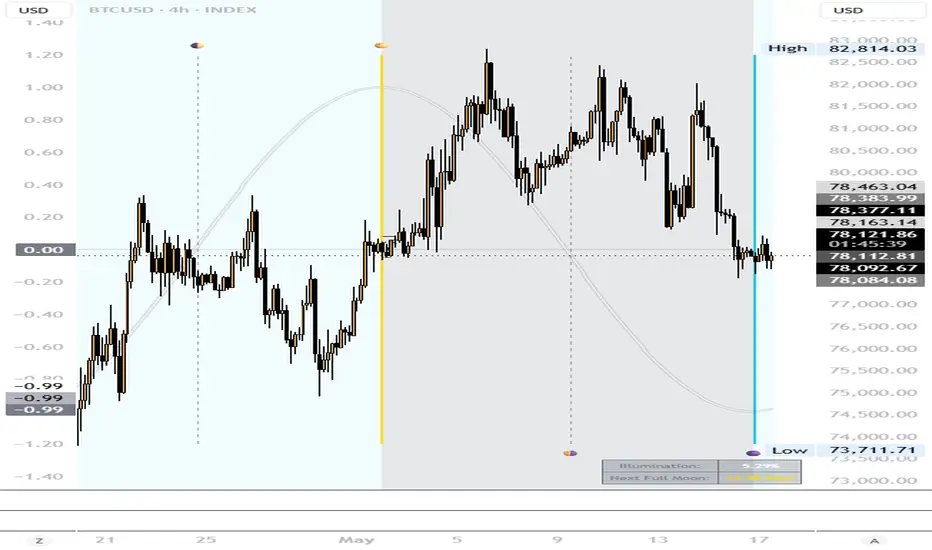
Zfx Lunar Phase Engine Zfx — Lunar Phase Engine This indicator maps the synodic lunar cycle directly onto your price chart using precise astronomical timing. The lunar wave is calculated from a verified new moon epoch and plotted as a smooth sine oscillator on the left scale, allowing you to overlay the natural 29.5-day moon cycle against any market on any timeframe — without cluttering your price action. What it does: - Computes real-time lunar phase (0 = New Moon → 0.5 = Full Moon → 1 = back to New Moon) using th指標由Zfx1471提供26
AetherEdge Adaptive Fibonacci AI🖊️ Overview AetherEdge Adaptive Fibonacci AI is a machine-learning-driven adaptive Fibonacci engine that completely transcends traditional static ratios. A KNN (K-Nearest Neighbors) algorithm extracts the most similar historical regimes from up to 2,000 prior bars and learns which golden ratios actually worked in those analogous conditions. It then probabilistically computes a breakout probability for each level — a revolutionary tool that visualizes "which Fib will hold" as a forward-looking fo指標由AetherEdge提供30
Lunar Momentum Confluence (Moon Phases)Moon Phases Market Indicator 🌙📈 This indicator tracks the phases of the moon and compares them to market behavior to help traders spot potential bullish and bearish momentum shifts. It’s based on the idea that market psychology moves in cycles — just like the moon. How It Works New Moon 🌑 Often signals a market reset or fresh momentum. Traders commonly watch this phase for potential bullish reversals, trend beginnings, or accumulation zones. Waxing Moon 🌒🌓🌔 As the moon grows brighter, market m指標由mattrubino3提供8
Lunar Momentum (Moon Phases)Moon Phases Market Indicator 🌙📈 This indicator tracks the phases of the moon and compares them to market behavior to help traders spot potential bullish and bearish momentum shifts. It’s based on the idea that market psychology moves in cycles — just like the moon. How It Works New Moon 🌑 Often signals a market reset or fresh momentum. Traders commonly watch this phase for potential bullish reversals, trend beginnings, or accumulation zones. Waxing Moon 🌒🌓🌔 As the moon grows brighter, market m指標由mattrubino3提供47
Custom Period PivotsFixed range pivots, all diff calculations of pivots available Fixed range pivots, all diff calculations of pivots available Fixed range pivots, all diff calculations of pivots available Fixed range pivots, all diff calculations of pivots available Fixed range pivots, all diff calculations of pivots available Fixed range pivots, all diff calculations of pivots available指標由calltech346e提供10
Elaris FVG Inversion ProElaris FVG Inversion Pro Advanced Fair Value Gap & Inversion Mapping System Elaris FVG Inversion Pro is a professional-grade market structure and imbalance visualization tool designed to help traders identify fair value gaps (FVGs), inversion fair value gaps (IFVGs), and potential reaction zones directly on the chart. The indicator focuses on price inefficiencies created by aggressive directional movement and highlights areas where price may revisit, react, continue, or reverse. Instead of d指標由ElarisGroup提供68
Candlestick FootprintsThis layer builds the structural backbone of the indicator using confirmed market pivots. Code behavior: ta.pivothigh() detects swing highs ta.pivotlow() detects swing lows Both require confirmation (pivotLen delay), so they are non-repainting but lagging Memory system: The variables: p1, p2, p3, p4 store the last four pivot points in sequence. Each new pivot shifts the structure forward: p1 → p2 → p3 → p4 Purpose: This creates a market structural memory, allowing the system to analyze m指標由onderarslantas107提供26
Online Logistic Forecaster [forexobroker]Online Logistic Forecaster trains a single-feature logistic regression in real time via stochastic gradient descent. The feature is the standardised price-EMA distance; the target is "next bar closes higher". Each bar updates weight w := w - eta * (sigmoid(w * x) - y) * x. Forecast probability of next-bar up = sigmoid(w * x). Adaptive learning without batch training. 🔶 ALGORITHM 1. EMA = ema(close, len); ATR = atr(14). 2. Feature x = (close - EMA) / ATR (ATR-normalised distance). 3. Online SGD指標由forexobroker提供22
Raid & Reverse Liquidity Engine# Raid & Reverse Liquidity Engine A clean and advanced Smart Money Concepts (SMC) indicator built for traders who focus on liquidity sweeps, stop hunts, Fair Value Gaps (FVG), and market structure shifts. This indicator automatically detects Buy-Side Liquidity (BSL) and Sell-Side Liquidity (SSL), identifies liquidity raids using wick-based sweeps, confirms reversals with Market Structure Shift (MSS), and highlights high-probability Fair Value Gap entry zones. Unlike noisy SMC indicators, this指標由Anurag_Sarmah提供49
Bookmap Traps - LiteOverview The Bookmap Traps (Lite) indicator is a highly advanced, machine-learning enhanced volume visualization tool designed to uncover hidden liquidity traps within candlestick wicks. Moving beyond traditional volume indicators, this script employs a synthetic lower-timeframe footprint engine to analyze the microstructure of price action, locating exactly where buyers or sellers have been caught offside. By plotting dynamic, volume-weighted bubbles directly on the chart, it allows traders to指標由drop_trades提供742
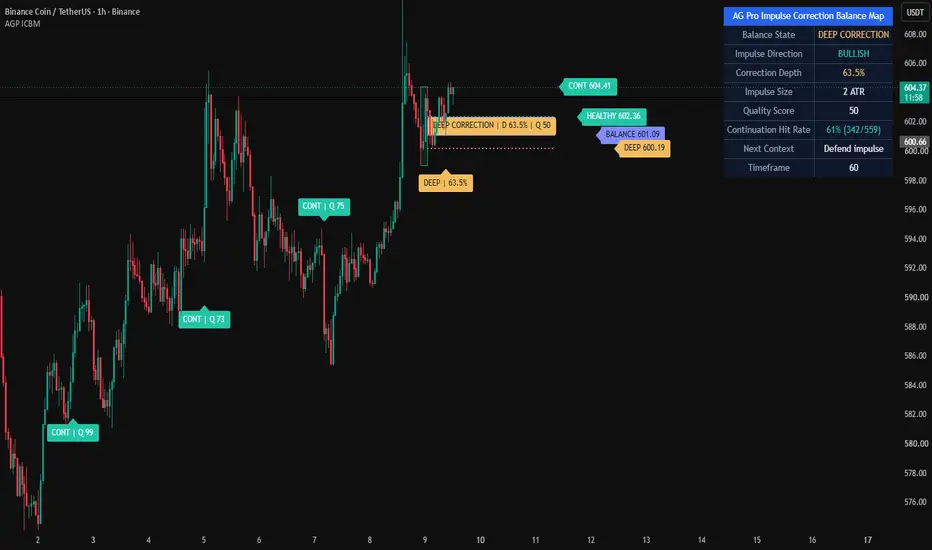
Impulse Correction Balance Map [AGPro Series]Impulse Correction Balance Map 🧠 Core Idea Is the current correction still healthy compared with the prior impulse, or is the impulse losing structural balance? 📌 Overview / What it does Impulse Correction Balance Map is a rule-based impulse and correction visualization tool designed to compare the current pullback with the prior directional swing leg. The script identifies a valid bullish or bearish impulse, measures correction depth, maps the healthy-to-balanced correction pocket, and 指標由AGProLabs提供已更新 53
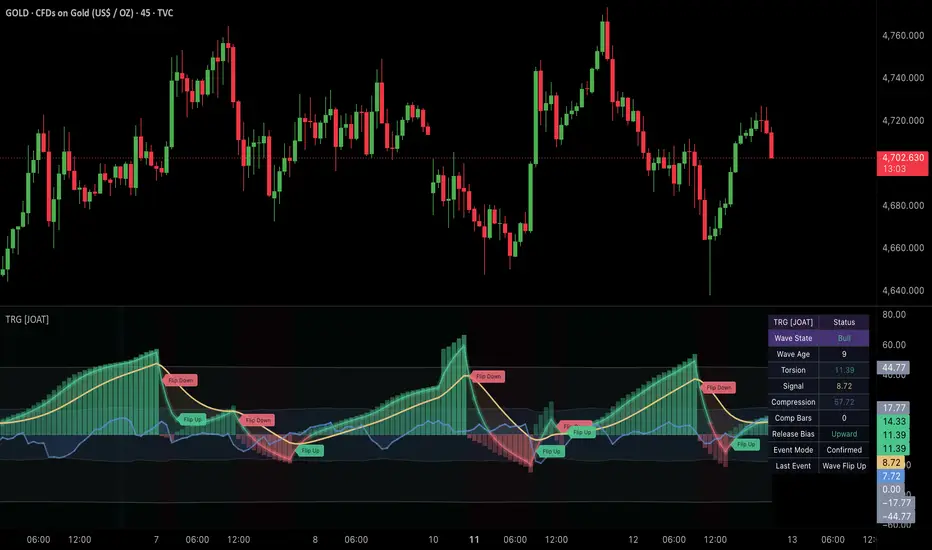
Torsion Range [JOAT]Torsion Range Introduction Torsion Range is an open-source compression, expansion, and wave-energy panel designed to track whether the market is coiling, releasing, trending, or exhausting. The script combines wave direction, weighted energy accumulation, compression scoring, and exhaustion logic into one regime-aware panel. The problem Torsion Range solves is fragmentation between wave tools and volatility tools. Traditional wave studies often ignore whether the market is compressing or 指標由officialjackofalltrades提供46
PRO-Active Move Counter (Points/Ticks) + Avg Candle (Ticks)COMEX_MINI:MGC1! Overview The Active Move Counter is a high-performance momentum and trend-tracking tool designed for intraday traders. Unlike standard range indicators, this script identifies "Legs" of price action and provides a real-time, persistent data readout of the current move’s origin, travel distance, and active strength. The core logic focuses on Move Persistence. It tracks exactly when a trend "flips" and anchors a starting point, allowing you to see how much "Net Push" the market指標由cieraseller提供312
AGT LevelsAGT Levels is a custom volume-profile-based support and resistance tool designed to highlight key High Volume Nodes and Low Volume Nodes directly on your chart. Instead of using standard horizontal levels, this indicator builds a full right-side volume profile from the same data used to calculate the levels. The profile is plotted to the right of price and faces back toward the chart, making it easier to see where volume has built up and where price may react. The main idea is simple: High Vo指標由MrWickTrading提供75
Cartograph Bands [JOAT]Cartograph Bands Introduction Cartograph Bands is an open-source price-space mapping overlay that translates internal momentum and regime pressure into adaptive bands around price. Instead of displaying momentum in a separate pane and forcing the user to mentally translate it back into price context, the script projects a composite regime score directly into layered price envelopes. The problem Cartograph Bands solves is disconnected interpretation. Oscillators can show strength or weakne指標由officialjackofalltrades提供16
LZ VWAP + TWAP Fusion BY LZ VWAP TWAP Fusion — LZ Indicateur de lecture directionnelle basé sur la combinaison du VWAP et du TWAP. Le VWAP représente le prix moyen pondéré par le volume. Il permet d’identifier les zones où le marché a réellement échangé avec du volume, souvent utilisées comme zones d’équilibre institutionnelles. Le TWAP représente le prix moyen pondéré par le temps. Il donne une lecture plus stable du prix moyen, indépendante des variations brutales de volume. Cet indicateur affiche : - le VWAP - le TW指標由diablos9741313提供18