Trading Is a Business, Not a CasinoA lot of traders say they want to become consistent, but their behaviour looks more like gambling than business. They enter trades without a real plan, increase size after losses, chase moves because they feel they missed out, and risk too much because they want results immediately. That is not professional trading. That is casino behaviour with a chart in front of it.
Trading should be treated like a business. A real business has costs, rules, margins, risk limits, data, and a process. It does not survive by hoping that the next decision will fix everything. Trading is the same. One trade should never decide your future, destroy your account, or completely change how you think.
Gamblers Think About the Next Win
A gambler is focused on the next outcome. “Will this trade win? Can I make back my loss today? Can this setup change everything?” That mindset puts too much pressure on one position. If the trade wins, the trader feels too confident. If it loses, they feel the need to recover immediately. This is usually where revenge trading starts.
A business-minded trader thinks differently. They understand that one trade is only one transaction in a much bigger process. Some trades will win, some will lose, and some days will offer nothing worth taking. The goal is not to win every single trade. The goal is to make good decisions repeatedly and survive long enough for the edge to play out.
Every Trader Needs Operating Rules
Every serious business knows its limits. It knows how much it can spend, how much it can risk, and what kind of decisions are not acceptable. Traders need the same structure. Before entering a trade, you should already know your entry, invalidation, stop loss, position size, maximum loss, and reason for taking the setup.
If those things are not clear, the trade is probably not ready. Most bad trades do not start with the candle. They start before the entry, when the trader has no clear plan and is already emotionally involved. A trader without rules will always be controlled by the market. A trader with rules has something to return to when the market becomes uncomfortable.
Risk Management Is the Business Model
In trading, risk management is not just protection. It is the business model. If you risk too much, even a good strategy can fail. Losing streaks are normal, but oversized losses make them impossible to survive. A trader who risks 10% per trade does not need many mistakes to damage the account badly. A trader who risks smaller amounts has time to collect data, improve execution, and let the system work.
This is even more important in crypto. Crypto can move fast. A clean setup can turn into a liquidation wick. News, low liquidity, and sudden volatility can change the situation in minutes. If your position size is too aggressive, normal market movement becomes dangerous. Professional traders do not only ask, “How much can I make?” They ask, “How much can I lose if I am wrong?”
Professional Trading Often Looks Boring
Casino-style trading looks exciting. Big leverage, huge screenshots, fast gains, emotional wins, and dramatic losses always get attention. But attention does not build consistency. In reality, good trading is often boring. You wait for your setup. If it is not there, you do nothing. If it appears, you execute. If it loses, you accept it. If it wins, you do not suddenly abandon the plan.
That sounds simple, but most traders struggle with it because they want the market to give them action. They open the chart and feel like they need to do something. But trading is not paid by activity. It is paid by quality decisions. Sometimes the most professional trade is no trade at all.
A Business Tracks Performance
Mubite: A gambler remembers emotions. A trader tracks data. That means reviewing your trades, checking your win rate, average winner, average loss, risk-to-reward, best conditions, worst conditions, and most common mistakes. Without data, traders usually judge themselves only by recent results. One good week and they think they mastered the market. One bad week and they want to change the whole strategy.
A journal shows the truth. Maybe your strategy works, but you exit winners too early. Maybe your entries are fine, but most losses come after revenge trading. Maybe you trade well during certain sessions and badly when the market is slow. Once you see the pattern, you can fix the process. Without tracking, you are just guessing.
Capital Makes Discipline Even More Important
When traders get access to larger capital, this business mindset becomes even more important. A 5% return on a $1,000 account is $50. The same 5% on a $100,000 account is $5,000 before profit split. The percentage is the same, but the impact is completely different.
That is why funded trading exists. Crypto prop firms like Mubite give traders access to capital so their skill can matter on a larger scale. But bigger capital does not mean you should gamble bigger. It means the opposite. More capital should create more discipline, because now your process has real weight behind it.
If a trader treats a funded account like a casino, the account will not last. If they treat it like a business, they give themselves a real chance to grow.
Final Thought
Trading is not about one lucky trade. It is not about doubling size after a loss, chasing every candle, or trying to turn one position into a life-changing result. That mindset may feel exciting, but it is not sustainable.
Trading is a business. Your risk is your cost. Your edge is your product. Your journal is your accounting. Your discipline is your management. Your capital is your inventory.
If you treat the market like a casino, sooner or later the market will treat you like a gambler. But if you treat trading like a business, you give yourself something most traders never build: a process that can survive long enough to improve.  Education
Why One Paper-Trading Screenshot Cannot Prove an EdgeA profitable paper-trading screenshot can be useful evidence, but it answers a much smaller question than most traders assume.
It can show that a workflow ran. It can show the instruments watched, the number of trades, the account state, and the recorded outcome. It cannot, by itself, establish a repeatable edge.
The seven questions behind one screenshot
Before treating a paper result as meaningful, ask:
1. Sample size: How many independent trades and market regimes are represented?
2. Selection: Were losing and ordinary sessions published with the same frequency?
3. Execution: Were realistic spreads, slippage, fees, latency, and partial fills modeled?
4. Capacity: Would the same orders fill at the displayed size in the relevant liquidity?
5. Risk: What were maximum drawdown, concentration, and time exposed?
6. Benchmark: Did the process add value versus a simple benchmark after risk and costs?
7. Reproducibility: Were the rules fixed before the session, or adjusted after seeing the outcome?
What paper trading is actually good for
Paper trading is strongest as a process test. It can reveal whether a trader or system follows entry rules, sizes consistently, manages exits, records decisions, and behaves correctly when nothing happens.
That is valuable. A system that cannot execute its own rules cleanly on paper is not ready for live capital.
But passing the process test is not the same as proving live profitability. Live markets add queue position, liquidity constraints, changing spreads, rejects, disconnects, fees, and emotional pressure.
A better evidence ladder
Evaluate trading evidence in stages:
• documented rules before the test;
• complete paper-session logs, including losses and inactivity;
• repeated results across regimes;
• realistic cost and fill assumptions;
• small, bounded live validation;
• a complete distribution rather than selected screenshots.
The right conclusion from one winning paper session is not “the edge is proven.” It is: “the process completed once; now inspect the rules, the risk, and the full history.”
Educational only. Paper trading is hypothetical, live execution can differ materially, and trading involves risk of loss.
 Education
How Can One Institution Buy $1 Billion Without Moving the MarketWhen a retail trader buys one lot of EUR/USD or a few shares of a stock, the market barely notices. The order is so small that it gets matched almost instantly. But what happens when a large institution wants to buy $1 billion worth of an asset? Surely placing such a massive order should send the price soaring. Surprisingly, it usually doesn't.
The reason is simple. Institutions cannot afford to move the market against themselves. If they bought everything at once, they would push the price higher with every order, forcing themselves to pay more and more. Instead of rushing into the market, they use a completely different approach, one that is built on patience, planning, and liquidity.
Every Big Trade Has a Big Problem
The biggest challenge for an institution is not deciding what to buy. The real challenge is finding enough sellers.
Every trade needs two sides. If an institution wants to buy $1 billion worth of an asset, someone else must be willing to sell the same amount. At a single price level, there are usually not enough sell orders available. If the institution keeps buying aggressively, it quickly consumes all the available liquidity and forces the price higher.
For this reason, the goal is not just to buy. The goal is to buy without significantly changing the market price.
Why Institutions Never Buy Everything at Once
Imagine trying to fill a swimming pool using one huge bucket of water. It would create a massive splash and waste a lot of water. Using a smaller bucket repeatedly is much more controlled.
Institutions think the same way. Instead of placing one enormous order, they divide it into hundreds or even thousands of smaller orders. These orders are executed over time, allowing them to build a large position while keeping the market relatively stable.
To retail traders, nothing unusual seems to be happening. Behind the scenes, however, billions of dollars may already be changing hands.
Why the Market Suddenly Stops Moving
Many traders become impatient when price starts moving sideways. They assume the market has become weak or directionless.
In reality, a ranging market is often where institutions do most of their work. While price moves back and forth within a relatively small range, large buyers and sellers continue exchanging positions. This allows institutions to accumulate their positions without causing dramatic price movements.
What appears to be a quiet market is often one of the busiest periods for institutional activity.
Why False Breakouts Happen
Sometimes there simply isn't enough liquidity inside the range. Institutions still need more sellers before completing their buying.
As price moves above resistance or below support, many retail traders react immediately. Some enter breakout trades, while others have their stop losses triggered. These new market orders provide fresh liquidity for institutions to continue executing their positions.
To retail traders, this looks like a genuine breakout. But in many cases, it is simply a temporary move created by the market searching for additional liquidity. Once enough orders have been filled, price may return back into the range before eventually moving in its intended direction.
The Real Move Begins
By the time the market finally breaks out and starts trending strongly, institutions have often completed most of their buying. Retail traders see the breakout as the beginning of the move, but for institutional traders, the important work happened much earlier during the accumulation phase.
This is why experienced traders often pay close attention to consolidation rather than only focusing on breakouts. The strongest trends are frequently built during the quietest period
My Thoughts
Institutions do not have a secret button that allows them to buy billions without affecting price. Instead, they solve a liquidity problem through patience, order splitting, and careful execution. They accumulate positions gradually, take advantage of periods of consolidation, and sometimes wait for liquidity to appear before completing their trades.
The next time you see a market moving sideways, don't assume nothing is happening.
Sometimes, the quietest charts are where the biggest players are making their biggest decisions.
@BrightRally_Research on @TradingView Education 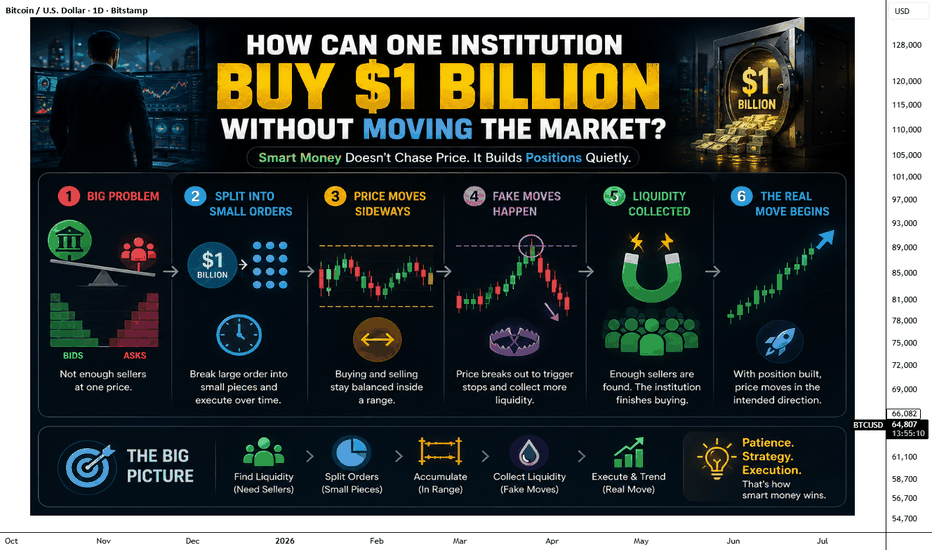
The Market Is an Auction, Not a Casino"The moment you stop treating the market like a game of luck, you'll start seeing it as a process of price discovery."
Many people describe the financial markets as a casino. At first glance, it seems like a fair comparison—prices move every second, outcomes are uncertain, and people either make money or lose it.
But this comparison misses one fundamental truth.
A casino is designed so that the house always has a mathematical edge. Every game is built around fixed odds, and over time, the casino is expected to win.
The market doesn't work that way.
Financial markets operate as a continuous auction. Every tick on your chart represents an agreement between a buyer who believes an asset is worth more and a seller who believes it's worth less. Price moves not because of luck, but because of the constant negotiation between supply and demand.
When buyers become more aggressive than sellers, prices rise. When sellers are willing to accept lower prices to exit their positions, the market falls. Every candle reflects this ongoing battle to determine fair value.
This perspective changes the way you analyze charts.
Instead of asking, "Will price go up or down?", ask yourself:
• Is buying pressure increasing or fading?
• Where is demand entering the market?
• Where are sellers defending price?
• Has the market accepted this price, or is it searching for a new value?
These questions reveal far more than simply chasing green and red candles.
Successful traders don't try to predict every move. They observe how the auction unfolds, identify areas where buyers and sellers are likely to interact, and wait patiently for the probabilities to shift in their favor.
Markets reward preparation, discipline, and consistency not random guesses.
The next time you open a chart, remember that you're not watching a game of chance.
You're watching millions of participants negotiate value in real time.
Understanding that difference can completely change the way you read price action.
The market isn't a casino.
It's the world's largest auction, happening one trade at a time.
"Do you read charts as random price movements, or as an auction between buyers and sellers? Share your perspective below." Education 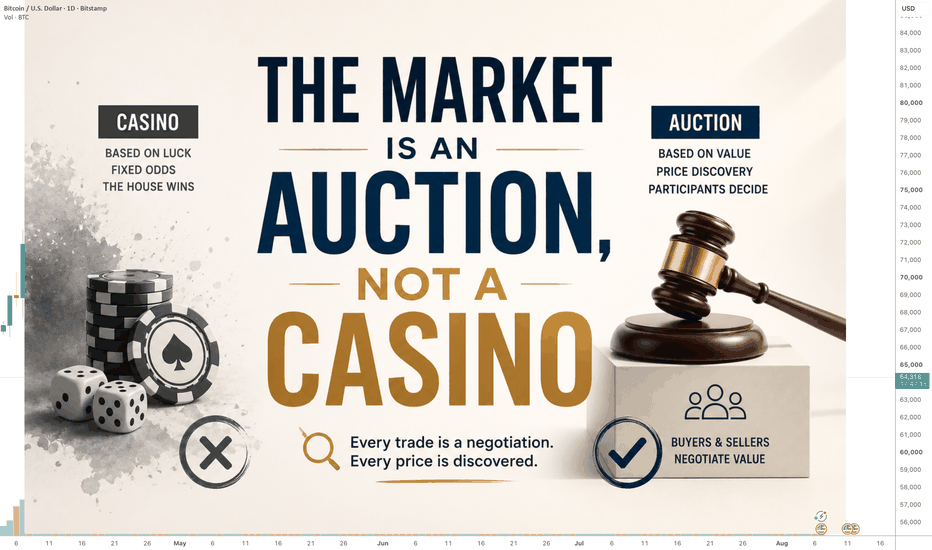
Paper Trading Should Test the Process, Not the P&LMost paper-trading reviews begin with the ending balance. That is the least transferable part of the exercise.
A useful paper test should evaluate a repeatable decision process:
1. **Universe definition** — Which instruments were eligible before the session began?
2. **Entry evidence** — Which observable conditions had to agree?
3. **Risk budget** — What was the maximum planned loss before entry?
4. **No-trade conditions** — Which missing or conflicting signals blocked a position?
5. **Monitoring rule** — What evidence would support holding, reducing, or exiting?
6. **Stop condition** — What market, time, or data-quality event ended the setup?
7. **Auditability** — Can the decision be reconstructed after the close without rewriting the thesis?
Paper results cannot reproduce every live fill, spread, queue position, fee, latency, liquidity constraint, or market-impact effect. A strong hypothetical P&L can therefore coexist with a weak process.
The more useful question is: **Did the method remain coherent when the preferred trade was unavailable, the signal weakened, or the market moved before entry?**
For the next SPY session, define the invalidation and no-trade conditions before the open. At the close, score adherence separately from return. A losing but well-executed test may teach more than a profitable trade that violated its own rules.
Educational only. Paper performance is hypothetical and trading involves risk. Education 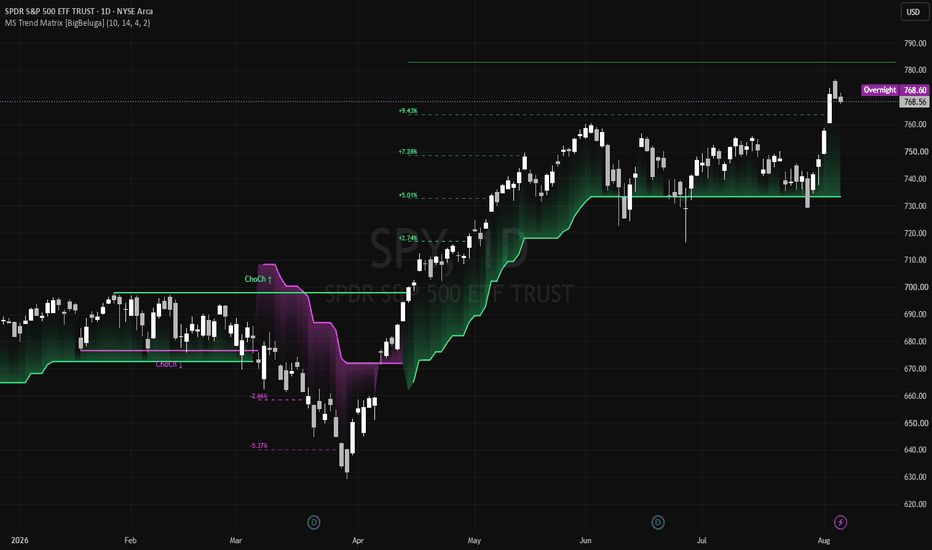
How to Test a Trading System's Escape PathsA stop control should be evaluated in the states that make a trader need it: expired authorization, a runner error, a risk halt, unavailable market data, an interrupted network, or incomplete cleanup.
Testing only the healthy path answers the easiest question. A recovery test deliberately removes those assumptions.
BUILD A FAILURE-STATE MATRIX
For each state, record four separate observations:
1. Is the session still active or holding resources?
2. Is the recovery action visible and reachable?
3. Does the action change the underlying state?
4. Can the result be confirmed from an independent surface?
Visible, reported success, and recovered are not interchangeable. A control can render inside an unreachable region. A request can return success while stale state persists.
FIVE PRACTICAL TESTS
1. Expire authorization
Use a paper environment and let credentials expire or revoke them intentionally. Confirm that Stop, reset, and account-release paths remain available even though ordinary routing is disabled.
2. Force an execution error
Create a controlled error before an order is submitted. The system should fail closed, preserve an audit trail, and still expose recovery.
3. Remove the data dependency
Make the current price unavailable. Verify that the system refuses to size from a missing or stale value. A failed read is not a valid price.
4. Interrupt cleanup
Break the connection before cleanup begins. Retry recovery and check whether stale locks, sessions, or account associations remain.
5. Verify independently
After stopping or removing state, reload from another device, session, or administrative surface. A local success message is not proof of persistent cleanup.
INVALIDATION AND LIMITS
Passing this matrix does not prove that every future failure is safe. It shows only that the tested states preserved recovery under the tested conditions. Broker services, networks, exchanges, market data, and order states can fail in combinations the matrix does not cover.
Keep independent broker access, conservative sizing, capital and loss limits, monitoring, reconciliation, and a manual exit procedure. Practice the procedure in paper conditions before relying on it.
Educational material only. Not investment advice, a price forecast, or a performance claim. Trading can result in partial or total loss of capital.  Education
How One Interest Rate Decision Moves the Entire Economy?The Domino Effect of Interest Rates:
Most traders know that interest rate announcements can move the market, but very few understand why they have such a powerful impact. An interest rate decision does not only affect banks or currencies. It creates a chain reaction that spreads through the entire economy. Just like a row of dominoes, one small action can trigger a series of events, with each event leading to another. By understanding this chain reaction, traders can better understand why markets behave the way they do.
The First Domino
Every chain reaction begins with a single domino, and in the economy, that first domino is the central bank. Institutions such as the Federal Reserve or the European Central Bank change interest rates to keep the economy balanced. If inflation is rising too quickly, they usually increase interest rates to slow spending. If the economy is weak, they lower interest rates to encourage borrowing and investment.
Although changing an interest rate may seem like a simple decision, it is often the starting point of much larger economic changes. One announcement from a central bank can influence millions of people, thousands of businesses, and financial markets around the world.
Borrowing Becomes More Expensive
When interest rates rise, borrowing money becomes more expensive. Banks charge higher interest on mortgages, business loans, and personal loans, which means people have to pay more to borrow the same amount of money. Businesses also face higher financing costs when they want to expand or invest in new projects.
Because borrowing is no longer as affordable, both consumers and businesses become more cautious with their money. This is the second domino in the chain, and it begins slowing economic activity.
Consumer Spending Slows
As loans become more expensive, people naturally begin spending less. Some families delay buying a new home, others postpone purchasing a new car, and many reduce spending on non-essential items. Instead of taking on new debt, they focus more on saving and managing their finances carefully.
When millions of people make these decisions at the same time, overall demand in the economy starts to decline. Businesses begin noticing fewer customers and lower sales, even though nothing has changed about their products.
Businesses Feel the Impact
Businesses rely on consumer spending to generate revenue. When customers spend less, companies often experience slower sales and lower profits. Expansion plans may be delayed, investments may be reduced, and companies become more careful about their future decisions.
This slowdown is not because businesses suddenly become less efficient. It is simply a result of fewer people buying goods and services. The effects of higher interest rates have now spread from consumers to businesses.
Hiring Begins to Slow
As businesses earn less, they also become more cautious about hiring new employees. Instead of expanding their workforce, many companies decide to freeze recruitment until economic conditions improve. Some businesses may even reduce staff to lower their operating costs.
With fewer job opportunities available, income growth across the economy begins to slow. This causes consumers to spend even less, allowing the domino effect to continue.
Inflation Starts to Fall
One of the main reasons central banks raise interest rates is to reduce inflation. When borrowing decreases and spending slows, demand for goods and services begins to fall. Since fewer customers are competing to buy the same products, businesses find it harder to keep increasing prices.
This gradual reduction in demand helps bring inflation back under control. Although the process can take several months, it is the outcome central banks are trying to achieve when they increase interest rates.
The Currency Becomes Stronger
Higher interest rates often attract foreign investors because they can earn better returns on savings and government bonds. Before investing, these investors need to buy the country's currency, increasing demand for it in the foreign exchange market.
As demand for the currency increases, its value often rises against other currencies. This is one of the main reasons why Forex traders pay close attention to every interest rate decision made by central banks.
My Thoughts:
An interest rate decision is much more than a number announced by a central bank. It is the first domino in a long chain of economic events. Higher rates make borrowing more expensive; expensive borrowing reduces spending; lower spending affects businesses, businesses slow hiring, inflation begins to cool, and currencies often become stronger. Every step leads naturally to the next.
The next time you hear that a central bank has changed interest rates, don't just focus on the immediate market reaction. Instead, think about the entire chain of events that has just begun. Understanding the domino effect can help you understand not only today's market movement, but also the economic story that will continue unfolding in the weeks and months ahead.
By @BrightRally_Research on @TradingView  Education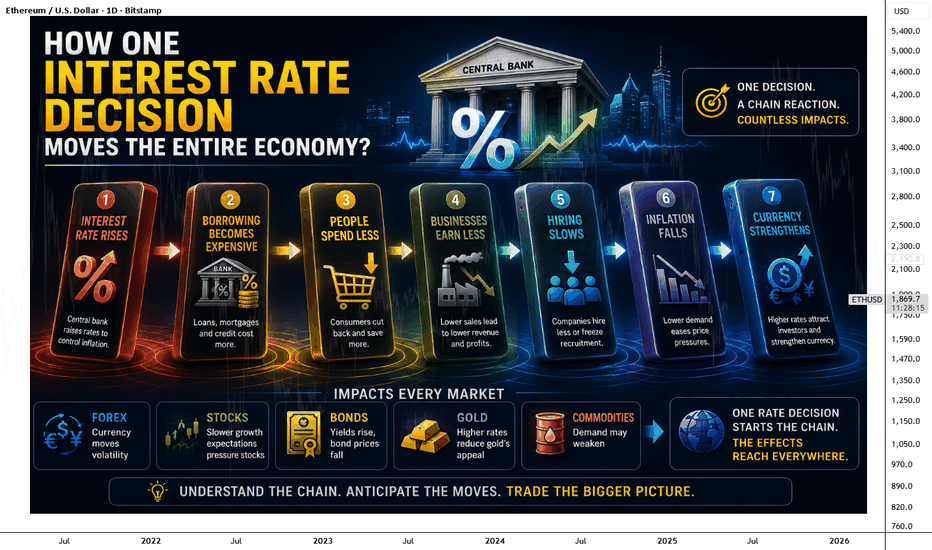
How to Read One Inflation Print Without Predicting RatesA monthly inflation release should be treated as an observation that updates a scenario—not as a complete rate forecast or a directional trade signal.
1. Separate the headline from its driver
June headline CPI fell 0.4% month over month. Energy fell 5.7% and was the largest contributor to the decline. The first question is not “bullish or bearish?” It is “what produced the move, and what would have to persist?” A volatile component can begin a durable trend; it can also reverse.
2. Check the core and the second gauge
Core CPI was unchanged month over month and up 2.6% year over year. The PCE price index fell 0.1% month over month, while core PCE rose 0.1% month over month and 3.3% year over year. CPI and PCE use different weights and methods. Agreement increases confidence; divergence identifies what still needs explanation.
3. Read the policy distribution
The July 29 FOMC decision held the target range at 3.50%–3.75% by a 9–3 vote. The three dissenters preferred a 25-basis-point increase. That vote is a snapshot, not a promise about the next meeting. It shows why one negative monthly print should not be translated directly into an easing consensus.
4. Write confirmation and invalidation conditions
A disinflation interpretation becomes stronger if multiple core readings remain subdued, cooling broadens beyond volatile categories, labor demand weakens materially, and policy language plus the vote distribution become less restrictive.
It becomes weaker if energy rebounds, core services or shelter regain momentum, growth remains firm while inflation persistence returns, or the policy distribution shifts tighter.
5. Keep the chart subordinate to the process
The chart shown is illustrative only. Do not use the next candle to “prove” a macro story or turn this tutorial into a prediction about the displayed symbol. Mark the release time, define the horizon, and keep size, liquidity, and exit rules separate from the narrative.
Educational sequence: driver → persistence → cross-check → policy distribution → invalidation. A new data point can change scenario weights. It should not remove risk controls.
Educational only. This tutorial is not investment advice, a rate forecast, or a directional price prediction. Economic data can be revised or superseded, policy conditions change, and trading involves risk.
Sources: U.S. Bureau of Labor Statistics, U.S. Bureau of Economic Analysis, and the Federal Reserve Board; releases current through August 2, 2026. Education 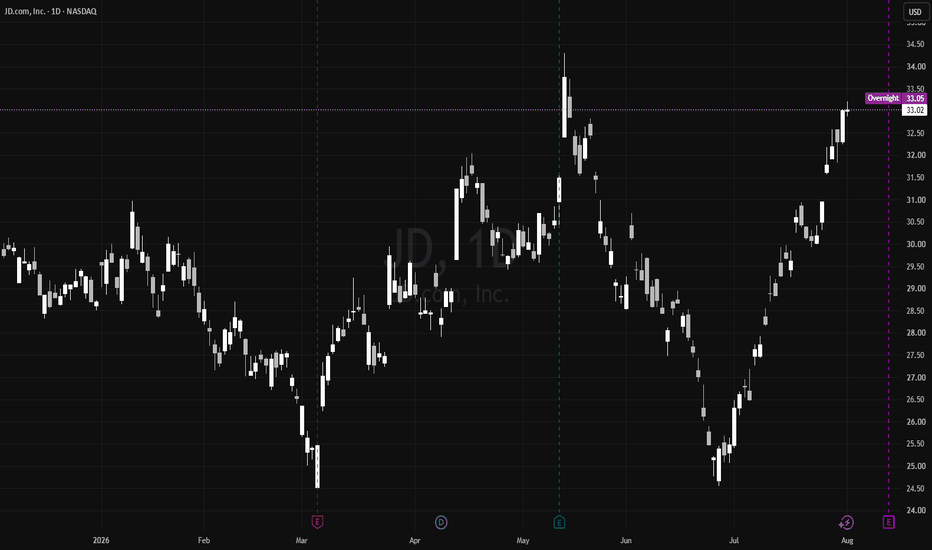
Why Traders Repeat Mistakes They Already UnderstandMost traders do not need another warning that chasing, oversizing, moving stops, or revenge trading can damage an account. The harder problem is retrieving the correct behavior while the decision is emotionally charged.
That is the difference between a rule you can explain and a rule you can execute.
THE KNOWLEDGE-ACTION GAP
After a painful trade, the lesson feels obvious. A few days later the emotional memory weakens. When a similar setup appears, urgency takes over and the old response returns.
A journal entry can preserve the event, but an archive alone does not create a review habit. The useful unit is a short, observable rule that can be rehearsed before the next trigger.
Vague: “Stop revenge trading.”
Observable: “After two consecutive losses, stop for 30 minutes and do not increase size on the next trade.”
Vague: “Do not chase.”
Observable: “If price moves more than 0.5% beyond my planned entry, wait for a new setup.”
A FIVE-MINUTE REVIEW LOOP
After a meaningful trade, write four lines:
1. Trigger: What market condition or emotion appeared?
2. Action: What did you actually do?
3. Consequence: What did the action cost or protect?
4. Next rule: What observable response should happen next time?
Review the newest rules daily while they are still relevant. Older rules can be reviewed less often after the response becomes consistent.
Do not review only losses. Reinforce good process too: waiting for confirmation, respecting an invalidation level, reducing size when uncertainty rises, refusing a low-quality setup, and ending the session after a predefined loss limit.
This prevents a common mistake: learning only from P&L. A winning trade can contain bad process, and a losing trade can contain excellent process.
ADD THE RULE BEFORE THE ORDER
Before entering, ask:
• Is this the planned setup or a reaction to recent P&L?
• Is the size inside the original risk budget?
• What price or event invalidates the thesis?
• What behavior would make this trade unacceptable even if it later wins?
The goal is not to remove emotion. It is to make the correct response easier to retrieve while emotion is present.
No review system guarantees better results, and risk limits remain essential. But a specific rule, rehearsed repeatedly, is more actionable than a promise to “be disciplined next time.” Education 
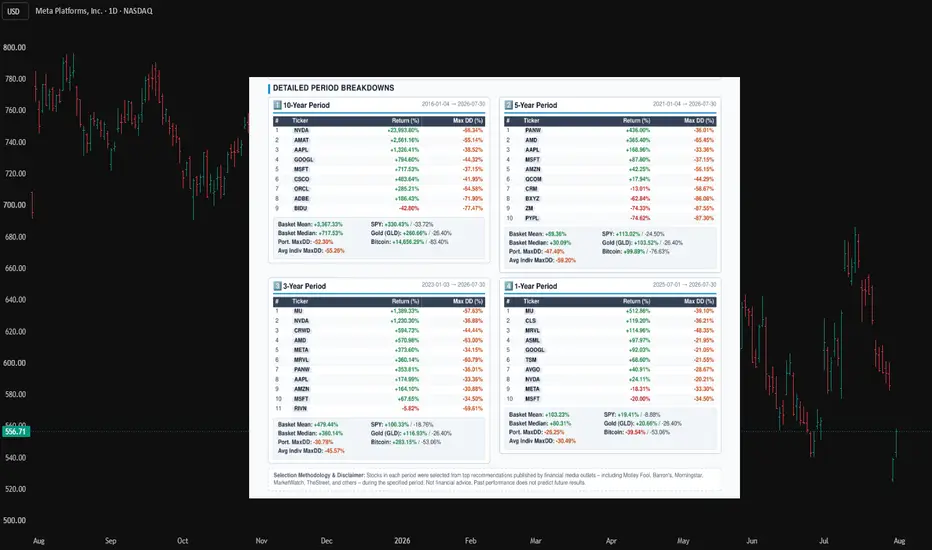
Multi-Period Study: Tech Stocks vs. Gold, Bitcoin & S&P 500 🎯 Objective
This study evaluates how **consensus technology stock recommendations** from leading financial publications performed across four different investment horizons compared with three widely followed benchmarks:
- 📈 S&P 500
- 🥇 Gold
- ₿ Bitcoin
Four historical recommendation baskets (approximately **10-year, 5-year, 3-year, and 1-year**) were constructed and evaluated using two investor-focused performance metrics:
- Total Return** (including dividends where applicable)
- Maximum Drawdown** (largest peak-to-trough decline)
The objective was to evaluate not only which investments generated the highest returns, but also the level of risk investors experienced while achieving those returns.
---
🛠️ Methodology
1. Basket Construction
For each investment period, technology stocks were selected from recommendations published by leading financial publications and research platforms *(e.g., Motley Fool, Barron's, Morningstar, MarketWatch, TipRanks, and Seeking Alpha)* near the beginning of each period. Stocks were ranked by recommendation frequency across multiple sources to produce a consensus basket. Selections were independently cross-checked to ensure consistency.
2. Performance Measurement
Each basket was evaluated from its respective start date through a common end date using:
* Total Return** based on adjusted closing prices *(including dividends and splits)*.
* Maximum Drawdown**, measuring the largest decline from a previous peak.
* An **equal-weight buy-and-hold portfolio** was created for each basket to measure overall portfolio-level performance and drawdown.
3. Benchmarks & Data
* Benchmarks:** S&P 500, Gold, and Bitcoin over the exact same investment windows.
* Data Source:** Historical market data obtained from Yahoo Finance and processed via Python in Google Colab using a consistent, reproducible framework.
---
📈 Results
✅ Return: Basket vs. Benchmarks
- 🚀 **2016 Basket:** Mean return **+3,367%**, comfortably outperforming the **S&P 500 (+330%)** and **Gold (+261%)**, although Bitcoin produced an extraordinary **+14,656%**. NVIDIA (+23,994%) accounted for much of the basket's exceptional performance.
- ⚠️ **2021 Basket:** Mean return **+89%**, underperforming both the **S&P 500 (+113%)** and **Gold (+104%)**. This was the only period where consensus technology selections failed to beat a passive index, largely due to severe declines in PayPal, Zoom and Block.
- 🏆 **2023 Basket:** Mean return **+479%**, decisively outperforming the **S&P 500 (+100%)**, **Gold (+117%)**, and **Bitcoin (+283%)**, making it the strongest overall basket in the study.
- 📈 **2025 Basket:** Mean return **+103%**, substantially outperforming both the **S&P 500 (+19%)** and **Gold (+21%)**, while Bitcoin declined **−40%** over the same period.
---
⚠️ Risk: Maximum Drawdown & Diversification
- ✅ The **largest diversification benefit** occurred in the **2021** and **2023** baskets, where the portfolio's maximum drawdown was **11.8** and **14.8 percentage points** smaller than the average drawdown of the individual stocks.
- ⚠️ Every technology basket experienced a **larger maximum drawdown** than the S&P 500 over the same investment period, demonstrating that higher returns required accepting greater volatility.
- 🥇 Gold produced the **same maximum drawdown (-26.4%)** across all four investment windows because its largest decline occurred entirely within **Jan–Jul 2026**.
- ₿ Bitcoin's maximum drawdown depended heavily on the observation window:
- **−83.4%** (2017–18 crash) appears only in the 10-year study.
- **−76.6%** (2021–22 crash) appears in windows of approximately five years or longer.
- Shorter windows capture only the more recent **−53.1%** correction (Oct 2025–Jun 2026).
---
## ⭐ Durable Favorites
Several companies appeared repeatedly across multiple recommendation periods:
- 🍎 Apple — 2016, 2021, 2023
- 🪟 Microsoft — All four baskets
- 🚀 NVIDIA — 2016, 2023, 2025
- 💾 Marvell Technology — Two baskets
- 🔒 Palo Alto Networks — Two baskets
---
🏆 Biggest Winners
- 🚀 **NVIDIA (2016):** **+23,994%**, the highest return in the entire study despite experiencing a **−66.3%** maximum drawdown.
- 💾 **Micron Technology:** Ranked #1 in both the **2023 (+1,389%)** and **2025 (+513%)** baskets.
- 🛡️ **CrowdStrike:** Returned **+595%** over three years despite a major outage-related setback and a **−44.4%** maximum drawdown.
---
❌ Biggest Disappointments
- 📉 **PayPal, Zoom and Block (2021):**
- Returns between **−63%** and **−75%**
- Maximum drawdowns between **−86%** and **−88%**
- Worst combination of return and risk in the entire study.
- 📉 **Baidu (2016):**
- Return: **−43%**
- Maximum Drawdown: **−77%**
- 📉 **Rivian (2023):**
- Return: **−6%**
- Maximum Drawdown: **−70%**
---
📌 Conclusion
Across four investment horizons, consensus technology stock recommendations generally outperformed traditional benchmarks, beating both the **S&P 500** and **Gold** in **three of the four** study periods.
The principal exception was the **2021 basket**, which was assembled near the peak of the post-pandemic growth-stock cycle. As interest rates increased and market leadership shifted, many high-growth technology companies experienced substantial valuation contractions, causing the basket to underperform the S&P 500.
In contrast, the **2023 basket** benefited from the powerful technology-led bull market driven by artificial intelligence and semiconductor demand, producing the strongest broad-based outperformance of the study.
The results also demonstrate the importance of **diversification**. Although individual technology stocks frequently experienced severe drawdowns, equal-weighted baskets consistently reduced portfolio risk relative to holding individual stocks alone.
Nevertheless, superior returns were accompanied by **higher volatility**. Every technology basket experienced a larger maximum drawdown than the S&P 500 over the corresponding investment period, illustrating that higher long-term returns required accepting substantially larger interim losses.
Several companies—including **Microsoft, NVIDIA, Apple, Micron Technology, and Palo Alto Networks**—appeared repeatedly across multiple recommendation periods, suggesting persistent analyst conviction across changing market environments. However, the study also highlights that consensus recommendations are not infallible, with companies such as **PayPal, Zoom, Block, Baidu, and Rivian** producing poor long-term outcomes.
Overall, the findings suggest that a diversified basket of consensus technology recommendations has historically been a competitive long-term investment approach. However, investment outcomes remain highly dependent on the prevailing market regime: post-bubble corrections and rising interest rates can significantly impair performance, while innovation-driven bull markets can create exceptional opportunities for technology leaders.  Education
Four-Line Earnings Test: Revenue, Profit, Capex, CashFast revenue growth can be real and still be incomplete evidence.
When a company is funding a large infrastructure cycle, the useful question is not only whether demand is growing. It is whether demand is converting into operating profit and durable cash generation after the capital bill.
Use this four-line earnings test.
1. Demand
Look for the narrowest reported line that supports the growth story: a product or segment revenue figure; customer usage that reconciles with revenue; backlog or contracted demand with clear timing; and management commentary consistent with the financial statements. Avoid treating announcements, benchmarks, or market-size estimates as booked revenue.
2. Operating conversion
Ask whether growth reaches segment profit or operating margin. Revenue can accelerate while operating income falls if costs rise faster. Separate infrastructure, depreciation, research spending, legal charges, severance, and other one-offs before forming an interpretation.
3. Capital absorption
Reconcile operating cash flow to purchases of property and equipment, finance-lease principal where disclosed, capitalized software or other recurring investment needs, and acquisition cash use when central to the growth story. A capital-intensive quarter is not automatically negative. It means future returns must be monitored against a larger invested-capital base.
4. Cash and financing
Compare free cash flow with debt and equity issuance, dividends and repurchases, liquidity and maturities, and management’s capex and expense guidance. Free-cash-flow definitions can differ across companies, so use each issuer’s reconciliation and avoid false precision.
Add an invalidation condition
A neutral research process should state what would prove the current interpretation wrong. If segment profit grows while free cash flow recovers despite high capex, a cautious cash-conversion view weakens. If capex and financing stay elevated while segment growth and margins deteriorate, the concern strengthens. If a one-off charge disappears, future comparisons should adjust.
Simple monitoring panel
Track segment revenue growth; segment operating income or consolidated margin; operating cash flow; capex plus relevant lease principal; company-defined free cash flow; debt/equity financing; and next-quarter revenue, expense, and capex guidance.
On a 1D chart, mark only earnings dates and guidance revisions. Do not turn the framework into a price prediction. The purpose is to connect public evidence with a repeatable review process.
Risk note: This tutorial is educational and neutral. A single quarter cannot establish long-run return on capital or predict security prices. Financial statements can contain estimates, non-GAAP measures, and one-time items. Trading and investing can result in loss of principal.  Education
Learn 3 Best Time Frames for Day Trading Gold Forex
If you want to day trade Gold Forex, but you don't know what time frames you should use for chart analysis and trade execution, don't worry.
In this article, I prepared for you the list of best time frames for intraday trading and proven combinations for multiple time frame analysis.
For day trading gold forex with multiple time frame analysis, I recommend using these 3 time frames: daily, 1 hour, 30 minutes.
Daily Time Frame Analysis
The main time frame for day trading Forex is the daily.
It will be applied for the identification of significant support and resistance levels and the market trend.
You should find at least 2 supports that are below current prices and 2 resistances above.
In a bullish trend, supports will be applied for trend-following trading, the resistances - for trading against the trend.
That's the example of a proper daily time frame analysis on GBPCHF for day trading.
The pair is in an uptrend and 4 significant historic structures are underlined.
In a downtrend, a short from resistance will be a daytrade with the trend while a long from support will be against.
Look at GBPAUD. The market is bearish, and a structure analysis is executed.
Identified supports and resistances will provide the zones to trade from. You should let the price reach one of these areas and start analyzing lower time frames then.
Remember that counter trend trading setups always have lower accuracy and a profit potential. Your ability to properly recognize the market direction and the point that you are planning to open a position from will help you to correctly assess the winning chances and risks.
1H/30M Time Frames Analysis
These 2 time frames will be used for confirmations and entries.
What exactly should you look for?
It strictly depends on the rules of your strategy and trading style.
After a test of a resistance, one should wait for a clear sign of strength of the sellers : it can be based on technical indicators, candlestick, chart pattern, or something else.
For my day trading strategy, I prefer a price action based confirmation .
I wait for a formation of a bearish price action pattern on a resistance.
Look at GBPJPY on a daily. Being in an uptrend, the price is approaching a key resistance. From that, one can look for a day trade.
In that case, a price action signal is a double top pattern on 1H t.f and a violation of its neckline. That provides a nice confirmation to open a counter trend short trade.
Look at this retracement that followed then.
In this situation, there was no need to open 30 minutes chart because a signal was spotted on 1H.
I will show you when one should apply this t.f in another setup.
Once the price is on a key daily support, start looking for a bullish signal.
For me, it will be a bullish price action pattern.
USDCAD is in a strong bullish trend. The price tests a key support.
It can be a nice area for a day trade.
Opening an hourly chart, we can see no bullish pattern.
If so, open even lower time frame, quite often it will reveal hidden confirmations.
A bullish formation appeared on 30 minutes chart - a cup & handle.
Violation of its neckline is a strong day trading long signal.
Look how rapidly the price started to grow then.
In order to profitably day trade Gold Forex, a single time frame analysis is not enough. Incorporation of 3 time frames: one daily and two intraday will help you to identify trading opportunities from safe places with the maximum reward potential.
❤️Please, support my work with like, thank you!❤️
I am part of Trade Nation's Influencer program and receive a monthly fee for using their TradingView charts in my analysis.  Education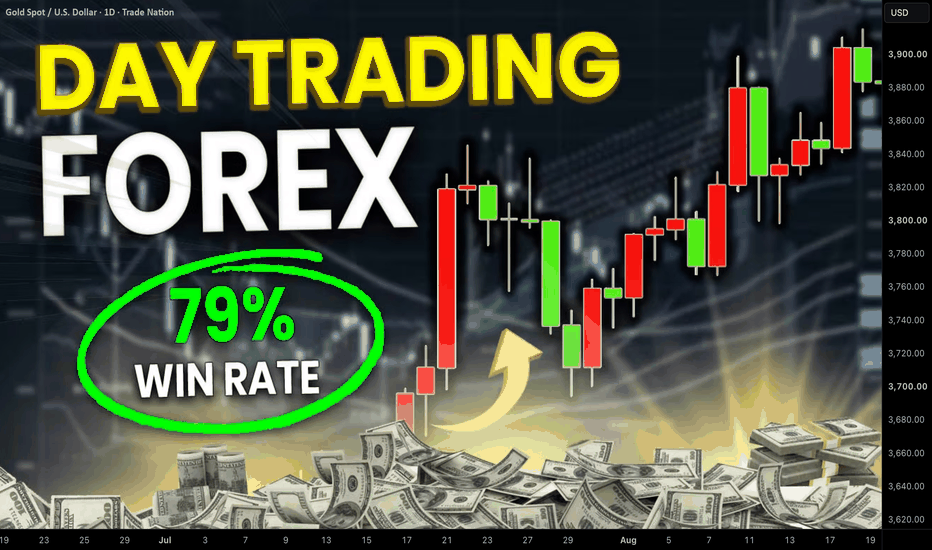
The "House Money" Effect: Why Traders Give Back Their ProfitsOne of the biggest psychological mistakes in trading doesn't start on a chart.
It starts in a casino.
Imagine you walk into a casino with $500.
After a couple of lucky hands, your balance grows to $2,000.
At that point, something interesting happens inside your brain.
Those extra $1,500 no longer feel like your money.
"They're the casino's money."
"I'm just playing with profits."
"It's free money anyway."
Psychologists call this the "House Money Effect" , and it is one of the most studied cognitive biases in decision-making.
The strange part is that nothing actually changed.
- That $2,000 now belongs to you.
- The casino doesn't care where it came from.
- Neither does probabilities.
- Every dollar has exactly the same value.
Yet our brain creates two separate accounts:
- My money.
- The casino's money.
And because the second feels "free," we suddenly become willing to take risks we would never have considered five minutes earlier.
- Higher bets.
- More aggressive decisions.
- Longer sessions.
And, very often, giving everything back.
Now let's leave the casino.
Because this is exactly what happens to traders.
Imagine you start the month with a $20,000 trading account.
Three weeks later, you're up $5,000.
Suddenly your mindset changes.
- "I've already made good money."
- "I can afford to take this trade."
- "If I lose a bit, it's only profit."
Without even realizing it, you start increasing position sizes.
You widen stop losses.
You take trades that don't fully meet your rules.
You stop protecting your capital with the same discipline that helped you earn those profits in the first place.
Nothing changed in the market.
Only your perception of the money changed.
The market doesn't know which dollars came from your initial deposit and which came from last month's winning trades.
A $1,000 loss hurts your account exactly the same, regardless of where those dollars originated.
Professional traders understand this.
They don't trade "house money."
They trade capital.
Capital that deserves exactly the same level of protection whether it was deposited yesterday or earned over the last twelve months.
This is one of the reasons why experienced traders often look boring.
- They don't suddenly double their position after a winning streak.
- They don't become reckless because they're "playing with profits."
- Their risk stays the same.
- Their process stays the same.
- Their discipline stays the same.
Because they know something most traders learn the hard way:
The fastest way to lose months of hard work is to convince yourself that your profits are somehow less valuable than your initial capital.
There is no house money.
There is only your money.
And the moment it reaches your account, every single dollar deserves the same respect.
Real Example:
Yesterday I made 850 pips trading Gold.
A few hours later, I opened another position.
The trade had a 300-pip stop loss and a 900-pip take profit. Nothing unusual. The exact same risk-to-reward ratio I use in my trading plan.
After some time, however, the trade started moving against me.
More importantly, price broke a support level I was watching, and the market structure changed.
At that moment, I had two choices.
I could simply wait for my full 300-pip stop loss to be hit because, after all, I was "only risking the house money" I had made earlier that day.
Or...
I could treat those profits exactly the same as every other dollar in my account.
I chose the second option.
I closed the trade for a 150-pip loss, cutting losses in half before my stop loss was reached.
Why?
Because those weren't the casino's money.
They weren't "free money."
They weren't disposable profits.
They were my money.
The moment those 850 pips hit my account, they became part of my trading capital, and my job became protecting them just as carefully as the money I deposited in the first place.
That's the difference between gambling and professional trading.
Gamblers think in terms of "house money" .
Professional traders think in terms of capital preservation .
Because once the profit is in your account...
It's no longer the house's money.
It's yours.
Education 
Markets Are Not Random — They Are ProbabilisticMost traders treat a losing trade as a sign something went wrong. Most of the time, nothing did — a loss is not a malfunction of a good strategy. It is the normal, expected cost of running a probabilistic system.
Random versus Probabilistic
These get treated as the same thing, and they are not. Random means no outcome is influenced by the conditions that preceded it — every event independent, nothing calculable in advance. Probabilistic means the opposite: every event has a likelihood that can be estimated based on the conditions producing it. A trading edge is not a prediction of what happens next. It is a statement about what tends to happen, more often than not, under a specific, repeatable set of conditions.
What This Means for a Losing Streak
A strategy with a 55% win rate is not a weak strategy — it is the floor of positive expectancy, not a warning sign. And a 55% win rate does not mean five wins followed by five losses in orderly succession. It means, over a large enough sample, losing streaks of five, six, even eight trades in a row are not just possible — they are statistically expected. Over a 100-trade sample, a run of five or more consecutive losses occurs 64.6% of the time, six or more losses 36.3% of the time, eight or more losses 8.5% of the time. Extend the sample to 500 trades and those numbers climb sharply — 99.5%, 91.3%, and 36.9%. At 1,000 trades, a run of six or more consecutive losses is close to a certainty.
Over 500 trades, a strategy running exactly as designed will produce an eight-loss streak more often than not. That is not the strategy breaking. That is the strategy behaving exactly the way a 55% win rate is supposed to behave.
Why Sample Size Is the Actual Answer
A single trade, or even a single week of trades, proves almost nothing. An edge only reveals itself over a sample large enough for the probability behind it to actually converge on the expected result. Judging a strategy off ten trades is judging a coin as unfair after five flips landed the same way — the sample is simply too small to carry the information being asked of it.
The Underlying Principle
Losses are not evidence that something is wrong. They are the statistical cost of operating a system that works probabilistically rather than deterministically. The job was never to avoid losing. It was to apply a real edge consistently enough, over a large enough sample, for the probability behind it to actually show up.  Education
One Wallet Launched 716 MemecoinsMemecoin launches drive a huge share of Solana's daily transactions and fee revenue. So it's worth understanding who is behind those launches, and how their previous ones ended.
Every token you buy was created by someone. On Solana, that someone is often a wallet that has done it hundreds of times before, and left a public record of how each one ended.
Here's one interesting wallet:
• 716 tokens launched
• 492 dead — no activity, value gone to zero
• 13 still alive and actively trading today
• 211 graduated — finished the bonding curve and made it to a real liquidity pool
• Best launch peaked around $450 MILLION market cap
Take a second with those numbers. One wallet. Five hundred corpses. Two hundred graduations. Nearly half a billion dollars at the peak.
And here's the part that matters: all of it was public BEFORE every single one of those launches. It's on-chain. It can't be faked and it can't be deleted. Anyone could have read it in two minutes.
Most buyers never do.
THE CHART SHOWS THE PAST. THE CREATOR PREDICTS THE FUTURE.
Ten minutes after launch, every token chart looks the same: a green candle and a dream. The rug and the 100x are identical twins at minute one. The chart simply cannot help you yet.
The creator's history can.
Buying a fresh launch is backing a founder, not trading an asset. And this wallet? Nearly 30% of its launches graduate, in a market where roughly 1% of all tokens ever make it. Those are two completely different games, and you only know which one you're playing by checking the wallet behind the launch.
• Creator with graduated tokens? They've carried launches to the finish line before.
• Creator with 40 dead tokens and zero graduations? They're showing you the future in advance.
• Fresh wallet, zero history? The biggest question mark in the market.
No guarantees, just odds. But trading IS odds.
HOW TO CHECK A CREATOR (2 MINUTES, FREE)
Steps 1-3 are on the launchpad itself, steps 4-5 in any Solana explorer.
1. FIND THE DEPLOYER
The token page shows the wallet that created it. Open that wallet's profile and every token it ever launched is listed there.
2. READ THE HIT RATE, NOT THE VOLUME
Graduations against total launches. 5 launches with 2 graduations beats 300 launches with 1. Big volume with a near-zero hit rate means the wallet earns from launching, not from the token succeeding.
3. CHECK IF THE WINNERS SURVIVED
Open the two or three biggest past tokens. Still trading months later, or flatlined right after the peak? Wins that keep running mean a builder. Wins that die in days mean an exit.
4. CHECK THE WALLET'S AGE AND FUNDING
Look at its first transaction. Years of history beats a wallet created last week. Then check where the first funds came from: a known exchange is normal, a fresh anonymous wallet means someone wanted distance from their own past.
5. CHECK WHAT THE CREATOR KEPT
Look at the holder list. If the creator's supply sits in a few connected wallets, the float you're buying is smaller than it looks, and the exit is already loaded.
🔴 RED FLAGS
• Many launches, zero graduations
• Wallet created days before the launch
• Every past token: pump, dump, flatline
• Supply parked in a few connected wallets
🟢 GREEN FLAGS
• Graduations in the track record
• Old wallet, long consistent history
• Creator holds a fair share, not a control block
So next time FOMO pulls you into a fresh launch, remember: behind every ticker there's a wallet, and every wallet has a story. Reading it takes two minutes, and it's the closest thing this market has to a founder's resume.
If this saves even one person from a rug, it did its job.
Educational content, not investment advice. Always DYOR.  Education
The Trap of High Leverage: Why More Control Means Less ProfitYou open a position with 50x. The margin required is tiny. The position size on screen is large. For a moment it feels like you have finally found the shortcut — the same profit, from a fraction of the account.
Ten minutes later the price moves 1.4% against you and the trade is gone. Not stopped out. Liquidated.
The direction was right. You were early by twenty minutes. This is the most expensive misunderstanding in retail trading, and it is worth being precise about why it happens.
🔵 Leverage Is Not Power. It Is Collateral Efficiency.
Leverage does not make your trade bigger. Position size makes your trade bigger. Leverage only decides how much of your capital the exchange locks as margin to hold that position. That is the entire function.
Leverage does not increase your profit. It decreases the distance between you and being wrong.
A trader who understands this uses 5x and 50x for the same trade with the same outcome. A trader who does not think 50x is five times better.
🔵 The Control Illusion
Higher leverage feels like precision. Smaller margin, tighter entries, more positions available at once. It feels like you are operating the market with finer instruments.
What is actually shrinking is your tolerance for normal price behaviour.
Bitcoin can move 2% in an hour on nothing at all. No news, no structural change, no invalidation of your idea. At 50x, that ordinary noise is a total loss. You have not been beaten by the market. You have been removed from it before it had a chance to resolve.
🔵 The Part That Surprises People: Same Risk, Different Survival
Here is where most traders discover they had the relationship backwards.
Both traders wanted to risk $100. Trader A chose the position size from the stop distance and used only as much leverage as the exchange required. Trader B chose the leverage first and let the position size follow.
Trader A loses $100 when wrong. Trader B loses $500 when the market breathes. A stop loss is a decision you make. A liquidation is a decision the exchange makes for you. That is the whole difference between trading and gambling, and leverage is where the line gets crossed.
🔵 The Cost You Do Not See on the Chart
There is a second drain, and it is quieter. Trading fees and funding are charged on the size of your position, not on the margin you posted. Ten times the leverage means ten times the fees and ten times the funding on the same amount of your own money.
You are paying a premium for the privilege of being liquidated faster. This is also why the fee structure of the exchange you use stops being a detail and starts being part of your edge.
🔵 What It Does to Your Head
The mechanical damage is measurable. The psychological damage is worse.
High leverage forces you to be right immediately. There is no room for the trade to develop, so you stop analysing and start monitoring. You watch the position instead of the market. You move your stop to give it air, then move it again. You take a 0.3% profit because the unrealised number felt like real money.
High leverage does not turn a bad trader into a good one. It turns a thinking trader into a reacting one.
Every good habit you have — patience, planning, letting a thesis play out — requires time. High leverage is the removal of time.
🔵 How Professionals Actually Use It
They do not choose leverage. They calculate size.
The sequence is always the same: find the setup, place the invalidation level where the idea is genuinely wrong, decide what that loss is worth in dollars, and let those two numbers produce the position size. Leverage is then whatever number the exchange needs to hold that position. Often it is low. Sometimes it is higher on a tight-stop scalp. It is never the starting point.
That is the tell. Amateurs ask how much leverage should I use. Professionals ask where is my stop, and what is that worth.
🔵 Final Take
Leverage is not the enemy. It is a legitimate tool for using capital efficiently, and used properly it is close to invisible in your results
The trap is the feeling. More leverage feels like more control, more speed, more seriousness. What it actually buys is less room, higher costs, and a shorter fuse on your own patience.
Set your stop first. Let the stop set your size. Let the exchange worry about the margin. Be wrong on purpose, in small amounts, for a long time. That is the whole job.
Swallow Academy Education 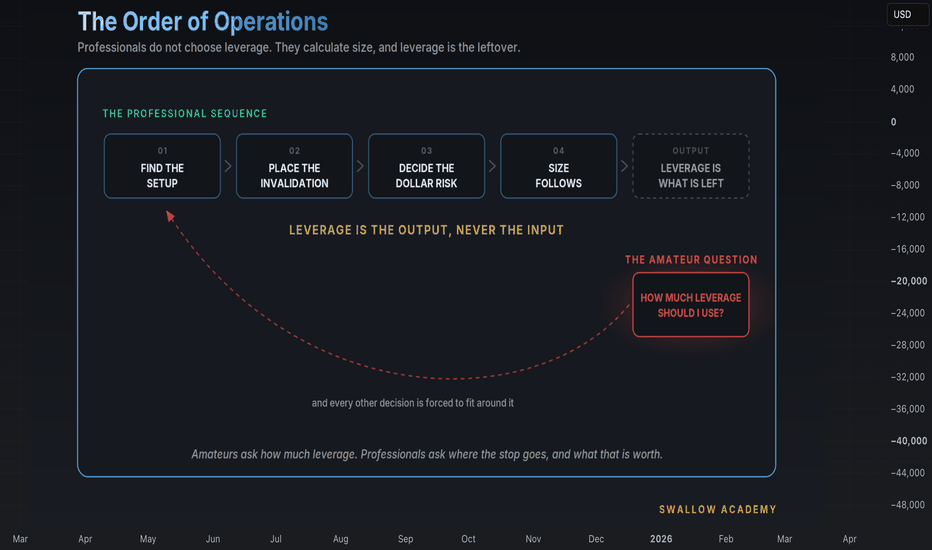
Why a loss costs more to recover?The worst damage I ever did to my account didn't come from a losing trade. It came from how hard I tried to win it back. One red position, then a bigger size to catch up, and a manageable dent turned into a hole. The loss itself was normal. My reaction to it was the real mistake.
That reaction has a price most traders never actually measure. So let's measure it.
➗ A loss and a gain aren't the same size
Here's the part that feels wrong until you do the arithmetic. Losing 10% and making 10% do not cancel out.
Say you have 1,000 dollars and you lose 10%. You're at $900. Now you make 10% back, but 10% of $900 is only $90, so you land at $990, still short of where you started. To climb back to even from down 10% you actually need about 11%. Small gap. But it widens fast. Down 25% takes a 33% gain to recover. Down 50% takes a full 100% gain: you have to double what's left just to get back to flat.
The reason is simple once you see it. After a loss you're rebuilding from a smaller base, so every percent costs more on the way up than it gave you on the way down. The deeper the hole, the more brutal the climb.
🔻 What a drawdown actually is
That drop has a name. A drawdown is the fall from your account's highest point down to its lowest point before it recovers. If you grew 1,000 to 1,200 and then slid to 900, your drawdown is measured from the 1,200 high, not from where you first started. It's the size of the loss, measured from the top.
Every trader who lasts has sat in one. The question was never whether you'd have a drawdown. It's what you do while you're stuck in it.
🧨 The trap: sizing up to get it back
The instinct in a drawdown is to press harder. You feel behind, so you size up to catch up, because one big win fixes it faster. That instinct is exactly what turns a drawdown into a blown-up account.
When you size off the hole instead of off the setup, you've stopped trading and started chasing. And you're doing it at the worst possible moment, when you're frustrated and want the money back now. The market doesn't owe you a quick recovery, and reaching for one is how the shallow holes become deep ones.
🪜 The fix: size down and climb slow
The move that works is the one that feels backward. When you're in a drawdown, trade smaller, not bigger.
Cutting your size does two things at once. It caps how much deeper the hole can get while your head isn't clear, and it keeps you in the game long enough for a normal winning stretch to pull you out. You climb out the same way you should have traded all along, one clean setup at a time, just with the size turned down until the account and your head both settle.
It's slow, and it's meant to be. You fell in fast because losses land hard, and you climb out slow because you're rebuilding off a smaller base. Making peace with that asymmetry is most of the skill. The trader who survives a rough month isn't the one who made it all back on Friday. It's the one who stopped digging on Monday.
🧭 The one number to watch
If you take one thing from this, make it this habit: know your current drawdown as a number, right now, today. Not a vague sense of "down a bit." The actual percent from your high. The traders who blow up are almost always the ones who lost track of how deep they were, because a hole you can't see is a hole you keep digging.
When you're down and behind, what actually gets you to trade smaller instead of bigger? Or is that still the hardest rule for you to hold? Education 
Interest Is Not Confirmation [EmpArchitect]The most expensive habit in structure trading is treating a level that looks important as a level that has done something. Interest and confirmation feel similar in the moment. They are not the same, and the gap between them is where most bad entries live.
◆ What interest is
Interest is everything that makes you look. A fresh order block. A clean sweep of liquidity. A zone two timeframes agree on. A high clarity score. All of it earns attention — it's a reason to open the chart and watch. But interest is a statement about the setup, made before price has responded. It says "this area matters." It does not say "price agrees that it matters."
◆ What confirmation is
Confirmation is what price actually does at the level. A sweep followed by displacement back out. A structure shift on the lower timeframe. A decisive reaction that leaves a mark. Confirmation is a statement about the response, made after the fact. It can only exist once price has arrived and answered. No amount of pre-arrival quality — no score, no confluence, no freshness — is confirmation. Those things are the reason to wait for it, not a substitute for it.
◆ Why the two get collapsed
Because waiting is uncomfortable. A perfect-looking zone creates the feeling that the work is already done — the level is so clean, surely the reaction is a formality. That feeling is exactly the trap. The cleaner the setup looks, the stronger the pull to act on the interest and skip the confirmation. And the market runs clean-looking levels constantly; "it looked perfect" is the most common autopsy line there is. The quality of the level and the quality of the response are independent measurements. One is not evidence of the other.
◆ The read, compressed
Interest tells you where to pay attention. Confirmation tells you whether the attention was warranted. A high-interest level with no confirmation is a chart you were right to watch and wrong to trade. A level that reaches your zone and just slices through, or chops sideways with no structural shift, has told you something real: the interest was not confirmed. That's not a failed setup — that's the process working. The "no" is as much a result as the "yes."
◆ How this shows up in the tools
Everything the scanner gives you is interest, by design. A detection, a clarity score, HTF context, zone freshness — that's the case for looking, delivered before price responds. The scanner deliberately stops there. It finds the chart; it does not confirm the chart, because confirmation is a lower-timeframe, after-the-fact read that only you can make in the moment, against your own model. A detection is an invitation to watch, never a verdict. The workflow ends in your confirmation precisely because the tool's job ends at interest.
Nothing here is an entry, a target, or a stop. It's the discipline of separating the reason to look from the reason to act — and never mistaking the first for the second.
Not a signal — just the map. Education 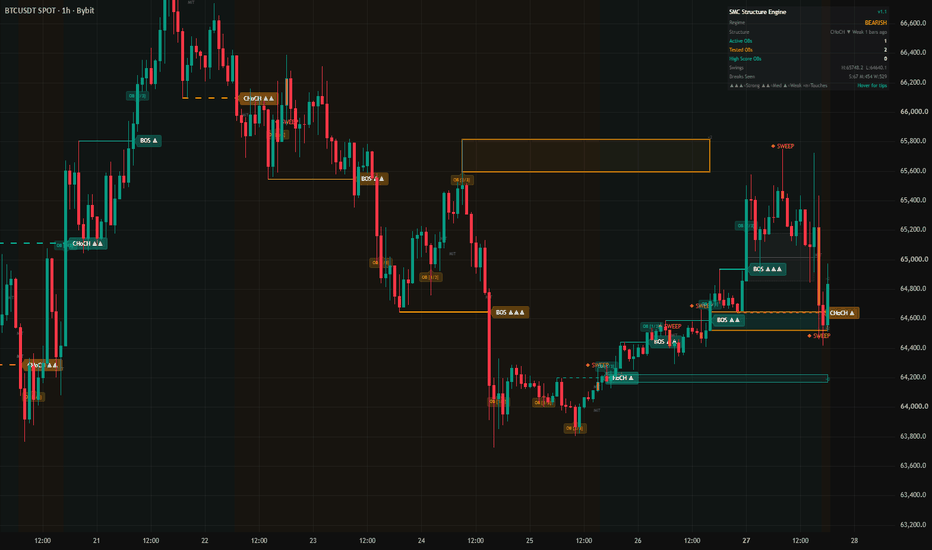
The Silent Language of WicksMost traders focus on the body of a candle.
Experienced traders often pay just as much attention to its wicks .
At first glance, a wick may seem like nothing more than a thin line above or below a candle. In reality, it captures one of the most important moments in the market—a moment when one side briefly took control, only to be challenged by the other.
A long upper wick tells the story of buyers who successfully pushed prices higher but couldn't keep control. Sellers stepped in with enough conviction to reject those higher prices before the candle closed. A long lower wick tells the opposite story. Sellers initially gained control, but strong buying pressure absorbed the selling and pushed the market back upward.
These reactions are rarely random.
Wicks often appear around key support and resistance levels , liquidity zones , major news events , or after extended price moves . They provide valuable clues about rejection, acceptance, hidden buying or selling pressure, and the ongoing battle between market participants.
One of the biggest mistakes traders make is treating every long wick as an automatic reversal signal. A wick should never be analyzed in isolation. Its true meaning depends on the surrounding market structure, the prevailing trend, trading volume, nearby liquidity, and the overall context in which it appears.
Over the years, I've learned that the market rarely communicates directly—it leaves footprints. Wicks are among the clearest of those footprints. They reveal hesitation, failed breakouts, aggressive rejection, trapped traders, profit-taking, and moments when control quietly shifts from buyers to sellers—or vice versa.
In this article, we'll go beyond simply identifying long or short wicks. We'll explore how to interpret the story behind them, understand what they reveal about market intent, and use them alongside price action to make more informed trading decisions.
Trading isn't just about recognizing candlestick patterns.
It's about understanding why those patterns formed in the first place.
Because a wick isn't just a shadow on a chart.
It's the market leaving behind a clue for those who know how to read it.  Education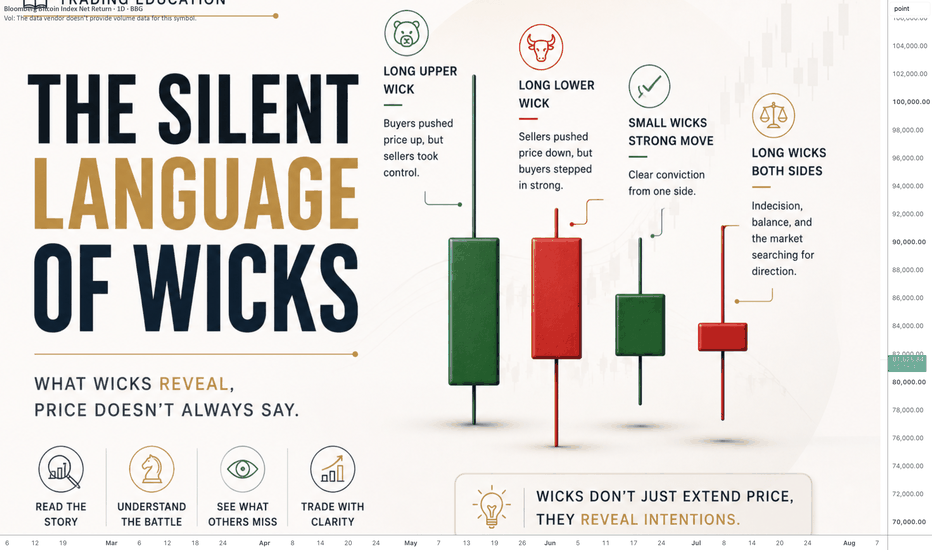
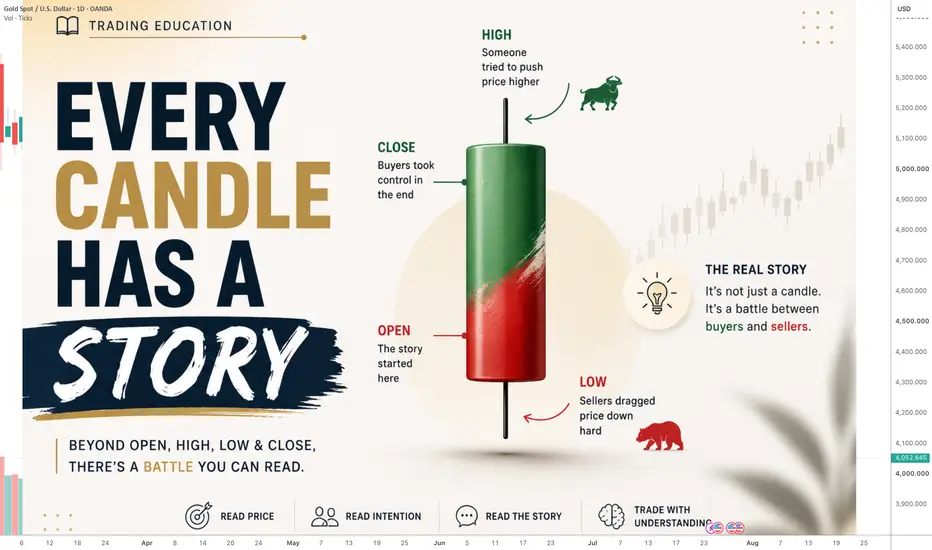
Every Candle Has a StoryMost traders see a candlestick.
Experienced traders see a conversation.
Every candle on your chart is the result of thousands of decisions made by buyers and sellers in real time. Behind every open, high, low, and close lies a battle between confidence and doubt, patience and panic, accumulation and distribution. A candle isn't just a price bar—it's a snapshot of market psychology.
When I first started trading, I focused on memorizing candlestick patterns. Hammers, Dojis, Engulfing Candles—I knew their names, but I didn't truly understand what they represented. It wasn't until I began asking "Why did this candle form?" instead of "What is this pattern called?" that my perspective completely changed.
A long upper wick often tells the story of buyers who pushed prices higher, only to meet aggressive selling. A strong bullish candle reveals conviction. A small-bodied candle after a large move may signal hesitation rather than certainty. Every candle records a struggle, and learning to read that struggle is often more valuable than memorizing dozens of patterns.
The market speaks through price, but it rarely speaks in words. It speaks through momentum, rejection, acceptance, and imbalance. The more you understand the story behind each candle, the less you'll rely on mechanical pattern recognition and the more you'll begin to understand the intentions driving market movement.
In this article, we'll look beyond the shape of candlesticks and explore the message they carry. Instead of simply identifying candles, we'll learn to interpret the emotions, decisions, and order flow that created them.
Because the best traders don't just read candles.
"They read the story the market is trying to tell."
Education 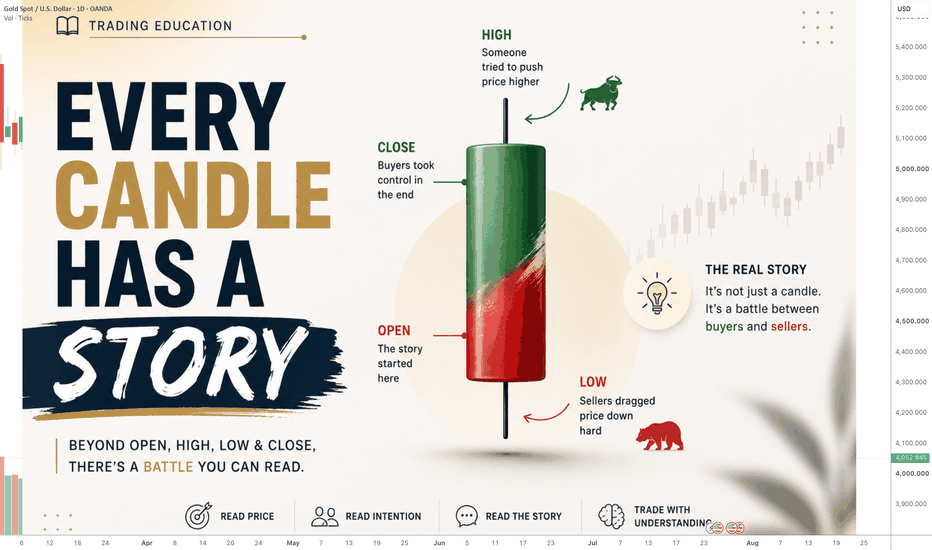
Remove These 5 and Make Big ProfitsHey what's up guys, welcome to the second part of article where Im describing the most mistakes we do as traders. Here are five more that slow almost every new trader down on the road to consistency — the slower-burn habits that keep you stuck even after the account survives.
If you haven't read Part 1 yet - check it here I describe there psychological effects of oversizing, revenge trading, moving stops, wrong capital, and FOMO are the ones that blow accounts fastest. This piece assumes you're working on those and picks up where they leave off.
None of these mistakes mean you're not cut out for trading. They mean you're on schedule.
I've made most of them myself. So have the traders who eventually got consistent. Charts change every day. Sessions change. Instruments change. But the person staring at the screen doesn't — and that's usually where the damage starts.
These five won't always wipe you in a week — but they'll keep you flat, frustrated, and repeating the painful mistakes from Part 1 for years if you don't address them.
1️⃣ Confusing Activity With Progress
🧪 What it looks like: you've blocked out three hours to trade. Sitting through them without clicking feels like failure. So marginal setups get promoted. "It's close enough" becomes an entry criterion.
Experienced traders describe the job differently: most of the work is waiting.
Your edge — whether that's a London continuation after a clean Asian range, or a Model 1 at 50% of the CLS range — is not present all day. Trading when it isn't there isn't extra practice. It's paying a subscription fee to variance.
The impulsive trader takes the same two setups plus six forced ones. Same edge, buried under noise — spread, commissions, and emotional capital spent on trades that were never part of the plan.
✅ The correction: measure discipline by the quality of trades taken, not the quantity. A day with zero trades because nothing valid appeared is a perfectly executed day.
It my strategy it means:
- Messy or wide Asian range? Often a no-trade day for London.
- No manipulation yet? No trade.
- Premium zone but you're trying to go long? No trade.
- Order block hasn't closed on the correct timeframe? No trade.
Write down exactly what a valid setup looks like — sweep, displacement, SMT, OB close, R:R — so "close enough" has something concrete to fail against.
2️⃣ Abandoning a Strategy After Three Losses
🧪 What it looks like: find a method → trade it two weeks → hit a losing streak → conclude it's broken → find a new one. Repeat for two years. Come out with no data on anything.
Even a solid edge — say 50% win rate with wins twice the size of losses — will regularly produce four, five, even six losses in a row. That's not the strategy failing. That's what small samples look like.
Strategy hopping is often not really about the strategy. It's a way to avoid confronting execution errors. Blaming the method is more comfortable than admitting the method was fine and you entered during the sweep, ignored HTF bias, or skipped the journal.
✅ The correction: commit to a sample size before judging anything. In CLS Lab we backtest toward 200 logged trades before live sizing. A reasonable minimum to start evaluating is 30–50 trades executed by the rules — losing streaks included.
If you broke the rules on half the trades, the sample tells you nothing about the strategy. It tells you something about execution. Different problem. Different fix.
Stick with Model 1 until you can answer cold: what qualifies, what invalidates, what clean looks like vs. forced. That clarity only comes from repetition — not from another YouTube strategy at midnight.
3️⃣ Judging Trades by Outcome Instead of Process
🧪 What it looks like:
Trade 1: impulsive entry, no stop, chased a move after displacement already happened. Gets lucky. Wins. Brain records: "That worked."
Trade 2: perfect plan — HTF CLS range context, manipulation done, H1 order block on a Daily range, fixed risk, stop below the sweep. Stops out. Brain records: "That failed."
Both lessons are wrong. Together they train the exact opposite of consistency.
Any single trade can win or lose regardless of decision quality. What compounds over hundreds of trades is the quality of the decisions.
‼️ After each trade, ask one question: "Would I take this exact trade again in the same conditions?"
Yes → good trade, even if it lost.
No → bad trade, even if it won.
Some traders grade every trade A through D on process alone and ignore the profit column entirely. Over time, the account should be built from A-grade trades — and whether any particular one won becomes almost uninteresting.
✅ This is the dividing line between traders who eventually become consistent and traders who don't.
4️⃣ Trading Without a Journal (or Keeping One That Records Nothing Useful)
🧪 What it looks like: ask a struggling trader what their biggest problem is and they'll guess — entries, indicators, "psychology." Ask them to show the data and there's nothing. They're trying to debug a system with no logs.
A journal is not a feelings diary and it's not a P&L spreadsheet. Its job is to make patterns visible that memory hides. Memory exaggerates dramatic trades, forgets routine ones, and quietly edits history to protect your ego.
✍️ What a useful Journal entry contains — five minutes per trade:
- Setup type (Model 1, Model 2, which session)
- HTF context in one line (Daily range, discount/premium, bias)
- Reason for entry in one sentence
- Planned stop, target, and R:R
- Actual result
- Screenshot at entry — sweep, displacement, confirmation
- One honest line on state of mind ("calm," "still annoyed about the last loss," "entered early")
The payoff comes at review — usually after a few dozen trades, when patterns surface. Journals routinely reveal things like:
- Nearly all losses coming from one session (often London on messy Asia days)
- Winners cut at half the planned target while losers run to full stop
- A setup that feels great and loses consistently because confirmation was skipped
None of that is visible without records. Each one, once seen, is fixable in a way no new indicator ever will be.
✅ The correction: log every trade. Review every Saturday with a calm mind — no open positions, no pressure. Change one thing at a time. Traders who journal aren't more disciplined by nature. They've replaced opinions about their trading with evidence.
5️⃣ Expecting Consistency on a Timeline the Skill Doesn't Allow
🧪 What it looks like: most new traders privately expect profitability within a few months. Month four arrives flat or down. Something must be wrong — with the strategy, the market, themselves. That conclusion triggers the painful mistakes from Part 1: strategy hopping, oversizing to catch up, revenge trading the calendar.
Developing consistent profitability usually takes months / years, not days / weeks..
Not because the concepts are complicated — most of what you need can be understood in an afternoon. But trading is a performance skill. The gap between reading about a stop hunt and actually waiting for manipulation to finish while a live position moves against you is the same gap as between reading about swimming and swimming. It closes only through repetitions.
Nobody thinks four months of casual practice should make them a surgeon. Trading escapes that logic because the barrier to entry is a phone and a deposit — the ease of starting gets confused with the ease of succeeding.
✅ The correction: replace the profit timeline with a competence timeline. Instead of "profitable by summer," aim for:
- Fifty consecutive trades without breaking a rule
- A full quarter of journaled, reviewed trading
- One setup traded well before adding a second
- 200 backtested and logged trades before meaningful live size
These milestones are under your control. Profit follows them — not the other way around.
📍 THE BOTTOM LINE — PART 2
Read back through these five and notice what they share with Part 1. Almost none are about analysis. Not one is solved by another indicator or another guru on social media.
They're all about the distance between knowing and doing under pressure — and about building evidence instead of opinions:
- Measure discipline by trade quality, not click count
- Commit to a sample size before you judge the strategy
- Grade trades on process, not outcome
- A journal with screenshots beats another indicator
- Competence milestones before profit milestones
You will still make some of these mistakes after reading both parts — probably this week. The difference is that now you'll recognize them while they're happening. Recognition is where the correction starts.
The traders who eventually become consistent are the ones who stopped repeating them.
Process first. Capital first. Emotion last.
❌ None of this guarantees profits. Nothing in trading does. But you'll stop wasting years on the wrong problem — and that's the first win that actually compounds.
Adapt useful, Reject useless and add what is specifically yours.
David Perk 🚀Boost | 🔁 Share | 💬 Comment | ✅Follow for more Education
Education 
The Hidden Mathematics of Prop Firm ChallengesBefore we begin, let me make one thing clear.
I actually like prop firms.
For many talented traders, they offer an opportunity that simply didn't exist a few years ago: the possibility of managing significantly more capital without having to build a large account from scratch.
Of course, not every prop firm is the same and choosing a reputable one is essential, but the concept itself makes perfect sense. If you're consistently profitable and disciplined, a prop firm can dramatically accelerate your trading career.
The problem is that many traders approach a challenge as if it were just another trading account.
It isn't.
The market is exactly the same, but the rules are completely different. Those rules change the mathematics of trading in ways that are often underestimated, and that's precisely why so many otherwise profitable traders struggle to pass a challenge.
This article isn't about whether prop firms are good or bad.
It's about understanding the game you're actually playing before you place your very first trade.
If you ask ten traders why most people fail a prop firm challenge, chances are you'll hear the same answers over and over again. They risk too much. They overtrade. They trade during news. They revenge trade after losses.
While all of those are valid reasons, I don't think they're the real problem.
In my opinion, most traders fail before they even place their first trade, simply because they don't understand the mathematics of the game they're about to play.
The moment you open a prop firm challenge, you're no longer trading under the same conditions as you would on your personal account.
The market hasn't changed—Gold is still Gold, EUR/USD is still EUR/USD, and Price Action, ICT or whatever behaves exactly as it always has.
What changes are the rules you must survive under, and those rules completely alter the relationship between risk, return and time.
That is why a strategy that works perfectly well on a personal account can suddenly become much harder to execute inside a prop challenge.
Your Account Size Is an Illusion
One of the first things traders notice is the account size.
"$100,000 funded."
"$200,000 funded."
"$500,000 funded."
Those numbers are attractive because they make you feel as if you're managing a large amount of capital. In reality, however, that isn't your trading capital at all.
Imagine a challenge with an 8% maximum drawdown. Whether the account is worth $100,000 or $500,000 makes very little difference from a risk management perspective because the only capital you are actually allowed to lose is that 8%.
Everything else is simply buying power.
The moment you start looking at a prop account this way, your priorities begin to change. Instead of asking yourself how much money you can make, you should begin asking yourself how efficiently you can protect that limited drawdown while allowing your edge enough time to play out.
That shift in perspective is far more important than any entry technique.
Why a 10% Target Isn't as Easy as It Looks
On paper, making 10% doesn't sound particularly difficult. Many experienced traders have achieved far more than that in a strong month on their own accounts.
The mistake is assuming the comparison is fair.
A personal account gives you complete freedom. If you have a temporary drawdown but still believe in your strategy, you can continue trading, recover the losses and move on.
A prop challenge doesn't offer the same flexibility because the drawdown acts like a hard wall. Once you hit it, the game is over, regardless of whether your next ten trades would have been winners.
This immediately forces you to reduce risk (or at least it should if you want to pass).
If you're trading Gold, that becomes even more important. Gold is one of the most volatile instruments available to retail traders. It can move hundreds of points against your position before resuming the exact direction you originally expected. Those temporary fluctuations are completely normal, but when your drawdown is tightly restricted, normal volatility suddenly becomes a much bigger problem.
For that reason, many experienced traders naturally reduce their exposure, sometimes to what looks like an effective leverage of 1:1. That isn't because they've become less confident in their analysis. It's because they understand that surviving Gold's normal price action is often more important than trying to maximize returns on every trade.
Of course, lower leverage comes with a price.
Time.
The Trade-Off Nobody Talks About
This is probably the biggest misconception surrounding prop firms.
Everyone focuses on the profit target.
Almost nobody talks about the time needed to reach it responsibly.
If you decide to trade conservatively in order to respect the drawdown, your monthly returns will almost certainly become smaller. That's exactly what should happen. Lower risk generally means lower volatility in your equity curve.
The problem is that many traders aren't psychologically prepared for that slower pace.
After two or three quiet weeks, they begin feeling as though nothing is happening. They stop measuring the quality of their decisions and start measuring only the distance remaining to the target.
That is usually where discipline begins to disappear.
The Finish Line Keeps Moving
Let's imagine a very common scenario.
Your challenge requires a 10% profit to pass and allows an 8% maximum drawdown.
After your first month you're down 2%.
Nothing dramatic has happened. You respected your trading plan, stayed comfortably within the drawdown limits and are still very much alive in the challenge.
Objectively, that's a perfectly manageable situation.
Psychologically, however, everything has changed.
You are no longer trying to make 10%.
First you need to recover the 2% you've already lost, and only then can you continue towards the original target. Without realizing it, your journey has become a 12% climb.
This is an aspect of prop firms that very few people discuss. Every losing month doesn't simply reduce your equity; it also pushes the finish line further away while leaving you with less room to make future mistakes.
In other words, the challenge becomes longer at exactly the same moment your margin for error becomes smaller.
That combination creates pressure, and pressure changes behaviour.
When Time Becomes the Enemy
Most traders believe they become emotional because they lose money.
I don't think that's entirely true.
Very often, they become emotional because they stop seeing progress.
A trader who is down 2% after one month may still have plenty of room before reaching the maximum drawdown, yet psychologically he feels far worse than the numbers suggest. The reason is simple. Every passing week reminds him that the target is still far away, and the temptation to accelerate the process becomes stronger.
"This setup is probably good enough."
"I'll increase the size just this once."
"If this trade works, I'll be back on track."
Almost every serious mistake starts with a sentence like that.
The market hasn't changed.
The strategy hasn't changed.
Only the trader's relationship with time has changed.
Think Like a Fund Manager, Not a Gambler
Professional money managers understand something that many retail traders overlook.
Their job isn't to produce spectacular months.
Their job is to survive long enough for their statistical edge to compound over time.
A prop firm challenge is testing exactly the same quality.
Yes, passing in five days makes for a fantastic YouTube thumbnail, but it tells us very little about the quality of the underlying risk management. Passing after three months of disciplined execution is usually far less exciting on social media, yet it often demonstrates far greater professional maturity.
The irony is that the traders who try hardest to finish as quickly as possible are often the ones who never finish at all.
Final Thoughts
One of the greatest lessons prop firms teach has very little to do with technical analysis.
They teach patience.
They teach restraint.
They teach respect for probability.
Most importantly, they force you to accept that protecting capital and growing capital are not two separate objectives—they are the same objective viewed from different angles.
The moment you stop treating the challenge as a race and start treating it as a long-term risk management exercise, your mindset changes completely. You stop chasing percentages, stop forcing trades and stop looking for shortcuts that don't exist.
Because in the end, a prop firm challenge isn't really testing whether you can make 10%.
It's testing whether you can remain disciplined long enough for your edge to eventually produce those 10%.
And that, more than any strategy or indicator, is what separates the traders who get funded from those who keep buying new challenges.
Have a great weekend!
Mihai Iacob Education 
The Performance Trader · 03: How to protect your profitThe hardest trade you'll ever manage is a winning one. Nobody teaches that part. They show you how to get in, how to cut a loss, and then they go quiet at the exact moment you're up on the session and your hands start to feel clever.
There's a habit I had to break. The second I booked a good win, I'd go straight back in, bigger, still buzzing, and hand a chunk of it right back. Not always. Just often enough that my best mornings and my worst mornings were usually the same morning. The giveback almost always came from the trade right after the best one.
☝️ The two ways a green day turns red
Being up on the day pulls you in two directions, and both of them cost you.
One is getting sloppy. You feel unbeatable, so you size up, skip your checks, and take trades you'd normally pass on. Your own profit ends up funding the recklessness.
The other looks safer but isn't. You get scared of losing the green, so you go flat and quit for the day. Going flat just means you close every position and sit out with nothing open. There's nothing wrong with stopping when you've got a reason. But bolting the moment you're up, out of pure fear, kills the rest of a good day and teaches you that winning is something to run from.
The skill is the middle. Protect what you've made without slamming the door on the rest of the session.
Move your stop to breakeven🛡️
The first tool is the simplest one there is: once a trade has paid you a decent amount, move your stop to breakeven.
Your stop is the price where you get out to cap a loss. Breakeven means dragging that exit up to your entry, the price you got in at. Do that and the worst case stops being a loss, it just becomes a scratch, a trade that closes at zero.
Now the trade can only pay you or cost you nothing. That single move takes most of the fear off the screen.
Trail it, then take partial profit📈
Once the trade is safe, you've got two ways to take a winner without turning greedy.
Trail the stop. That means moving your exit up behind price as it climbs, so if it turns on you, you keep most of what it already gave. The trade stays open, but the floor under it keeps rising.
Or take a partial. That means closing part of the position and letting the rest run. Say you're holding 1 Bitcoin and you close 0.5 right here. Half the profit is locked and can't be taken back, while the other half keeps working if the move continues.
In plain words: you get paid now and you still stay in the move. You don't have to choose between banking everything and holding everything.
Cut your size after the big one✂️
This is the one that took me longest to accept. After a big win, trade smaller, not bigger.
The instinct runs backward, because when you feel hot you want to press harder, not lighter. But the trade right after your best one is where the damage usually lands, because you've stopped sizing off the setup and started sizing off the feeling. The setup didn't get better because you just won. Only your confidence did. So cut your size after a standout win. It's a dull little habit, and it quietly guards most of what you just made.
Set a max profit for the day🚧
Last one. Early in the session, pick a profit floor , a level of profit you refuse to drop back below.
Say you're up 3% and you decide 1.5% is your floor. If the day gives some back and you sink to that line, you're finished for the day, you lock it in and close the laptop. You're not quitting scared here. You're following a line you set earlier, back when you were calm and not up on the day.
The floor does the deciding for you, so the excited version of you at noon doesn't get to argue a good day back into a red one.
Part 4 lands next Thursday: how to review a session so the next one starts sharper.
What's your rule once you're green on the day? Have you got a hard line that makes you stop, or are you still deciding it in the moment? Education