

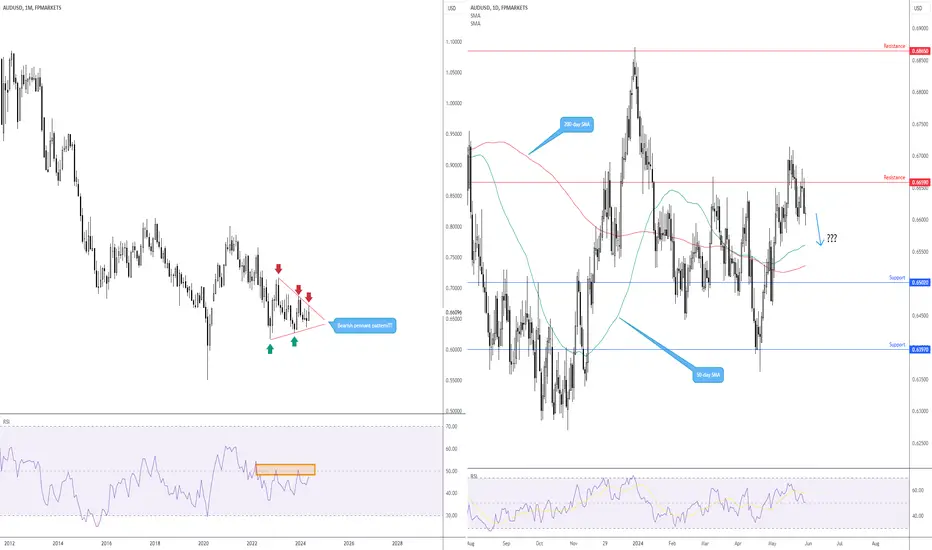
While the AUD/USD shows signs of trending higher on the daily chart – a series of higher highs and higher lows have been seen since $0.6362 – the unit recently connected with resistance at $0.6659, a move bolstered by the monthly chart linking with the upper boundary of a potential bearish pennant formation, drawn from a high of $0.7158 and a low of $0.6170.
Coupled with the above analysis and the Relative Strength Index (RSI) holding south of the 50.00 centreline on the monthly chart and daily flow also poised to break through the 50.00 centreline, this could prompt further selling in the currency pair towards the 200-day and 50-day SMA combination between $0.6528 and $0.6560.
Coupled with the above analysis and the Relative Strength Index (RSI) holding south of the 50.00 centreline on the monthly chart and daily flow also poised to break through the 50.00 centreline, this could prompt further selling in the currency pair towards the 200-day and 50-day SMA combination between $0.6528 and $0.6560.

Bài đăng liên quan
Thông báo miễn trừ trách nhiệm
Thông tin và các ấn phẩm này không nhằm mục đích, và không cấu thành, lời khuyên hoặc khuyến nghị về tài chính, đầu tư, giao dịch hay các loại khác do TradingView cung cấp hoặc xác nhận. Đọc thêm tại Điều khoản Sử dụng.
Bài đăng liên quan
Thông báo miễn trừ trách nhiệm
Thông tin và các ấn phẩm này không nhằm mục đích, và không cấu thành, lời khuyên hoặc khuyến nghị về tài chính, đầu tư, giao dịch hay các loại khác do TradingView cung cấp hoặc xác nhận. Đọc thêm tại Điều khoản Sử dụng.