
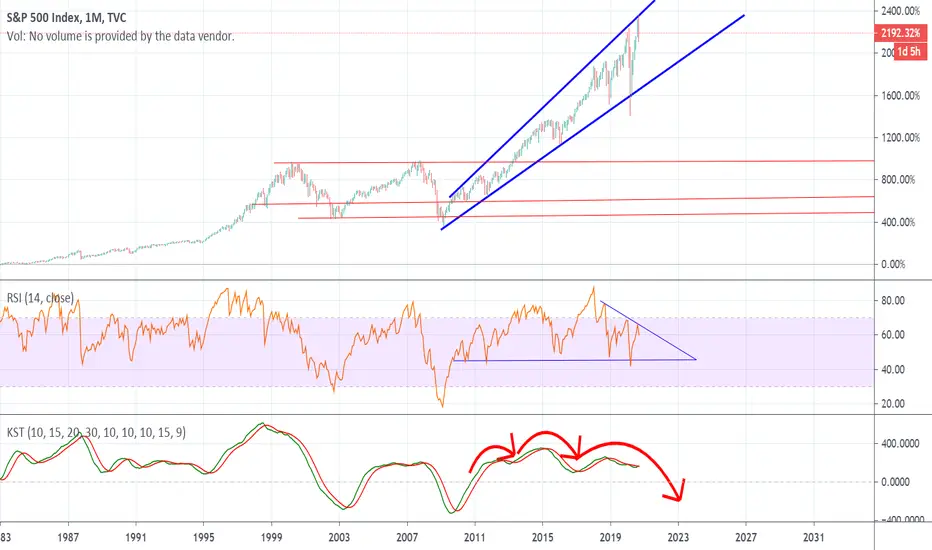
The S&P 500 is forming a rising channel or ascending channel marked by two blue parallel uptrend lines.
Most stocks typically continue to channel until either trend line is broken.
An upside break is a signal that buying intensity has increased, while a downside break indicates an end to the short-term uptrend.
On the RSI there's a noticeable divergence, the blue downward sloping line of resistance will need to be purged to the upside before the pattern finishes or there's likely going to be a heinous correction if the pattern finishes bearishly.
The KST is trying to cross bullishly over the red line but has been rejected multiple times upon close observation, I've outlined a possible H&S pattern that will occur unless we see a bullish cross on the KST.
Most stocks typically continue to channel until either trend line is broken.
An upside break is a signal that buying intensity has increased, while a downside break indicates an end to the short-term uptrend.
On the RSI there's a noticeable divergence, the blue downward sloping line of resistance will need to be purged to the upside before the pattern finishes or there's likely going to be a heinous correction if the pattern finishes bearishly.
The KST is trying to cross bullishly over the red line but has been rejected multiple times upon close observation, I've outlined a possible H&S pattern that will occur unless we see a bullish cross on the KST.

Thông báo miễn trừ trách nhiệm
Thông tin và các ấn phẩm này không nhằm mục đích, và không cấu thành, lời khuyên hoặc khuyến nghị về tài chính, đầu tư, giao dịch hay các loại khác do TradingView cung cấp hoặc xác nhận. Đọc thêm tại Điều khoản Sử dụng.
Thông báo miễn trừ trách nhiệm
Thông tin và các ấn phẩm này không nhằm mục đích, và không cấu thành, lời khuyên hoặc khuyến nghị về tài chính, đầu tư, giao dịch hay các loại khác do TradingView cung cấp hoặc xác nhận. Đọc thêm tại Điều khoản Sử dụng.