
Hi Traders!
SPX looks to have fallen short of the record high, and there could potentially be a big pullback that is about to occur.
Here are the details:
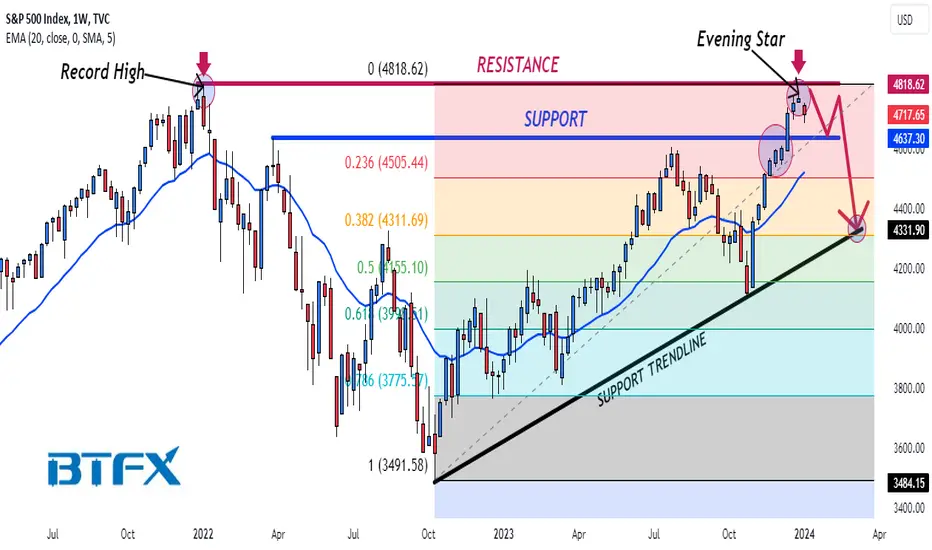
There is an evening star candle pattern currently on the 1W chart, and this is the first week the market's weekly open price has opened substantially lower than the previous week's closing price in about 8 weeks.
We are looking for a pullback to test the previous resistance break at 4637.30, which is now the support, and if the market breaks below that, then the next level will be trendline support at 4331.90, which lines up with the 38.2 Fibonacci retracement level at 4311.69.
Preferred Direction: Sell
Technical Indicators: 20 EMA
Resistance: 4818.62
Support: 4637.30
Trendline Support: 4331.90
38.2 Fibonacci Support: 4311.69
Please make sure to click on the like/boost button 🚀 as your support greatly helps.
Trade safely and responsibly.
BluetonaFX
SPX looks to have fallen short of the record high, and there could potentially be a big pullback that is about to occur.
Here are the details:
There is an evening star candle pattern currently on the 1W chart, and this is the first week the market's weekly open price has opened substantially lower than the previous week's closing price in about 8 weeks.
We are looking for a pullback to test the previous resistance break at 4637.30, which is now the support, and if the market breaks below that, then the next level will be trendline support at 4331.90, which lines up with the 38.2 Fibonacci retracement level at 4311.69.
Preferred Direction: Sell
Technical Indicators: 20 EMA
Resistance: 4818.62
Support: 4637.30
Trendline Support: 4331.90
38.2 Fibonacci Support: 4311.69
Please make sure to click on the like/boost button 🚀 as your support greatly helps.
Trade safely and responsibly.
BluetonaFX

Thông báo miễn trừ trách nhiệm
Thông tin và các ấn phẩm này không nhằm mục đích, và không cấu thành, lời khuyên hoặc khuyến nghị về tài chính, đầu tư, giao dịch hay các loại khác do TradingView cung cấp hoặc xác nhận. Đọc thêm tại Điều khoản Sử dụng.
Thông báo miễn trừ trách nhiệm
Thông tin và các ấn phẩm này không nhằm mục đích, và không cấu thành, lời khuyên hoặc khuyến nghị về tài chính, đầu tư, giao dịch hay các loại khác do TradingView cung cấp hoặc xác nhận. Đọc thêm tại Điều khoản Sử dụng.