
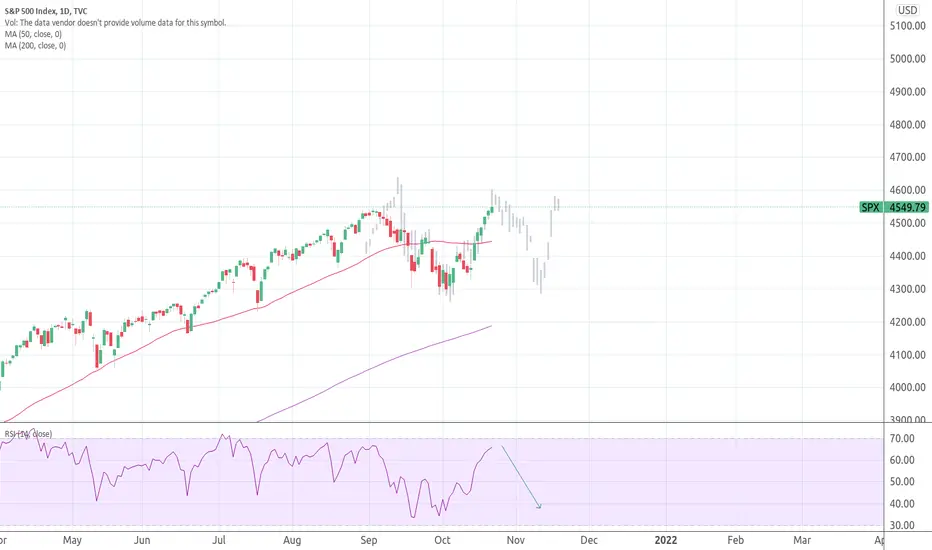
Every correction since 2015 has zig-zagged. Going again? IDK, but eerily close to dates, peaked on 12, sold to 28 Oct 2020.
This one is running a week behind, looks like we peaked 10/21; to confirm on Fri 10/22, ERs tanking FB, SNAP, INTC techs overnight;
if double top is in, might expect weakness until ~5 Nov, if the zigzag pattern repeats. Bull trap?!
Not saying that it will, just something to think real hard about before you go plunging long IMO... at insanely overbought RSI; GLTA!
This is not only not advice, there is no position indicated and no strategy (not short, definitely not long!); just pure tutorial, enjoy!
PS the overlay is Sep/Oct 2020, amazing how it fits, even the little retracements on 21-24 Sep and 11-13 Oct are precisely timed...!
This one is running a week behind, looks like we peaked 10/21; to confirm on Fri 10/22, ERs tanking FB, SNAP, INTC techs overnight;
if double top is in, might expect weakness until ~5 Nov, if the zigzag pattern repeats. Bull trap?!
Not saying that it will, just something to think real hard about before you go plunging long IMO... at insanely overbought RSI; GLTA!
This is not only not advice, there is no position indicated and no strategy (not short, definitely not long!); just pure tutorial, enjoy!
PS the overlay is Sep/Oct 2020, amazing how it fits, even the little retracements on 21-24 Sep and 11-13 Oct are precisely timed...!

Bài đăng liên quan
Thông báo miễn trừ trách nhiệm
Thông tin và các ấn phẩm này không nhằm mục đích, và không cấu thành, lời khuyên hoặc khuyến nghị về tài chính, đầu tư, giao dịch hay các loại khác do TradingView cung cấp hoặc xác nhận. Đọc thêm tại Điều khoản Sử dụng.
Bài đăng liên quan
Thông báo miễn trừ trách nhiệm
Thông tin và các ấn phẩm này không nhằm mục đích, và không cấu thành, lời khuyên hoặc khuyến nghị về tài chính, đầu tư, giao dịch hay các loại khác do TradingView cung cấp hoặc xác nhận. Đọc thêm tại Điều khoản Sử dụng.