
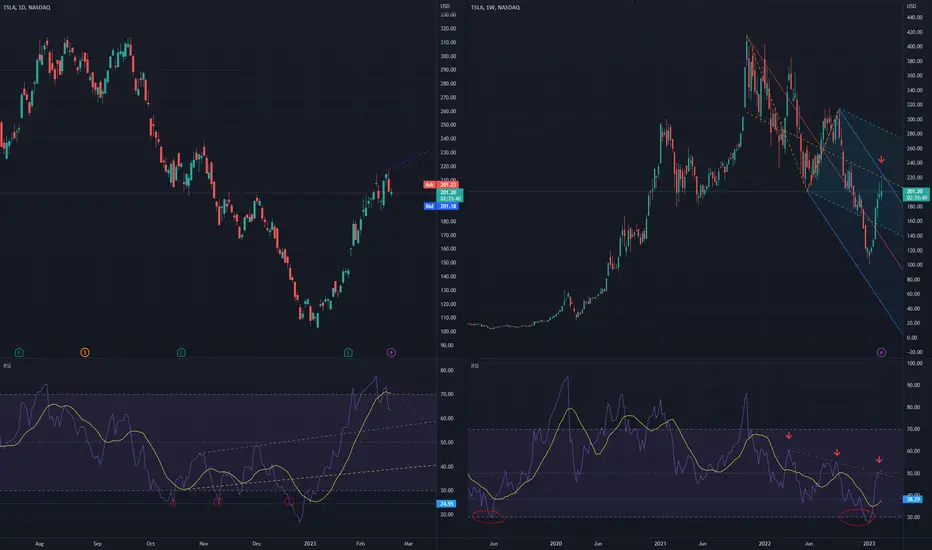
On weekly chart the price (almost) reached both the solid blue top pitchfork line and the middle orange pitchfork lines. Additionally, weekly RSI reached the dotted green resistance trendline. These are all bearish signs.
On daily chart, RSI has a bearish head-and-shoulders pattern and there is also a divergence between RSI (with purple trendline pointing downwards) and the PRICE (the purple trendline poingint upwards). Again, these are bearsih signs.
My previous TSLA idea was bullish and it went up 54% (from 137.80 to 212.11 when I gave the close signal), see related idea.
On daily chart, RSI has a bearish head-and-shoulders pattern and there is also a divergence between RSI (with purple trendline pointing downwards) and the PRICE (the purple trendline poingint upwards). Again, these are bearsih signs.
My previous TSLA idea was bullish and it went up 54% (from 137.80 to 212.11 when I gave the close signal), see related idea.
Đóng lệnh: đạt mục tiêu
TSLA went down 16% (from 201.20 to 173.50). Now it seems ready to go up again, see related idea.
Join free discord.gg/wDTkRnS or t.me/TradersForecast
Bài đăng liên quan
Thông báo miễn trừ trách nhiệm
Thông tin và các ấn phẩm này không nhằm mục đích, và không cấu thành, lời khuyên hoặc khuyến nghị về tài chính, đầu tư, giao dịch hay các loại khác do TradingView cung cấp hoặc xác nhận. Đọc thêm tại Điều khoản Sử dụng.
Join free discord.gg/wDTkRnS or t.me/TradersForecast
Bài đăng liên quan
Thông báo miễn trừ trách nhiệm
Thông tin và các ấn phẩm này không nhằm mục đích, và không cấu thành, lời khuyên hoặc khuyến nghị về tài chính, đầu tư, giao dịch hay các loại khác do TradingView cung cấp hoặc xác nhận. Đọc thêm tại Điều khoản Sử dụng.