1D Chart
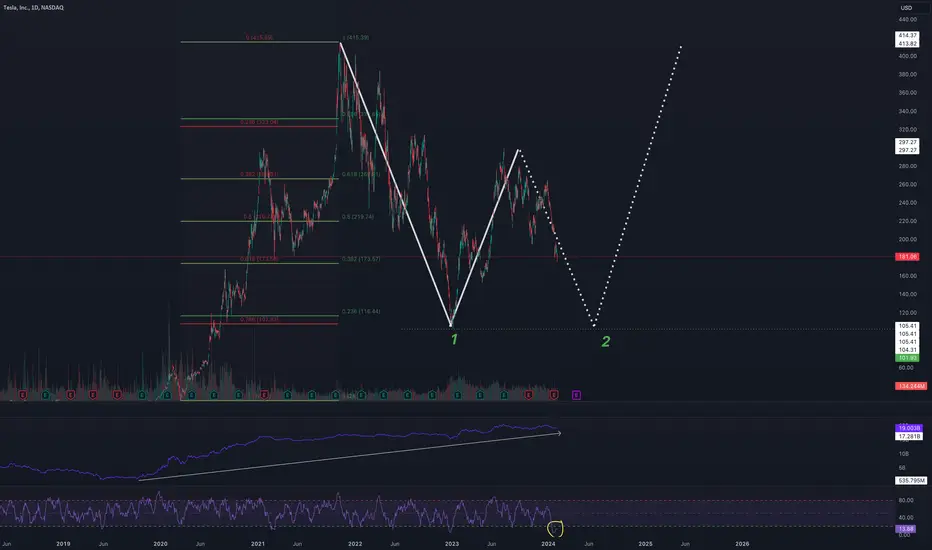
From a technical viewpoint, Tesla ( TSLA ) is setting up for a short-term recovery to the $200-210 range before another steep correction. Should significant support be met around the $100 range, a sharp recovery back to previous highs near $415 will be in sight. The following patterns are visible on the 1D chart:
Impulse and Correction Waves

Because the 1, 3, & 5 Impulse Waves were in the down direction, then according to Elliott Wave Theory, the Correction Waves (ABC) should see the beginning of a rally. Wave A will move opposite of Wave 5 and should lose momentum between $200-220 which are 50% & 61.8% Fibonacci Retracement levels respectively. Wave C would develop a double bottom setup that could propel TSLA back to $300.
Head & Shoulders

If the Elliott Waves do not prove valid then a H&S pattern is likely with a right shoulder peak meeting resistance between $200-220 before sending share prices back to a low of $100. I am less confident of this pattern as it appears a premature recovery is about to begin. The neckline rests around $150 but Money Flow Index is already in severely oversold territory and the On-Balance Volume has an overall positive slope.
Double Bottom

In the unlikely event that the H&S comes to fruition then I believe it will serve as the setup for a larger double bottom pattern. Stepping back for a better bird's eye view, the On-Balance Volume has a healthy positive slope and Money Flow Index is in oversold territory. However this pattern will take months to develop so it is too soon to begin loading up for this particular trade as a swing or day trader.
From a technical viewpoint, Tesla (
TSLA ) is setting up for a short-term recovery to the $200-210 range before another steep correction. Should significant support be met around the $100 range, a sharp recovery back to previous highs near $415 will be in sight. The following patterns are visible on the 1D chart:Impulse and Correction Waves
Because the 1, 3, & 5 Impulse Waves were in the down direction, then according to Elliott Wave Theory, the Correction Waves (ABC) should see the beginning of a rally. Wave A will move opposite of Wave 5 and should lose momentum between $200-220 which are 50% & 61.8% Fibonacci Retracement levels respectively. Wave C would develop a double bottom setup that could propel TSLA back to $300.
Head & Shoulders
If the Elliott Waves do not prove valid then a H&S pattern is likely with a right shoulder peak meeting resistance between $200-220 before sending share prices back to a low of $100. I am less confident of this pattern as it appears a premature recovery is about to begin. The neckline rests around $150 but Money Flow Index is already in severely oversold territory and the On-Balance Volume has an overall positive slope.
Double Bottom
In the unlikely event that the H&S comes to fruition then I believe it will serve as the setup for a larger double bottom pattern. Stepping back for a better bird's eye view, the On-Balance Volume has a healthy positive slope and Money Flow Index is in oversold territory. However this pattern will take months to develop so it is too soon to begin loading up for this particular trade as a swing or day trader.
Giao dịch đang hoạt động
1D CHART technical indicators suggest an imminent recovery.OBV: steep positive slope
RSI: RSI (green) crossed MA (red) from beneath while withdrawing from oversold territory
MACD: MACD (Green) just crossed its Signal Line (Red) from beneath

Thông báo miễn trừ trách nhiệm
Thông tin và các ấn phẩm này không nhằm mục đích, và không cấu thành, lời khuyên hoặc khuyến nghị về tài chính, đầu tư, giao dịch hay các loại khác do TradingView cung cấp hoặc xác nhận. Đọc thêm tại Điều khoản Sử dụng.
Thông báo miễn trừ trách nhiệm
Thông tin và các ấn phẩm này không nhằm mục đích, và không cấu thành, lời khuyên hoặc khuyến nghị về tài chính, đầu tư, giao dịch hay các loại khác do TradingView cung cấp hoặc xác nhận. Đọc thêm tại Điều khoản Sử dụng.