
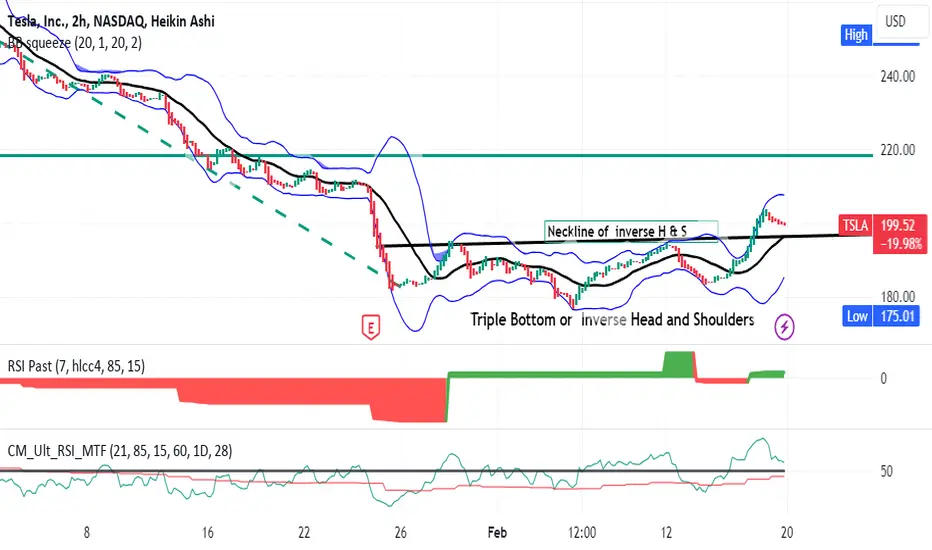
TSLA on the 120-minute time frame has finished off an inverse head and shoulders pattern with
the bottoms on January 26 February 6 and February 14 respectively. Price rose above the
neckline at 197 and appears to be trending to retest it. My target is 220 which is the 0.5 Fib
level of the prior immediate recent January trend down. The relative strength fast line
is dipping for a bounce off the 50 level horizontal line. The past RSI indicator shows much
improvement in strength. I will buy TSLA shares and options when price gets retraced to about
197 =/- 0.50. I expect this will happen on the next down general market day which could
be as early as the morning after this present holiday.
the bottoms on January 26 February 6 and February 14 respectively. Price rose above the
neckline at 197 and appears to be trending to retest it. My target is 220 which is the 0.5 Fib
level of the prior immediate recent January trend down. The relative strength fast line
is dipping for a bounce off the 50 level horizontal line. The past RSI indicator shows much
improvement in strength. I will buy TSLA shares and options when price gets retraced to about
197 =/- 0.50. I expect this will happen on the next down general market day which could
be as early as the morning after this present holiday.
Ghi chú
TLSA is approaching my buy point in the pre-market to take 5 shares and a call option for a strike of 220 by the March monthly as the first entry :Giao dịch đang hoạt động
Down trend predicted AI indicator and TTM put option for Strike $196 for 2/23 taken. Ghi chú
Price sideways for now.
Thông báo miễn trừ trách nhiệm
Thông tin và các ấn phẩm này không nhằm mục đích, và không cấu thành, lời khuyên hoặc khuyến nghị về tài chính, đầu tư, giao dịch hay các loại khác do TradingView cung cấp hoặc xác nhận. Đọc thêm tại Điều khoản Sử dụng.
Thông báo miễn trừ trách nhiệm
Thông tin và các ấn phẩm này không nhằm mục đích, và không cấu thành, lời khuyên hoặc khuyến nghị về tài chính, đầu tư, giao dịch hay các loại khác do TradingView cung cấp hoặc xác nhận. Đọc thêm tại Điều khoản Sử dụng.