
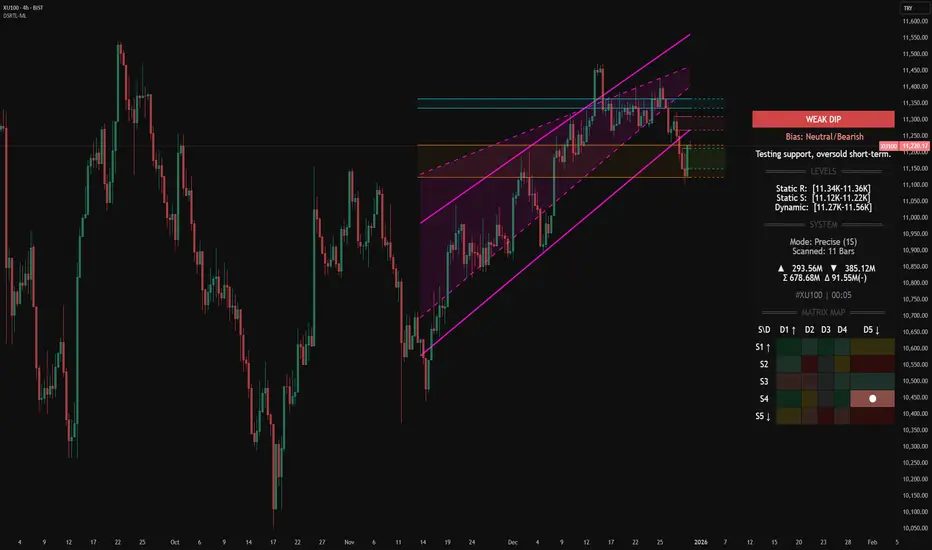
Dashboard-Driven Analysis: Beyond Traditional Line-Based Indicators
Why Modern Markets Demand Multi-Dimensional Data Visualization
━━━━━━━━━━━━━━━━━━━━━━━━━━━━━━━━━━━━━━━━━━━
📌 THE PROBLEM WITH TRADITIONAL ANALYSIS
For decades, technical analysis has relied primarily on drawing lines on charts — trend lines, moving averages, support/resistance levels. While these tools remain valuable, modern markets present a fundamental challenge:
- Hundreds of interacting variables
- Multiple timeframe correlations
- Volume-price-momentum relationships
- Institutional vs. retail flow dynamics
- Real-time regime changes
Trying to capture this complexity with "two lines crossing" is like trying to understand weather patterns by looking at a single thermometer.
━━━━━━━━━━━━━━━━━━━━━━━━━━━━━━━━━━━━━━━━━━━
🎯 THE SHIFT: FROM LINES TO MATRICES
A new analytical approach is emerging: Dashboard-Driven Analysis — using structured data tables, matrices, and multi-panel information displays to synthesize complex market data into actionable context.
Instead of asking: "Did the line cross?"
We ask: "What does the entire system state tell us?"
Key Principles:
1️⃣ Multi-Factor Synthesis
Rather than isolated signals, dashboards combine:
- Price location (spatial context)
- Volume profile (participation quality)
- Flow dynamics (buyer vs. seller dominance)
- Momentum regime (acceleration/deceleration)
- Statistical deviation (Z-scores, percentiles)
2️⃣ State Classification
Markets exist in distinct "states" or "regimes":
- Trending vs. ranging
- Accumulation vs. distribution
- Climactic vs. exhausted
- High-conviction vs. low-liquidity
Dashboards classify these states explicitly rather than leaving interpretation to guesswork.
3️⃣ Real-Time Context Awareness
Traditional indicators tell you WHAT happened.
Smart dashboards tell you WHERE you are and WHAT it means.
━━━━━━━━━━━━━━━━━━━━━━━━━━━━━━━━━━━━━━━━━━━
📊 PRACTICAL DASHBOARD COMPONENTS
A well-designed analytical dashboard typically includes:
Section 1: Current State Vector
- Direction bias with confidence level
- Price position relative to key levels
- Volume quality assessment
Section 2: Structure Analysis
- Support/resistance matrix
- Level proximity detection
- Breakout/rejection probability
Section 3: Flow Dynamics
- Buy vs. sell volume decomposition
- Delta (net flow) measurement
- Pressure imbalance detection
Section 4: Signal Quality Scoring
- Multi-layer validation system
- Grade-based confidence rating
- Risk/reward context
━━━━━━━━━━━━━━━━━━━━━━━━━━━━━━━━━━━━━━━━━━━
💡 WHY THIS MATTERS
The evolution from line-based to dashboard-based analysis reflects a broader truth:
Markets are systems, not simple patterns.
A dashboard approach helps traders:
✓ Avoid false signals by requiring multi-factor confirmation
✓ Understand context before acting
✓ Recognize regime changes earlier
✓ Make decisions based on synthesis, not isolated triggers
This doesn't mean traditional tools are obsolete — it means they work better when integrated into a comprehensive information framework.
━━━━━━━━━━━━━━━━━━━━━━━━━━━━━━━━━━━━━━━━━━━
⚠️ IMPORTANT NOTES
- No indicator or dashboard can predict the future
- All analytical tools require proper risk management
- Dashboard complexity should serve clarity, not create confusion
- The goal is better decisions, not more information
This educational content presents a conceptual framework for thinking about market analysis in a more systematic way.
━━━━━━━━━━━━━━━━━━━━━━━━━━━━━━━━━━━━━━━━━━━
📚 CONCLUSION
As markets evolve, so must our analytical tools. The shift toward dashboard-driven, multi-dimensional analysis represents not a rejection of traditional methods, but an evolution — synthesizing multiple data streams into coherent, actionable market context.
The question is no longer just "What does the chart show?"
It's "What does the entire market structure tell us?"

Measuring markets through Volume Dynamics & Geometric Frameworks.
For invite-only script access, DM on TradingView or via x.com/sabanci_ata
For invite-only script access, DM on TradingView or via x.com/sabanci_ata
Bài đăng liên quan
Thông báo miễn trừ trách nhiệm
Thông tin và các ấn phẩm này không nhằm mục đích, và không cấu thành, lời khuyên hoặc khuyến nghị về tài chính, đầu tư, giao dịch hay các loại khác do TradingView cung cấp hoặc xác nhận. Đọc thêm tại Điều khoản Sử dụng.