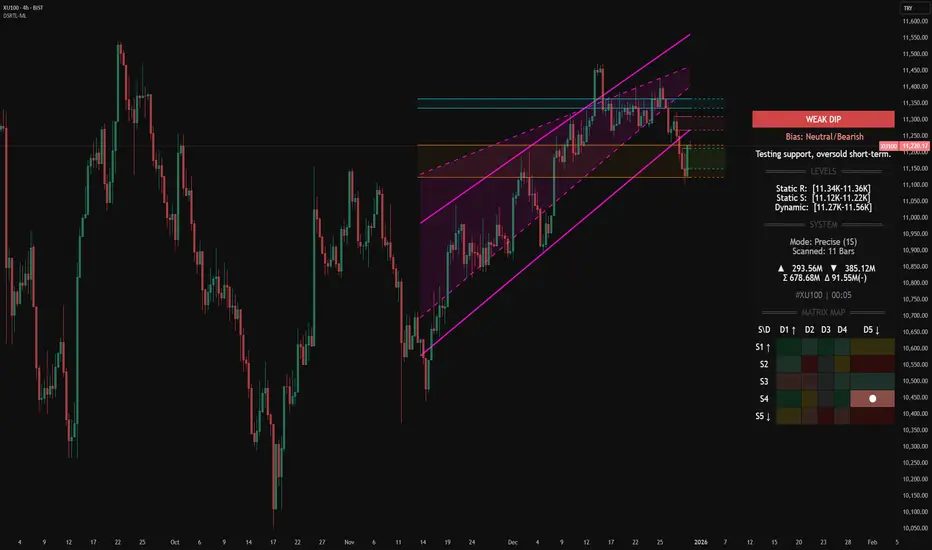
Bist100 Teknik GörünümWe are tracking the blue line that represents the decline starting from the 14,605 level on September 10.
The first sign of a reversal would be a close above the 11,000–11,150 zone, followed by holding that position. Next, we would need to clear the 11,200–11,300 range.
What matters most to me i
BIST 100 Index
No trades
No trades
Compare with BIST 100
BIST 100 market breadth
AdvancingDeclining
74 · 74%26 · 26%
Net advances
+48
A/D ratio
2.85
Up / down volume
3 B / 1.5 B
Index info
ISIN
TRAIMKB00010
FIGI
BBG000SB0M87
Identifiers
ISIN TRAIMKB00010
The BIST 100 is the primary stock market index for Borsa Istanbul, representing the performance of 100 large and highly liquid companies traded on the Turkish stock exchange. It is weighted by free-float market cap, meaning larger, publicly traded companies exert the most influence on its value. Traders and investors use the BIST 100 to gauge the overall health of the Turkish economy and to gain exposure to one of the most active emerging markets.
BIST 100 #1: Four Measures Since the September 2021 Rate CutThe chart
The measurement starts on September 23, 2021, the day the Central Bank of the Republic of Türkiye began its rate cutting cycle. The chart is on the daily timeframe and on the percent scale. Next to the BIST 100 index I put four measures, to show where the BIST 100 index sits against each
#XU100 The shares accumulated during the period marked by the red circle are being distributed during the period highlighted by the yellow rectangle.
Once there are no more shares left to sell, a free fall will begin.
Then the question becomes:
When will they start accumulating again?
No one knows...
Why Modern Markets Demand Multi-Dimensional Data Visualization?Dashboard-Driven Analysis: Beyond Traditional Line-Based Indicators
Why Modern Markets Demand Multi-Dimensional Data Visualization
━━━━━━━━━━━━━━━━━━━━━━━━━━━━━━━━━━━━━━━━━━━
📌 THE PROBLEM WITH TRADITIONAL ANALYSIS
For decades, technical analysis has relied primarily on drawing lines on chart
XU100 — BIST100 indexStarting from the assumption that the corrective movement which began on July 18, 2024, is a WXY pattern, I consider the current movement to be the final leg of this formation. Accordingly, I have marked in yellow on the chart what I see as the most likely reversal date and target price level. The
Will BIST100 beat inflation?BIST100, which has been trending horizontally and falling for a long time, I think it can rise from here and the final rise phase will come. It is too early to say this before the new ATH comes, but I think the 10.9k region is the decision point. When it stays above it, after a move to the 11.8 regi
See all ideas
Summarizing what the indicators are suggesting.
Oscillators
Neutral
Oscillators
Neutral
Summary
Neutral
Summary
Neutral
Summary
Neutral
Moving Averages
Neutral
Moving Averages
Neutral
Displays a symbol's value movements over previous years to identify recurring trends.
Frequently asked questions
Today, BIST 100 Index is 11,023.55.
For broader market analysis, dive into the technicals on the BIST 100 Index live chart and read the latest BIST 100 Index news:
– Istanbul’s main index set for 7th weekly loss in a row, longest streak since 1987
– Turkey - Factors to Watch on Oct 30
– Turkey - Factors to Watch on Oct 28
For broader market analysis, dive into the technicals on the BIST 100 Index live chart and read the latest BIST 100 Index news:
– Istanbul’s main index set for 7th weekly loss in a row, longest streak since 1987
– Turkey - Factors to Watch on Oct 30
– Turkey - Factors to Watch on Oct 28
To put today's market move into context, compare the BIST 100 Index's performance across different time periods:
– 1 day — +0.56%
– 1 week — −1.03%
– 1 month — −10.17%
The BIST 100 Index's all-time low was 0.01 on Apr 17, 1986, while its all-time high was 15,204.92 on May 11, 2026.
Explore the Stock Heatmap and the BIST 100 Index live chart to see how the broader market is performing.
– 1 day — +0.56%
– 1 week — −1.03%
– 1 month — −10.17%
The BIST 100 Index's all-time low was 0.01 on Apr 17, 1986, while its all-time high was 15,204.92 on May 11, 2026.
Explore the Stock Heatmap and the BIST 100 Index live chart to see how the broader market is performing.
On the BIST 100 Index, the top performer over the past year is Tekfen Holding Anonim Sirketi, with a gain of 125.65%.
Here's how it's been performing lately:
– Today — −4.26%
– 1 week — +5.76%
– 1 month — −25.43%
Remember:
– Performance can change quickly — today's leader may not stay on top
– High returns may come with higher volatility or risk
– Past performance doesn't guarantee future results
The best-performing component shows where momentum is strongest — but always look beyond returns to assess sustainability. Check out the Economic Calendar, Stock Heatmap, and other tools.
Here's how it's been performing lately:
– Today — −4.26%
– 1 week — +5.76%
– 1 month — −25.43%
Remember:
– Performance can change quickly — today's leader may not stay on top
– High returns may come with higher volatility or risk
– Past performance doesn't guarantee future results
The best-performing component shows where momentum is strongest — but always look beyond returns to assess sustainability. Check out the Economic Calendar, Stock Heatmap, and other tools.
The biggest companies in the BIST 100 Index include Aselsan Elektronik Sanayi ve Ticaret A.S. Class B, Tupras Turkiye Petrol Rafinerileri A.S., and Turkiye Garanti Bankasi Anonim Sirketi, with market capitalizations of approximately 30.60 B USD, 12.73 B USD, and 10.65 B USD.
The largest companies shape the direction of the BIST 100 Index — tracking them helps you understand what's moving the market.
What to check next:
– Growth and earnings: Are these companies still expanding?
– Valuation: Are they fairly priced relative to peers?
– Sector exposure: Is the index heavily weighted toward one industry?
Check these and more metrics in our Stock Screener and Heatmap.
The largest companies shape the direction of the BIST 100 Index — tracking them helps you understand what's moving the market.
What to check next:
– Growth and earnings: Are these companies still expanding?
– Valuation: Are they fairly priced relative to peers?
– Sector exposure: Is the index heavily weighted toward one industry?
Check these and more metrics in our Stock Screener and Heatmap.
The lowest recorded level of the BIST 100 Index is 0.01, reached on Apr 17, 1986.
It shows where the market hit its deepest decline — but combining it with highs, drawdowns, and long-term returns gives a fuller picture.
For more context, check other metrics too:
– All-time high — 15,204.92: Compare drawdowns and recovery strength
– Annual change — 0.04%: Average annual performance over time
– Technical rating — sell: Indicator-based signals (buy/sell/neutral) to assess current market momentum
It shows where the market hit its deepest decline — but combining it with highs, drawdowns, and long-term returns gives a fuller picture.
For more context, check other metrics too:
– All-time high — 15,204.92: Compare drawdowns and recovery strength
– Annual change — 0.04%: Average annual performance over time
– Technical rating — sell: Indicator-based signals (buy/sell/neutral) to assess current market momentum
The BIST 100 Index consists of 100 instruments, including stocks of companies such as Aselsan Elektronik Sanayi ve Ticaret A.S. Class B, Tupras Turkiye Petrol Rafinerileri A.S., Turkiye Garanti Bankasi Anonim Sirketi, and others.
Why index composition matters:
– Helps identify key players and trends within the index
– Used as a base for ETFs and index funds
– Useful for benchmarking individual assets
Index BIST 100 Index components show what drives the index's performance — exploring them helps uncover trends and opportunities.
Why index composition matters:
– Helps identify key players and trends within the index
– Used as a base for ETFs and index funds
– Useful for benchmarking individual assets
Index BIST 100 Index components show what drives the index's performance — exploring them helps uncover trends and opportunities.
On the BIST 100 Index, some of the highest-priced stocks include EGEEN, BRYAT, and BRSAN, trading at 3,937.50 TRY, 1,215.00 TRY, and 650.00 TRY per share.
What it means:
– High share price ≠ higher value: Price per share doesn't reflect total company size (market cap does)
– No stock splits: Expensive stocks often haven't split their shares
– Lower accessibility: Higher prices may require larger capital per position
Knowing the most expensive components can be useful for traders who consider position sizing and capital allocation.
What to check next:
– Market cap: True measure of company size
– Valuation ratios (P/E, etc.): Whether the stock is expensive fundamentally
– Stock split history: May affect accessibility and price perception
You can follow these and more metrics in our Stock Screener.
What it means:
– High share price ≠ higher value: Price per share doesn't reflect total company size (market cap does)
– No stock splits: Expensive stocks often haven't split their shares
– Lower accessibility: Higher prices may require larger capital per position
Knowing the most expensive components can be useful for traders who consider position sizing and capital allocation.
What to check next:
– Market cap: True measure of company size
– Valuation ratios (P/E, etc.): Whether the stock is expensive fundamentally
– Stock split history: May affect accessibility and price perception
You can follow these and more metrics in our Stock Screener.
On the BIST 100 Index, the weakest performer right now is Europen Endustri Insaat Sanayi ve Ticaret A.S., down 74.83% over the past year.
Here's how it's been performing lately:
– Today — +2.28%
– 1 week — −1.75%
– 1 month — −22.49%
Remember:
– Weak performance can be temporary or cyclical
– Some laggards may become recovery or turnaround opportunities
– Past losses don't guarantee future declines
The worst-performing component highlights where the market sees the most weakness — but it can also signal potential opportunities if conditions improve. Check out the Economic Calendar, Stock Heatmap, and other tools to stay updated.
Here's how it's been performing lately:
– Today — +2.28%
– 1 week — −1.75%
– 1 month — −22.49%
Remember:
– Weak performance can be temporary or cyclical
– Some laggards may become recovery or turnaround opportunities
– Past losses don't guarantee future declines
The worst-performing component highlights where the market sees the most weakness — but it can also signal potential opportunities if conditions improve. Check out the Economic Calendar, Stock Heatmap, and other tools to stay updated.
The safest way to invest in BIST 100 Index is through a reliable broker. Create an account, fund it, and place a buy order for index futures or other derivatives.
You can trade BIST 100 Index directly from TradingView:
– Choose a broker: Explore our supported trading partners and pick one that fits your needs
– Compare options: View available brokers side by side to evaluate fees and features
– Connect your account: Open Supercharts, click "Trade", select your broker, and log in
– Start trading: Place orders without leaving the chart
Tip: If you're new to trading, try paper trading first — it lets you practice strategies in real market conditions without risking funds.
You can trade BIST 100 Index directly from TradingView:
– Choose a broker: Explore our supported trading partners and pick one that fits your needs
– Compare options: View available brokers side by side to evaluate fees and features
– Connect your account: Open Supercharts, click "Trade", select your broker, and log in
– Start trading: Place orders without leaving the chart
Tip: If you're new to trading, try paper trading first — it lets you practice strategies in real market conditions without risking funds.
The BIST 100 Index reached its all-time high of 15,204.92 on May 11, 2026.
All-time highs show where the market reached peak strength — but combining them with trends, valuations, and technical signals gives a clearer picture.
For more context, check other metrics too:
– All-time low — 0.01: Compare drawdowns and recovery strength
– Annual change — 0.04%: Average annual performance over time
– Technical rating — sell: Indicator-based signals (buy/sell/neutral) to assess current market momentum
All-time highs show where the market reached peak strength — but combining them with trends, valuations, and technical signals gives a clearer picture.
For more context, check other metrics too:
– All-time low — 0.01: Compare drawdowns and recovery strength
– Annual change — 0.04%: Average annual performance over time
– Technical rating — sell: Indicator-based signals (buy/sell/neutral) to assess current market momentum