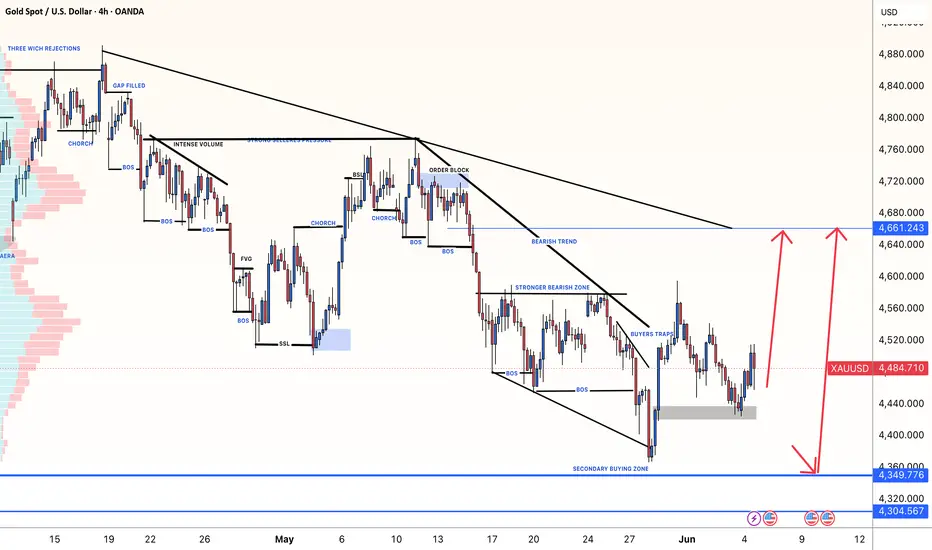
The Pullback That FOOLS Most TradersOne of the simplest ways I teach traders to identify a trend is to look at the direction of price.
If price is moving from the bottom-left to the top-right, you're looking at a bullish trend.
Simple.
And sometimes keeping things simple is exactly what we need because the more we learn about trading, the easier it becomes to overcomplicate what we're seeing.
From a more rules-based perspective, we're also still in a bullish continuation state because price has broken and closed above previous structure highs.
But here's where things get interesting…
Bullish trends don't move straight up.
They extend, they pull back, and then they can extend again.
So if you're looking to participate in the next move higher, you don't necessarily want to chase price at the highs.
You want to know where that pullback could potentially take you.
And I have a couple of levels on my radar.
The first is a retest of the previous structure high.
But there's another area that's particularly interesting to me.
If we drop down to the 4-hour chart, we can see that the market may be developing what we call a complex pullback.
And this is something a lot of traders misunderstand.
They know that markets pull back.
What they don't always realize is that a pullback doesn't have to happen in one clean move.
Sometimes the market takes a longer, more complicated route before continuing in the original direction.
That's what I'm watching for here.
And when I measure the potential pullback, something interesting happens.
We have an AB=CD / 1:1 measured move lining up with a 1.618 Fibonacci extension — right inside the larger area of interest.
That's multiple pieces of information pointing toward the same zone.
So if the Dow gives us more downside at the beginning of the week, I'm not immediately thinking:
“The bullish trend is over.”
I'm thinking:
“Is this simply a deeper pullback creating a better buying opportunity?”
As far as targets go, the first obvious objective is a retest of the previous highs.
But because we're dealing with an index that's still in a strong bullish trend, I wouldn't necessarily be in a hurry to exit everything there.
If the trend continues, I'd rather give a portion of the position room to run and see just how far that train can go.
The key is recognizing the difference between a trend reversal and a pullback that simply looks scary.
And right now, the Dow is giving us a reason to pay very close attention to that distinction.
If you have any questions, comments or want to share you views, please do so below. And I hope you have both a safe and profitable week of trading!
Akil  Long
Long

 Long
Long
 Long
Long
Platinum: Cup-and-Handle breakout, WPIC deficit;trade setup!The platinum trade appears to be the least recognized asset in the precious metals complex at this time and today's chart may have just delivered the technical confirmation that has been brewing within the markets for months now. Even though the focus from investors all year long has been on the gold and silver trades, the platinum market has been quietly developing its own structural bull thesis that takes into account the generational supply crunch, the AI demand tailwind that has not yet been priced in by many analysts, and the geopolitical factor that is now starting to unwind in favor of the South African mining industry. According to the World Platinum Investment Council, there is expected to be another annual deficit in 2026, with the total deficit over the last three years reaching 3 million ounces, while the supply crunch is forecast to continue for another year with a deficit of 297,000 ounces.Valterra Platinum, the biggest miner of primary platinum and accounting for around 38% of total platinum mined worldwide, recorded a notable rise in its interim profits this week and, in a statement that deserves much more recognition than it received, stated that it sees demand related to AI infrastructure rising notably in the next few years. Platinum is an important part of the fuel cells and hydrogen electrolysers and also plays a major role in the cooling system of dense AI data centers. This is an important source of demand that will only keep rising and comes on top of the demand for catalytic converters from automobiles that has been more resilient than initially expected from the EV transition. Positive sentiment regarding the potential agreement between US and Iran regarding the opening of the Strait of Hormuz has provided a specific tailwind for South African producers of platinum as reduced oil prices reduce their energy costs..
This is especially true on the daily chart;as the technical analysis here points to something more than an improving commodity; it shows something far more interesting ;a classic technical pattern developing in real-time. The cup-and-handle pattern has been developing in platinum for some time since its highs at around $2,100 in May. The left side of the cup developed through the steep decline in prices through the period of May to June as platinum corrected its highs. The base of the cup developed in the lows seen in July between $1,630 and $1,660;a classic accumulation base that held ground despite the pressures that were pushing other commodities downward at the same time. The right side of the cup is currently being developed with the ongoing recovery in prices into early August. And the handle – the shallow correction that precedes the breakout – seems to have formed in the consolidation that occurred prior to the current session’s rally of 2.32%. The EMA structure has undergone a quiet but decisive transformation.The EMA 9 and EMA 20, which have been hanging out in a falling formation above the price levels for the month of June and July, serving as resistive caps on each and every upward move, are now being retaken and are curling upwards into formation. The MA Cross of the 9 and 21 EMAs at the price levels of $2,093 and $2,016 respectively now stands as the first significant level of resistance towards getting back to the high levels of May. The RSI at 63.86 now stands comfortably above its signal line at 47.39, forming a difference of 16 points and thus signaling how much buying power is now entering this market. It is high but not overbought yet, which leaves us with enough technical space until we reach exhaustion territory. The MACD forms the most constructive part of the picture now. The MACD line at 11.8 is now crossing over the signal line at 9.8, while the histogram at −2.1 is contracting sharply towards zero. Convergence of the forming cup & handle pattern, the recycled EMA configuration, the RSI being above its signal line and with further headroom to go, the MACD in the final stages of its bullish cross on a commodity that has a 3 million ounces of accumulated structural deficit behind it is the best technical and fundamental convergence I have seen this week on any instrument.
Trade recommendation
Direction : Long
Entry horizon: $1,780 – $1,800
Primary target : $2,016
Secondary target : $2,094
Stop loss : Daily close below $1,663
Technical scenarios
Cup-and-handle breakout confirms;measured move to $2,300 : Today’s decisive 2.32% rally on volume of 8.94K marks the formal validation of the handle breakout. Technical momentum is accelerating as the MACD histogram prepares to flip positive within the coming sessions, while the RSI charges toward the 70 level for the first time since the May peak. This price action initiates a measured move targeting the MA Cross resistance at $2,016. Derived from the cup’s depth, the projected target of $2,250 to $2,300 aligns with both Commerzbank’s year-end forecast and historical resistance zones. Should a US-Iran agreement reopen the Strait of Hormuz, the resulting reduction in energy costs for South African producers would serve as the fundamental catalyst transforming this technical setup into a full-scale market re-rating.
Breakout retest before continuation : Following the initial impulsive surge, price may undergo a standard mean reversion toward the $1,750 to $1,780 breakout zone. This classic retest would allow the RSI to cool toward the 55 midline and the MACD histogram to consolidate before its final bullish crossover, while the rising EMA cluster acts as a structural floor. Rather than indicating a failed move, this scenario represents a low-risk secondary entry point for late participants. Crucially, the pattern remains intact as long as the handle low at $1,663 is defended on a closing basis.
Pattern failure;geopolitical reversal : A breakdown in US-Iran negotiations could trigger a renewed spike in energy overhead for South African operations, potentially reigniting the ETF outflows that pressured the metal during the Q1 2026 surplus. In this bearish alternative, the MACD fails to achieve positive territory, the RSI collapses below 50, and the EMA support cluster between $1,663 and $1,684 is breached. A daily close beneath the handle low of $1,663 would formally invalidate the cup-and-handle structure, identifying the current move as a bull trap. Until such a violation occurs, the convergence of structural deficits and technical confirmation remains the primary investment thesis.
 Long
Long
 Long
Long
 Short
Short
 Long
Long
 Long
Long
Accenture (ACN): Falling-Angel in the selloff ...[Accenture (ACN): Falling-Angel in the selloff — Navarro200 signals a bottom formation ...
NYSE:ACN
www.tradingview.com
Hello ❤TradingView Community😍
Accenture plc (NYSE: ACN) - On the weekly-chart.
This idea highlights the major, multi-year correction following the all-time high of $417.37 (Dec 2021) and focuses on the resulting Navarro200 harmonic pattern. The chart shows a clean, symmetrical M-pattern (X-A-B-C-D) with a distinct potential reversal zone near the current low.
A further price decline toward the key psychological level of $100 or a dip just below it must be factored in.
Potential PRZ/bottom range: $118–$135 (D-zone; marked on the chart as $118.15, current price range around $135)
Interpretation of the Navarro200
Pattern concept: Following a strong rally (X→A), a three-phase correction complex is being completed (A→B→C→D). The completion at D often results from the convergence of multiple Fibonacci projections/retracements. This exact overlap is present here—a classic sign of a potential trend reversal or, at the very least, an extended rebound phase.
Significance of 242.80 USD: This level acts as the pattern’s “central axis/neckline” and as a prominent retracement pivot. A sustained rise above this level would significantly strengthen the bullish scenario and open up room toward the higher retracement targets.
Possible bottom-forming-phase + key volume-levels (volume-profile) - monthly-chart
Following a correction of approximately 72%, the price has fallen into the PRZ and is showing initial signs of stabilization. For a valid bottom to form, I expect:
A sideways/accumulation phase spanning several monthly candles between approximately 118 and 155 USD.
A higher low above the D-zone (ideally >$125–130) as confirmation that sellers are running out of steam.
A monthly close above a nearby trigger zone—typically $155/$165—as the first structural signal.
A breakout above 242.80 USD would be the second, stronger confirmation that the market is shifting from “bottom” to “trend reversal” mode.
Potential Wolfe-Wave
From Elliott Wave's perspective
Scenarios
Bullish: Stabilization above 125–130 USD, breakout >155/165 USD, followed by a rally toward 200 and 232–243 USD. A breakout and hold above 242.80 USD opens the path to 268/302 USD.
Bearish/Invalidation: A monthly close below 118 USD negates the bottom hypothesis. In this case, psychological round numbers (100 USD) and lower historical zones come into focus.
Risk Management (for Swing/Position Traders)
Aggressive: Open a partial position in the D-zone (125–140 USD) with a tight stop-loss below 118 USD; add to the position upon confirmation (monthly close >155/165 USD).
Conservative: Wait to trade until the monthly close is above 165 USD or until 200 USD is regained; a second surge above 242.80 USD would confirm the trend.
Adjust position size to the monthly time frame; be mindful of event risks (earnings, macro, USD strength).
Conclusion
Accenture is showing a large Navarro200 pattern with clean convergence at the D-Zone around 118–135 USD. Such setups often mark the end of cyclical corrections. An extended bottoming phase is likely; clear bullish signals will only emerge with successive higher lows and monthly closes above 155/165 USD—and will be structurally confirmed above 242.80 USD. Until then, patience and disciplined risk management remain key.
As always, this is not investment advice. I am not personally invested.
I look forward to hearing your opinions and seeing your charts😍 — how are you trading this potential bottoming pattern in ACN ?
Have a good start to the week & successful trading decisions 💪
M_a_d_d_e_n ✌
NOTE: The above information represents my idea and is not an investment/trading recommendation! Without any guarantee & exclusion of liability!
 Long
Long
 Long
Long
Long 
GBP/USD | Rejection at Key Supply Favors Move Towards 1.3000GBP/USD has rallied into a key area of technical confluence, where I believe bullish momentum is beginning to lose strength. Following the completion of an A–B–C corrective structure, price has tested a well-defined 4-hour rejection area positioned beneath the 15th June High and in close proximity to the 200-period moving average. This region represents a significant supply zone where sellers have previously demonstrated control. Combined with elevated RSI readings and the completion of the corrective advance, the current price action suggests the market may be preparing for a broader bearish continuation. My primary downside objective remains the psychological 1.3000 level, which aligns with both a 1.618 Fibonacci extension and a previously identified support zone, creating a high-confluence target.
To illustrate my projected market sequence, I have incorporated TradingView’s Ghost Feed as a visual representation of the expected price path should sellers continue to defend the highlighted rejection area. The projected candles are intended to support the broader technical narrative rather than serve as the foundation of the analysis. From a macro perspective, while Sterling continues to benefit from a relatively supportive Bank of England stance and recent US dollar softness, I currently view these factors as insufficient to invalidate the technical structure developing on the 4-hour timeframe. Instead, I see the potential for a tactical correction within the broader market context, particularly if upcoming US economic data provides renewed support for the dollar.
Key Takeaway
My bias remains bearish while price continues to respect the highlighted rejection area below the 15th June High. A sustained rejection from this zone would reinforce the expectation of a move towards the 1.3000 key level, while a decisive close above the supply zone would invalidate the current bearish thesis and shift the focus towards further upside. As always, this analysis is based on probabilities rather than certainty, and I will continue to allow price action to confirm or reject the scenario before adjusting my outlook. AUDUSD: Bearish Confluence at April Highs, Targeting 0.7000AUDUSD is approaching a significant resistance confluence beneath the April Highs, where multiple technical factors suggest the potential for a bearish reversal. Price is currently forming the right shoulder of a Head & Shoulders pattern while simultaneously trading into a key liquidity pool above prior highs, creating the possibility of a buy-side liquidity sweep before lower prices. This area also coincides with the completion of an AB=CD harmonic structure, while the projected downside target aligns closely with the 1.618 Fibonacci extension and the major psychological support level at 0.7000. Further strengthening the bearish case, the recent rally has already extended approximately 2x ADR from the previous weekly cycle’s PFL. With the first week of June now underway, a final expansion higher toward the 3x ADR threshold could provide the ideal conditions for a liquidity sweep above the April Highs, potentially creating a false breakout before price rotates lower. Such a move would complete the broader technical confluence and support a bearish continuation toward the 0.7000 objective.
From a fundamental perspective, upcoming Australian GDP and US Non-Farm Payrolls data could provide the catalyst for directional movement. A weaker-than-expected Australian GDP print would reinforce concerns surrounding slowing economic growth and potentially increase expectations of a less restrictive RBA stance, weighing on the Australian Dollar. Conversely, stronger US employment data would likely support the US Dollar by reinforcing the narrative of a resilient US economy and delaying expectations for Federal Reserve rate cuts. Should these macroeconomic themes align with the existing technical structure, a rejection from the April High liquidity zone could open the path toward the 0.7000 objective and complete the broader bearish harmonic projection.
MANAUSDT: AB=CD Pattern Signals More Downside?#MANA continues to respect its bearish market structure, with sellers firmly in control. On the 1-hour timeframe, price is developing a Bearish AB=CD Harmonic Pattern, indicating that another leg lower could be approaching.
Analysis Timeframe: 1H
Bias: Bearish 🔴
However, there is currently no bullish confirmation on the chart. Trying to catch a bottom in a strong downtrend can be risky, so patience remains the best strategy.
Trade Plan
Bearish AB=CD pattern is nearing completion.
Overall trend remains bearish.
No bullish divergence or reversal structure has formed.
Waiting for the previous Higher Low (HL) / key support level to break.
A retest of the broken support as resistance will provide the highest-probability short entry.
Entry Strategy
Entry: After support breakdown + successful retest
Stop Loss: Above the retest high or recent swing high
Take Profit: Next major support levels using a minimum 1:2 or better Risk-to-Reward ratio
Risk Management: Never risk more than 1% of your trading capital on a single trade.
Invalidation
If buyers defend the current support and reclaim the previous lower highs, this bearish setup will lose its validity. Until then, the trend continues to favor the sellers.
Key Takeaway
The trend is your friend. Rather than predicting reversals, wait for the market to confirm the breakdown. Trading with confirmation instead of emotion significantly improves consistency over the long run.
What do you think?
Will #MANA break support and continue its downtrend?
Or are the bulls preparing a surprise reversal?
Share your analysis in the comments!
If you found this analysis helpful, please Boost, Like, Comment, and Follow for more high-probability crypto setups and educational market analysis.
#MANA #MANAUSDT #Crypto #Altcoins #TechnicalAnalysis #ABCDPattern #HarmonicTrading #PriceAction #TradingView #CryptoTrading #Bearish #Breakdown #RiskManagement #DayTrading #SwingTrading #SupportResistance #ChartAnalysis #TradeSetup #EliteTechnicalAnalysisHub  Short
Short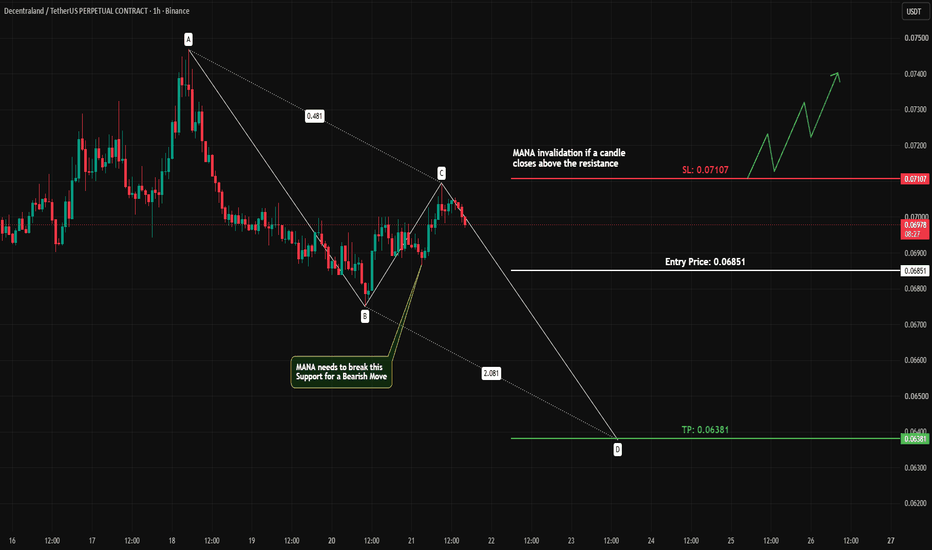
 Short
Short
 Long
Long
 Long
Long
Long 
Long