BITCOIN - Bullish trend. Consolidation before rallyBINANCE:BTCUSDT.P previously went through a trend reversal phase and broke above the key 83K resistance. Consolidation is forming above this zone, hinting at further upside, however...
The fundamental backdrop remains unstable. However, profit-taking in BTC is currently not particularly strong, and there is no significant selling pressure. Consolidation following the strong rally, along with the weak reaction to negative news, points to market strength. Spot ETF inflows are gaining momentum. Trading volumes are increasing. Altcoins are showing strong growth, so far without significant leverage. Technically, the backdrop is becoming increasingly favorable...
Bitcoin is breaking through the 83K resistance and consolidating above this zone, indicating readiness for a rally. The market is confirming the trend reversal; however, a correction aimed at hunting liquidity could occur before further upside. The key focus is on 82,300–80K.
Resistance levels: 87,400, 90,000, 100K
Support levels: 82,800, 82,300, 80K
The retest of the May support level formed a 82,800–82,300 liquidity pool, which could be tested before another move higher. A long squeeze could shift the balance of power in favor of buyers and trigger further upside toward 90K–100K.
Best regards, R. Linda!  Long
Long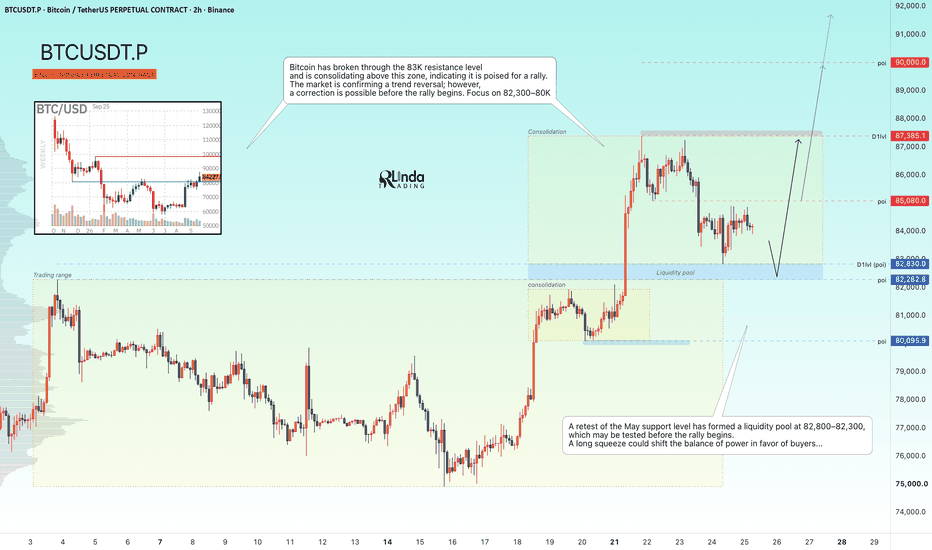
 Long
Long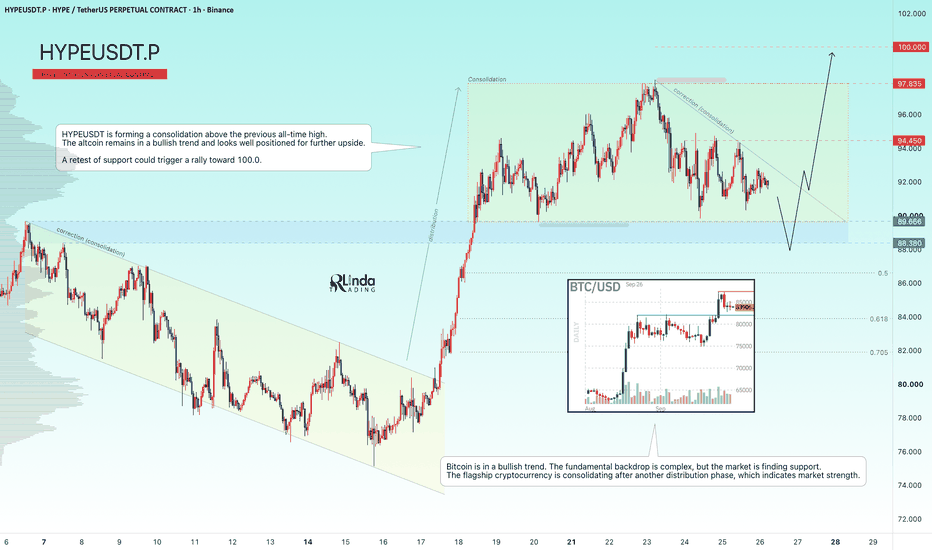
US10Y Enters a Major PRZ: Is a Treasury Yield Correction Next?The U.S. 10-Year Treasury Yield ( TVC:US10Y ) is one of the most important benchmarks for global interest rates and financial conditions.
When US10Y rises sharply, it can tighten financial conditions and pressure stocks, gold, Bitcoin, and other risk assets. A decline in yields can have the opposite effect and support these markets.
US10Y has now entered an important technical area. Can the bullish trend continue, or is a correction about to begin?
Technical Analysis
US10Y has developed a strong bullish move over the past 2–3 days and has now entered the Resistance Zone(5.55%-4.93%).
It is also trading near the upper trendline of an Ascending Channel, the major Potential Reversal Zone(PRZ) , Monthly Resistance 5, and Yearly Resistance 2.
This technical confluence could become an important reversal area.
From an Elliott Wave perspective, US10Y appears to be completing Wave 5, after which corrective waves could begin developing to the downside.
💡 Educational Note: A decline in Treasury yields generally reduces pressure on financial conditions and can support non-yielding assets such as gold, as well as risk assets like Bitcoin and U.S. equities.
I expect the U.S. 10-Year Treasury Yield to begin a corrective move from this area.
If this scenario develops, lower yields could support higher prices in gold, Bitcoin, and major U.S. stock indices.
Trade Setup
First Take Profit(TP): 5.03%
Second Take Profit(TP): 4.95%
Stop Loss(SL): 5.29%
Which level do you think US10Y will reach first?
🔴 4.95%
🟢 5.29%
📌 U.S. 10-Year Treasury Yield(US10Y), Daily time frame.
🛑 Always use proper risk management and set a Stop Loss(SL) for every position.
🚀 If this analysis helps your trading plan, a BOOST would help more traders discover it.  Short
Short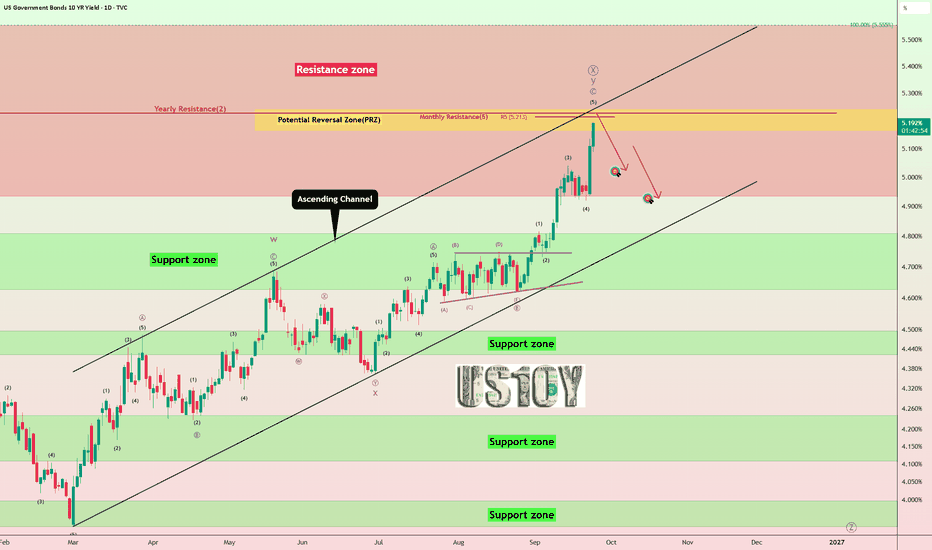
US10Y Is Rising Again: Could 5.1% Trigger Pressure Across GlobalThe U.S. 10-Year Treasury Yield ( TVC:US10Y ) is one of the most important benchmarks for global interest rates and financial conditions.
A strong rise in US10Y can affect U.S. stocks, Gold, Silver, Bitcoin, and the broader crypto market.
Could US10Y continue rising toward 5.1% and create another wave of pressure across financial markets?
Macro Outlook
US10Y represents the yield investors receive from holding a 10-year U.S. Treasury bond and is widely used as a benchmark for long-term interest rates.
Its market impact can be summarized simply:
U.S. Stocks: Higher yields increase borrowing costs and pressure valuations, particularly in growth and technology stocks.
Gold & Silver: Higher yields—especially real yields—and a stronger U.S. Dollar generally create pressure on non-yielding precious metals.
Bitcoin & Crypto: Rising yields can tighten financial conditions, strengthen the Dollar, and reduce risk appetite.
For this reason, US10Y is an important macro indicator to monitor alongside the U.S. Dollar Index(DXY).
Technical Analysis
On the daily time frame, US10Y is approaching an important Resistance Zone after moving inside an Ascending Channel for approximately 190 days.
From an Elliott Wave perspective, the U.S. 10-Year Treasury Yield appears to be completing the main Wave X inside the Ascending Channel.
💡 Educational Note: Rising Treasury yields generally indicate tighter financial conditions, which can reduce demand for risk assets and increase pressure on equities, precious metals, and cryptocurrencies.
Considering recent U.S. economic data, persistent inflationary pressures, and geopolitical risks in the Middle East, I expect US10Y to continue moving higher.
The next major upside target could be around 5.1%.
If this scenario develops, higher Treasury yields could remain an important risk factor for the S&P 500, Nasdaq, Gold, Silver, Bitcoin, and the broader crypto market.
Target: 5.1%
Do you think the U.S. 10-Year Treasury Yield can reach 5.1%?
🟢 Yes
🔴 No
📌 U.S. 10-Year Treasury Yield(US10Y), Daily time frame.
🚀 If this analysis helps your trading plan, a BOOST would help more traders discover it. Long 
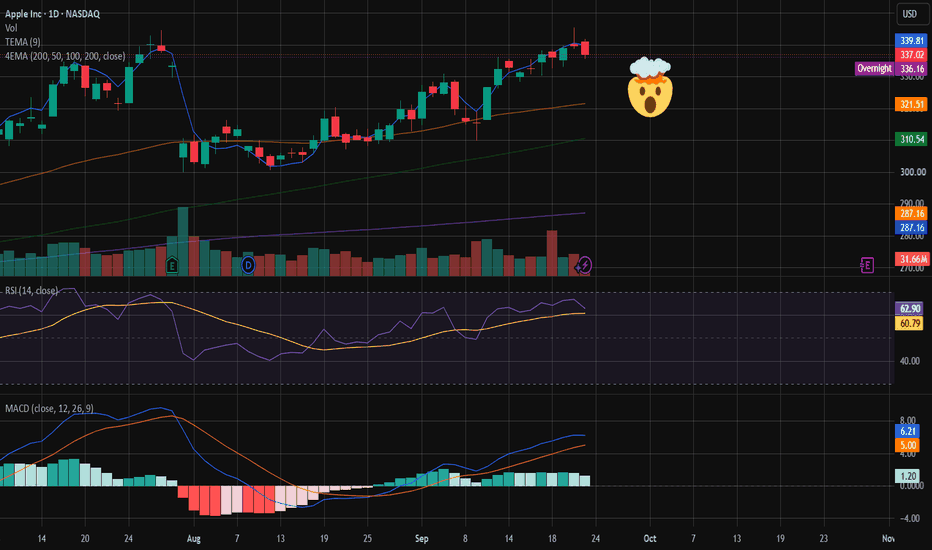
Apple:Profit target hit! Does iPhone Duo take this to $400?This video presents an update of my Apple trade which was published on 11 September 2026, when pre-orders started for the new iPhone Duo and iPhone 18 Pro, and the ascending channel broke above volume up 31% from its three-month average to $326.57. The primary target price of $340 has been reached at $340.22,12-day advance as a result of consistent institutional buildup, considering the iPhone Duo's release on October 23, where BofA set a price target of $370 and TD Cowen $400. Bullish crossover of the MACD indicator confirmed across the whole move, the TEMA 9 indicator continues to grow as dynamic support, the RSI indicator value at 62.90 is still far away from entering the overbought zone. This video I show you an update of the trailing stop, and why October 23 will be the next major catalyst for the $360 and $400 price targets, and the meaning of the first iPhone Duo sell-through numbers in the context of the supercycle theory. Whether you trade or just learn about channels breakouts and product catalysts, this video will be of interest to you.  Long
Long
ETHUSDT - The Hunt for Liquidity Ahead of the Rally BINANCE:ETHUSDT.P has transitioned into consolidation following another distribution phase. The market is forming a local consolidation range of 2,714–2,806, and within the correction, the market maker could test support before another move higher.
Bitcoin is in the spotlight. After a five-week consolidation phase, the flagship cryptocurrency has transitioned into distribution and reached a new intermediate high. The market sentiment remains bullish.
Ethereum is consolidating within the local 2,700–2,800 range. The trend remains bullish, while volumes are relatively high. Within the correction, price could form a long squeeze of the key liquidity and support zone...
Resistance levels: 2,806, 2,900, 3,000
Support levels: 2,714, 2,666, 2,565
A retest of the 2,714–2,666 zone aimed at hunting liquidity could end with a long squeeze and a return to the buying zone. Price consolidation above 2,700 could trigger further upside toward 2,900–3,000 within the broader trend.
Best regards, R. Linda!  Long
Long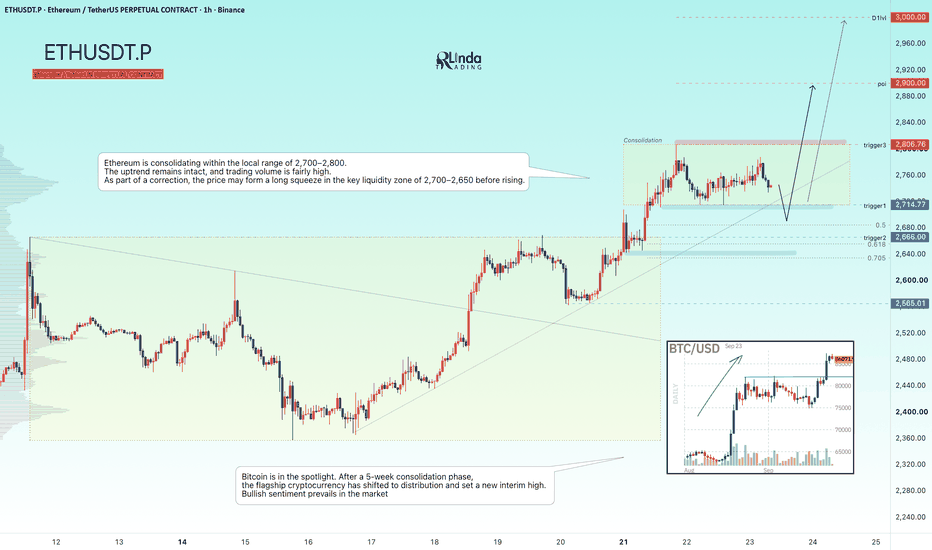
BITCOIN - A strong market. Retest of resistance BINANCE:BTCUSDT.P is maintaining its local bullish trend, while the five-week consolidation following the strong rally — during which the coin broke its medium-term bearish trend — points to underlying market strength
After breaking the trend and staging a strong rally, Bitcoin has been consolidating for five weeks. Negative news failed to trigger a decline, while the long squeeze became a technical catalyst for further upside.
The coin continues to confirm its bullish market structure. The breakout of the wedge resistance, which marks the consolidation boundary, is triggering another retest of key resistance. The main focus is on 82,300–82,800. A close above this zone could accelerate the move toward 86K
Resistance levels: 82,300, 82,850, 86,000
Support levels: 80,500, 80,000
A retest of the 82,800 resistance could trigger a correction, but if the market manages to hold the local pullback within the current range, this would provide another confirmation of the market’s readiness for a rally. A close above 83,000 could become a technical catalyst for further upside toward 86K–100K
Best regards,
R. Linda! Long 
Long 
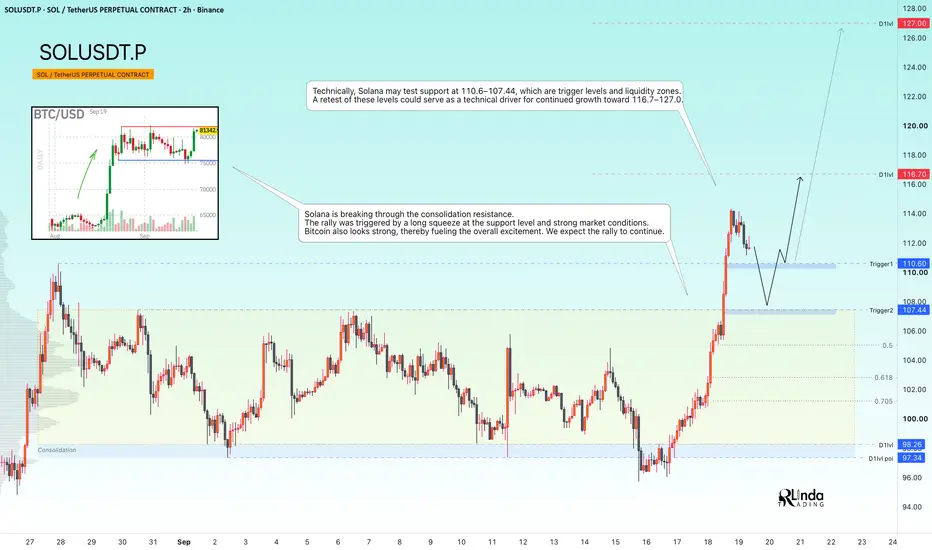
SOLUSDT - A hunt for liquidity ahead of the rally's continuationBINANCE:SOLUSDT confirms its bullish market structure. The long squeeze of support that we expected in the previous analysis played out perfectly. The bulls quickly took control of the situation and strengthened their positions...
Previously, we discussed how the market turned out to be stronger than expected: Bitcoin showed virtually no reaction to higher interest rates, the Fed’s hawkish stance, or the fact that the CLARITY Act was not passed. Consolidation continued, which further confirmed the strength of the market.
As for Solana, the altcoin is breaking through the consolidation resistance, suggesting that the coin is ready to continue its move higher. The rally was triggered by a long squeeze of support and the overall strength of the market
Resistance levels: 116.7, 127.0
Support levels: 110.6, 107. 44
Technically, Solana could retest the 110.6–107.44 support zone, which represents both key triggers and liquidity areas. A retest of these levels could become a technical catalyst for further upside toward 116.7–127.0
Best regards,
R. Linda!  Long
Long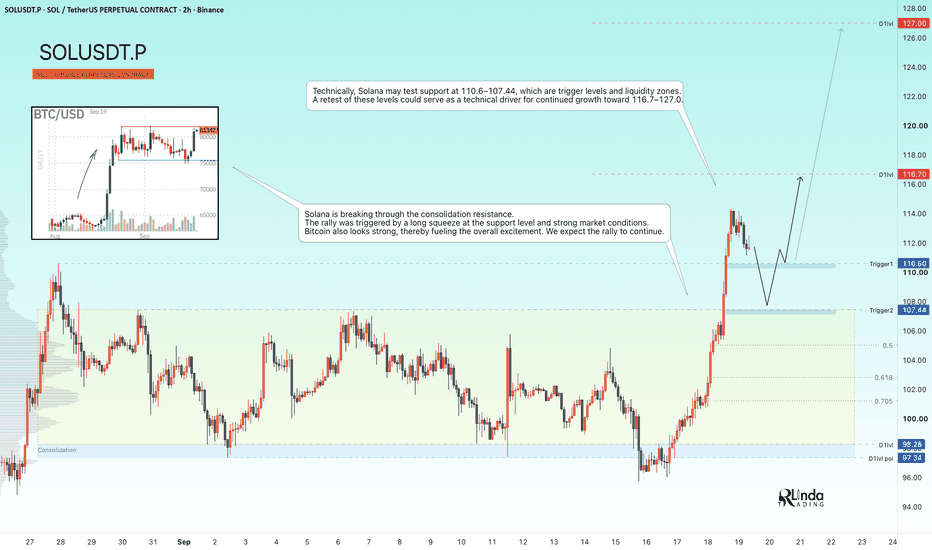
SOLUSDT - The Hunt for Liquidity Before Growth Resumes BINANCE:SOLUSDT.P continues to consolidate, just like the rest of the market. Technically, this is a favorable sign for further upside. However, important news is ahead...
Bitcoin is in consolidation, as is the rest of the market. Key news is ahead: the FOMC meeting and consideration of the cryptocurrency legislation.
Solana is also consolidating, while at the same time maintaining its local bullish trend amid expectations of upcoming news. Technically, a liquidity pool has formed below 97.34, which could be tested before a rally higher.
A long squeeze of the current range support could trigger further upside. However, a breakdown of the market structure on negative news could lead to a broader market decline
Resistance levels: 103.88, 107.4
Support levels: 98.3 - 97.3
A favorable fundamental backdrop, a false breakdown of support, and price consolidation above 98.3 could become a technical catalyst for further upside toward 103.88–107.4–110
Best regards,
R. Linda! Long 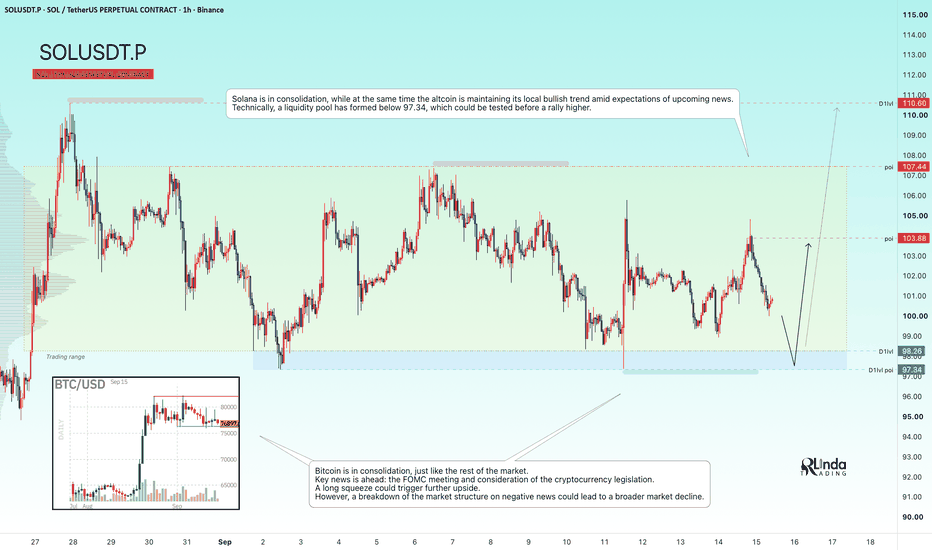
Long 
Bearish Liquidity Sweep Setting Up Bullish Reversal Toward BSL?1. Overall Bias
The chart presents a Smart Money Concepts (SMC) / ICT-style technical analysis, outlining a full market cycle: consolidation → liquidity sweep → bearish expansion → reversal → retracement → renewed bullish setup targeting higher liquidity pools.
2. Element-by-Element Breakdown
A. Price Range (Aug 25–28)
Labeled "PRICE IN RANGE" — price consolidated in a tight horizontal box, indicating accumulation/distribution before a directional move.
A diagonal trendline inside this box shows minor internal structure (lower highs) hinting at seller pressure building before the breakdown.
B. MSS (Market Structure Shift) — Aug 28–29
As price broke below the range's low, it triggered a Market Structure Shift, confirming a change from ranging/bullish structure to a bearish directional bias.
This is the first technical confirmation that sellers had taken control.
C. First Fair Value Gap (FVG) — Post-MSS
Immediately after the MSS, an aggressive bearish candle created an imbalance (FVG) around the 4,480–4,520 zone (grey box).
This zone represents inefficient price delivery — a gap between buying and selling pressure — and is technically considered a potential resistance/rebalancing zone if price later revisits it.
D. Bearish Move (Fundamentally Driven)
The information box explicitly states this decline was triggered by FOMC fundamentals — implying a hawkish Fed outcome strengthened the USD, which inversely pressured Gold lower.
Price dropped sharply from ~4,520 down to ~4,300, marked clearly as "BEARISH MOVE."
E. Sell-Side Liquidity & Liquidity Sweep (Sep 1–2)
Price declined into a zone marked "SELL SIDE LIQUIDITY," where resting sell-stop orders (from range lows) were sitting.
The "LIQUIDITY SWEEP" label confirms price deliberately wicked below this level to grab liquidity (stop-hunt) before reversing — a hallmark SMC behavior where smart money engineers a move to fill large orders before reversing direction.
F. Second Fair Value Gap (FVG) — Recovery Leg
Following the sweep, an impulsive bullish leg formed a second FVG around 4,360–4,400.
This becomes a key support/Point of Interest (POI) zone, since price often retraces to fill such imbalances before continuing its intended direction.
G. Buy-Side Liquidity Sweep (Sep 3–4)
Price rallied aggressively into the "BUY SIDE LIQUIDITY" zone near 4,500–4,520, sweeping resting buy-stop orders above the prior swing highs.
This effectively completed a full liquidity cycle: sell-side sweep → bullish expansion → buy-side sweep.
H. Distribution / Bearish Retracement Channel (Sep 4–16)
After the liquidity grab, price entered a descending channel (marked by the diagonal trendline), retracing lower in a controlled, corrective structure.
This pullback is technically significant — it's retracing back into the FVGs/POIs created earlier, which is standard behavior for price to "rebalance" imbalanced zones before resuming its higher-timeframe direction.
I. Key POIs (Points of Interest) — Right Side of Chart
Three horizontal POI zones are marked as upside targets:
POI Approx. Level Significance
POI 1 ~4,520 Highest target, aligned with prior buy-side liquidity high
POI 2 ~4,480 Mid-range resistance/imbalance zone
POI 3 ~4,400 Nearest target, aligned with the FVG left during the bullish leg
These POIs represent untapped liquidity/imbalance zones above current price, forming the bullish thesis's technical targets.
J. Bullish Reversal (Sep 16–17, Current Price Action)
Price recently swept a fresh low (~4,240) and sharply reversed upward, labeled "BULLISH REVERSAL."
This is interpreted as another localized liquidity sweep, now acting as the launchpad for the anticipated move back toward the POIs.
Current price (4,308.50) is trading right at the edge of this reversal structure, suggesting the setup is actively developing, not yet confirmed.
K. Inset Chart (Bottom Left) — DXY (U.S. Dollar Index) Correlation
A smaller secondary chart, styled with candlesticks around the 99.90–100.30 range, appears to track the U.S. Dollar Index (DXY).
The upward-sloping arrow suggests an expected continuation or reversal in DXY that would inversely correlate with Gold's move — i.e., if DXY weakens from here, Gold gets fundamental tailwinds to reach the marked POIs.
This ties directly into the chart's core thesis (bottom text box): "The U.S. Dollar moved higher fundamentally due to FOMC data. Now, a downside move may occur. If USD weakens, Gold could move upward and target the key POIs."
3. Trade Thesis Summary
Catalyst: FOMC-driven USD strength caused Gold's initial bearish leg.
Liquidity Engineering: Price swept both sell-side and buy-side liquidity in sequence — a classic smart-money footprint.
Current Phase: Retracement/distribution phase is complete or nearing completion, with a fresh bullish reversal signal at the recent low.
Forward Expectation: Contingent on USD weakness, Gold is technically positioned to reclaim liquidity toward POI 3 → POI 2 → POI 1 (4,400 → 4,480 → 4,520+).
Invalidation Risk: If the USD continues strengthening or the bullish reversal fails to hold above recent lows (~4,240), the bearish channel could resume, delaying or invalidating the bullish POI targets.  Long
Long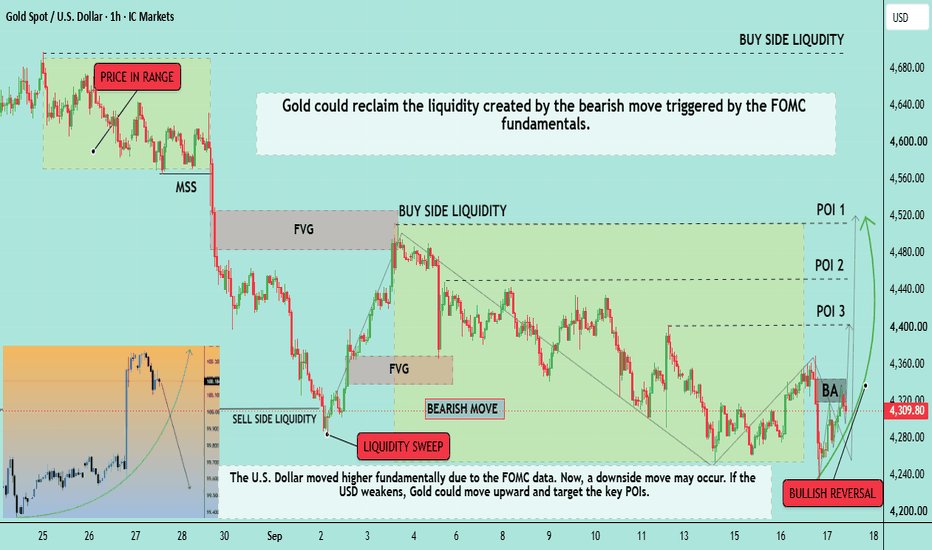
BITCOIN - A correction within a consolidation phaseBINANCE:BTCUSDT.P reached a new cycle high at 82,300, but still failed to reach the key target. The market remains in consolidation, within which a countertrend correction is developing
The fundamental backdrop remains unstable, but relatively favorable for the market. Against this backdrop, Bitcoin continues to consolidate within the current range. On September 15, the Senate is scheduled to hold another vote on the CLARITY Act.
The market has been range-bound between 76,400 and 81,300 for the third consecutive week. Technically, a local wedge is forming within the range, and Bitcoin could test the support cluster before attempting another move higher. The bullish structure remains intact, and during the correction, price could test the 77,000–76,400 liquidity pool
Resistance levels: 79,470, 80,500, 81,270
Support levels: 77,000, 76,390
The correction appears to be aimed at a potential liquidity hunt. The key focus remains on the support zones mentioned above. A long squeeze could become a technical catalyst for the continuation of the uptrend
Best regards,
R. Linda! Long 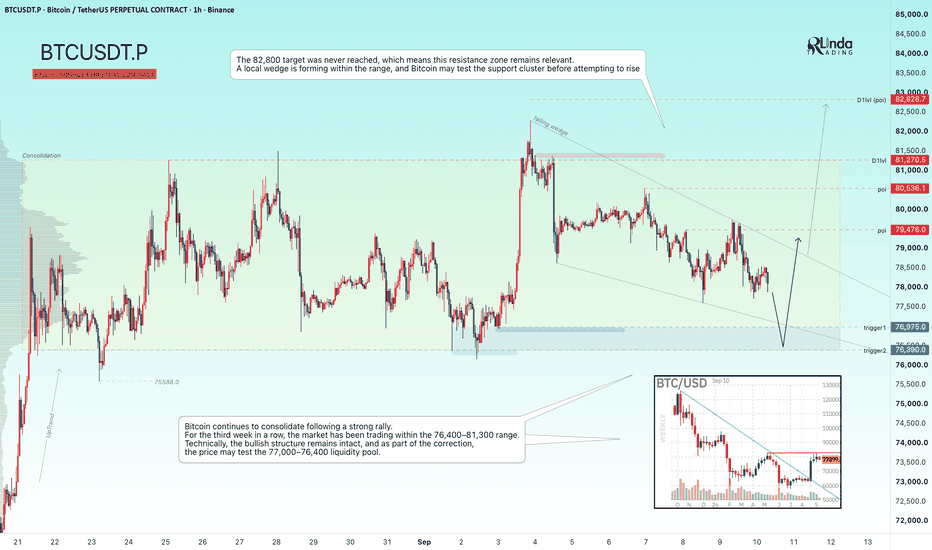
Silver: Four Moves in Two DaysSilver's 2-hour chart has gone through four distinct phases in quick succession — worth walking through in order.
First, a climb: price built a rising channel over roughly 40 bars, moving from the 65.4–67.2 zone up toward 68.3, with both the highs and the lows stepping up in a fairly orderly two-line structure.
Second, a break: the channel base gave way, and price dropped from 66.42 to 63.07 — erasing essentially the entire channel's gain in a fraction of the time it took to build.
Third, a spike: one bar punched down to 62.855, well below the surrounding price action, before closing back up at 65.246 — a long lower wick that usually marks either a stop-run or a moment where sellers briefly overreached.
Fourth, a settle: since that spike, price has drifted back down to 64.481, giving back part of the spike's recovery but holding well above the 62.855 extreme.
Taken together, this reads less like a clean trend reversal and more like a fast unwind followed by a search for where the next base actually is. The 63–63.5 area, tested repeatedly during the decline, is the level worth watching for whether it holds or gives way again.
Educational chart notes only, not a call to buy or sell. Commodities can gap and spike on macro headlines with no warning on the chart itself. JPN225: Triangle broken, Trade in profit what comes next?In this video is the update to the Nikkei 225 trade idea from 3 September 2026, when Japan’s 10-year bond yield surpassed 3% for the first time since 1996 and the index dropped by 2.85% to its lowest levels in four weeks at 64,325. Entry: 63,000-64,274. Descending triangle was the formation and the contracting MACD histogram which was deep into the negative zone was the trigger;the exact setup that called for the best week for the Hang Seng since March 2025. On 4 September Softbank and AI semiconductor stocks jumped 806 points. On 7 September, thanks to Kioxia and SoftBank the index increased by 2.12% to 66,399. Descending triangle has been violated to the upside and the trade is now making money. However, the chart has formed a new symmetrical triangle inside the rebound phase, and in this video I will show you exactly where this triangle is, where the breakout level is, where the trailing stop now stands, and why 66,250 is the next target level. Whether you trade indices or want to learn how patterns develop during the recovery, this video is for you.  Long
Long

ETHUSDT - The Hunt for Liquidity Ahead of a Bullish Rally BINANCE:ETHUSDT.P continues to consolidate within the 2,350–2,550 range. Resistance has been confirmed and is acting as an important trigger. A breakout above 2,550 could trigger a rally higher, but...
Bitcoin has been consolidating near resistance for the third consecutive week, suggesting that the bulls may still be interested in pushing prices higher. Ethereum is also consolidating. A scenario involving a long squeeze of support before the next move higher remains possible. Such a move could support the broader altcoin market.
Technically, when it comes to Ethereum, the key focus is on the local 2,444–2,430 liquidity zone. A retest and long squeeze of this support zone could shift the balance of power toward buyers and trigger an impulse toward 2,620–3,000
Resistance levels: 2,550, 2,620
Support levels: 2,443, 2,431, 2,356
A false breakdown of support followed by consolidation above the level could become a technical catalyst for further upside, both within the local 2,430–2,550 range and within the broader bullish trend that has been developing since the beginning of July
Best regards,
R. Linda! Long 
GOLD - The price remained within the range following the NFPICMARKETS:XAUUSD is reacting to Friday’s NFP data with a fairly strong sell-off. However, the market is aggressively buying the dip. What should we expect from the market on Monday?
The dollar remains weak, but toward the end of Friday’s trading session, the market gave back part of the bullish impulse, providing some support for the dollar.
The main focus remains on geopolitical developments and upcoming economic data, including PPI and CPI.
Technically, I expect a correction toward 4,396–4,381 to potentially develop from the session open, followed by a possible move higher toward the 4,490–4,510 area of interest.
However, the fundamental backdrop remains mixed, with no clear directional bias. A close below 4,365 could trigger a sell-off toward 4,280
Resistance levels: 4,435, 4,461, 4,490
Support levels: 4,396, 4,381, 4,365
Within the local correction, gold is testing the 4,440 liquidity zone, where a bounce toward the 4,396–4,381 support zone could develop. If the bulls manage to maintain the bullish impulse, this could lead to a move toward 4,440–4,490 within the local range
Best regards,
R. Linda! Long 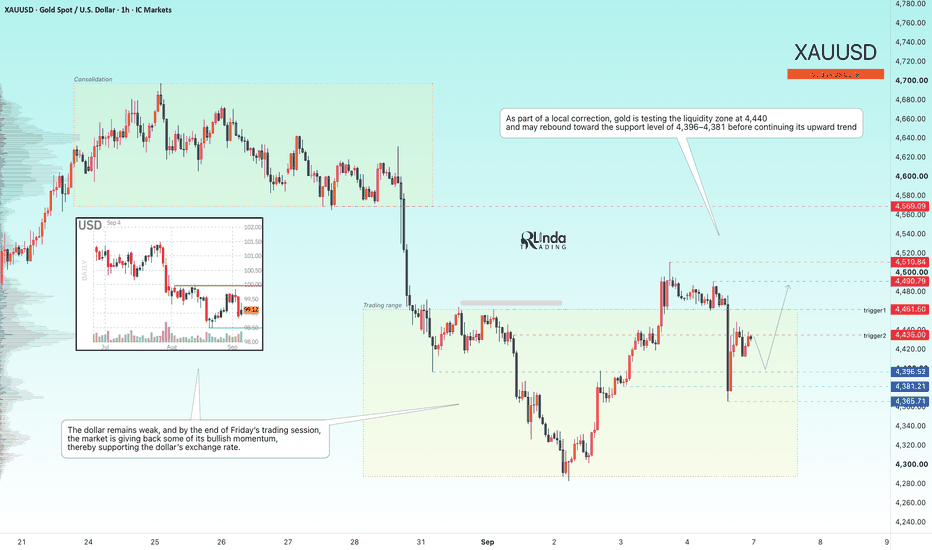
BITCOIN - Consolidation following the NFP. There's a chance...BINANCE:BTCUSDT.P is consolidating within the 76,000–81,000 range. The key target at 83K has still not been reached, which is why it remains relevant. Yesterday’s NFP data triggered another round of liquidity collection, and the market continues to consolidate
Bitcoin continues to consolidate. Yesterday’s attempt to break through resistance failed amid the mixed NFP report. However, the market is holding the downside, with price consolidating above 79,500.
Technically, the medium-term outlook remains favorable. The flagship asset previously broke out of the global bearish trend. ETF inflows continue to increase, as does bullish sentiment. Within the current consolidation, I would highlight two key levels: 79,850 and 77,000
Resistance levels: 79850, 81300, 82850
Support levels: 79550, 77000
At the moment, price is consolidating above the intermediate 79,550 support zone, while a close above 79,850 could trigger a continuation of the local uptrend.
However, given yesterday’s news, the broader consolidation could continue, and the market maker may form a retest of the lower area of interest. The key focus is 77,000 — the second trigger. A long squeeze could also trigger an impulse toward 83K
Best regards,
R. Linda! Long 
ETHUSDT - Consolidation ahead of a potential breakout and rallyBINANCE:ETHUSDT.P continues to consolidate after the strong rally, but at the moment, the market is once again testing resistance within yesterday’s rally...
Bitcoin is consolidating near the 83K resistance, which represents a technical retracement zone from the previous bearish cycle. A close above 83K could trigger a bullish impulse, providing additional support for the altcoin market.
From a broader perspective, Ethereum has not declined after the strong rally. A three-week consolidation is forming. At the same time, the retest of the 2,356 support ended with a bounce and a local rally, after which the market moved back into consolidation near resistance. This increases the probability of an upside breakout.
Today, all attention is focused on NFP. Weak data could strengthen the bullish trend, while hawkish signals could trigger a correction, in which case the market may continue consolidating.
Resistance levels: 2,550, 2,620, 2,790
Support levels: 2,450, 2,356
There are several possible scenarios. As part of a local pre-breakout consolidation, Ethereum could test 4,500 before moving higher. However, gradual compression toward resistance could trigger an upside breakout. A close above the level could become the technical catalyst for a move toward 2,620–2,790
Best regards,
R. Linda! Long 
BITCOIN - Consolidation Following Strong GrowthBINANCE:BTCUSDT.P , after a strong rally, has entered a consolidation phase near the resistance formed by the technical retracement of the previous bear cycle. What happens next?
Bitcoin previously broke the structure of its bearish trend, but it has still not tested the 83,000 technical retracement zone, which also represents a liquidity pool. Therefore, we can assume that this target remains relevant within the current local bullish trend.
After the strong rally, price has been consolidating for two weeks without forming a significant pullback. This can also be viewed as a bullish indication and a potential setup for further upside.
Technically, the market remains in consolidation. Price is showing a relatively weak reaction to the conflict escalation and has not declined despite the strong rally. A long squeeze of the 76,800–76,300 zone could develop before the move higher toward the 83K target.
The market remains bullish
Resistance levels: 79,500, 81,200, 83,000
Support levels: 76,800, 76,400, 75,600
A false breakdown of support as part of a liquidity-hunting phase, followed by consolidation above the 76,400–76,853 zone, could become a technical catalyst for further upside
Best regards,
R. Linda. Long