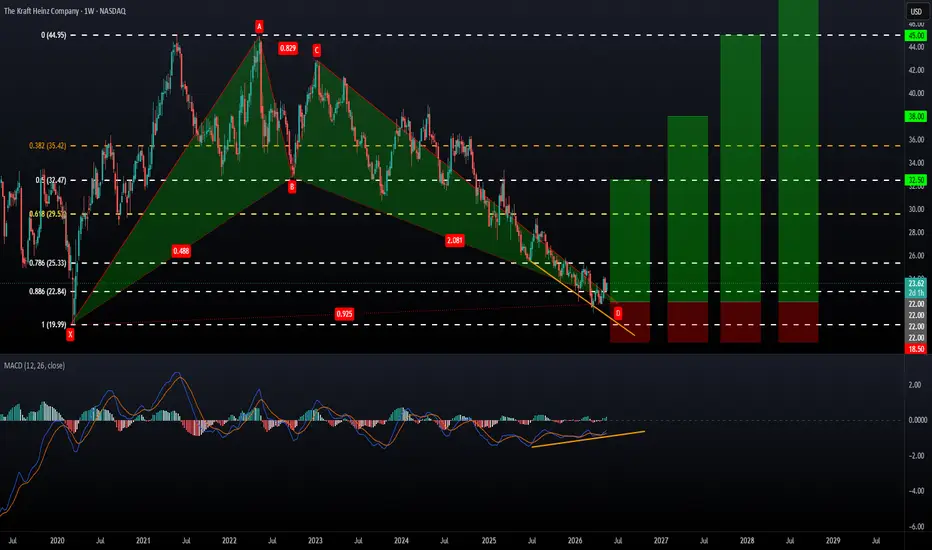
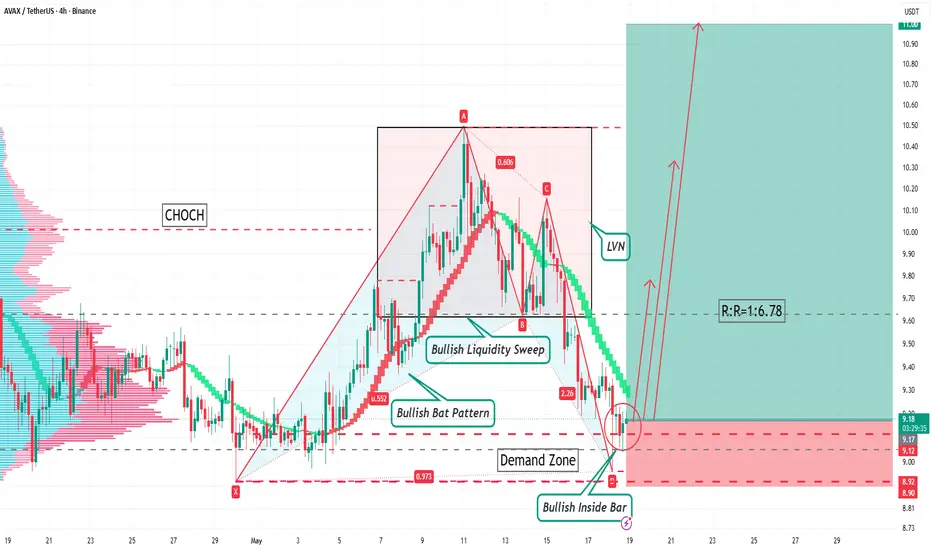
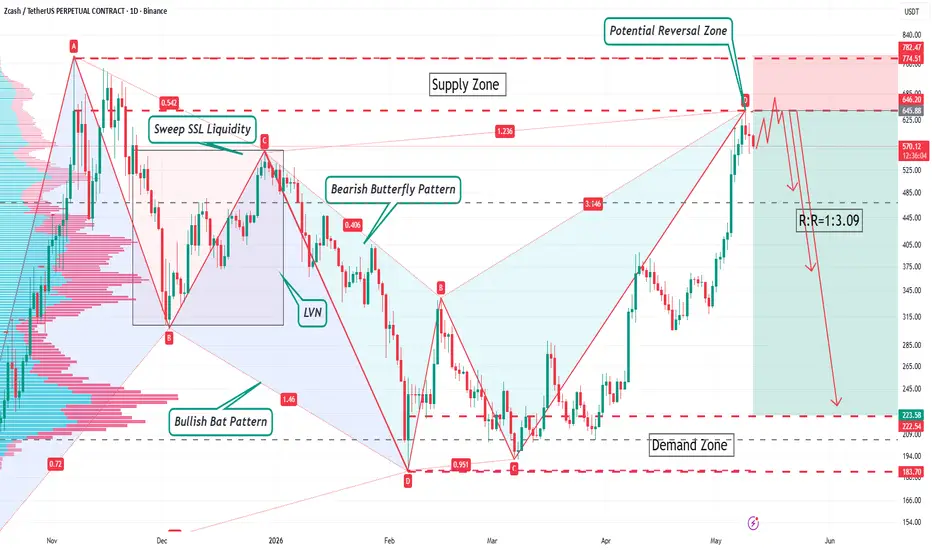
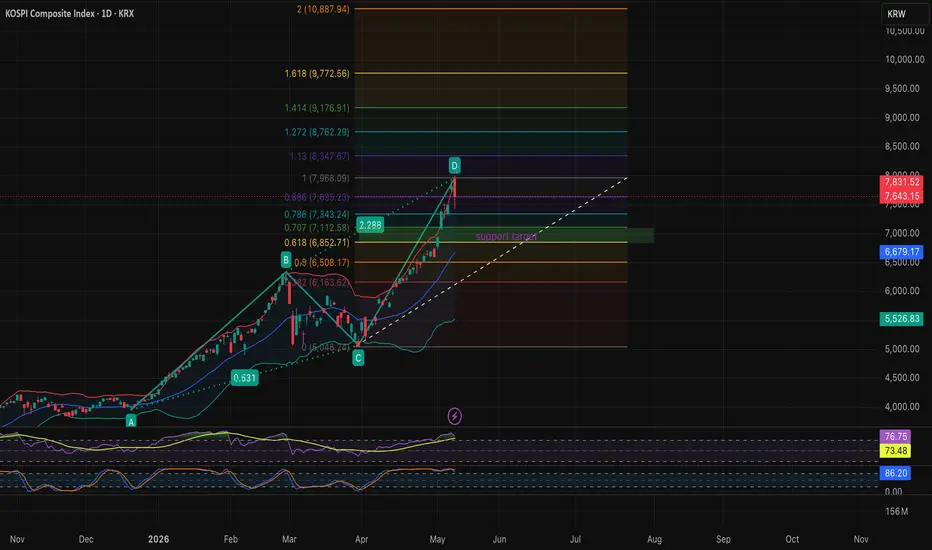
Bullish Harmonic Bat Pattern on KraftThis chart shows a popular strategy called harmonic trading. It uses specific shapes and math percentages (Fibonacci numbers) to predict when a falling stock is about to turn around and head back up.
Here is a simple breakdown of what is happening:
1. The "Bat" Shape is Complete
The red lines form a geometric pattern shaped like a bat (labeled X-A-B-C-D).
The stock started at a low point (X), shot up to (A), bounced around, and then slid all the way down to (D).
Point D is the magic zone whe
KLong