Options Blueprint [Int]: Call Spreads Around Relative WeaknessMarket Context: Understanding Relative Weakness
Markets rarely move in isolation. One of the most informative signals available to traders is not just price direction, but how one market behaves relative to another. This concept, known as relative weakness, becomes especially relevant when one index pushes into new highs while another fails to confirm.
In the current environment, we observe a divergence: while one major equity benchmark continues to explore higher ground, another is struggling to reclaim prior highs. This lack of confirmation is not just noise—it reflects underlying differences in participation, sector rotation, and institutional positioning.
From a behavioral standpoint, when a market fails to print new highs while its peers do, it often implies:
Sellers are active at higher levels
Buyers are less aggressive compared to other indices
There is an existing overhead supply that has yet to be absorbed
This creates a subtle but important shift: instead of chasing upside continuation, the focus transitions toward areas where price may encounter resistance.
Technical Framework: Resistance and Double Top Dynamics
The chart structure reveals a potential double top formation, a pattern that signals repeated rejection at similar price levels. However, it is critical to move beyond textbook definitions and focus on why this matters.
A double top is not simply two peaks—it represents:
A failure to auction higher
A reinforcement of seller dominance near resistance
A buildup of supply above current price
In this case, resistance should not be treated as a single price, but rather as a zone. This zone sits above the recent high and extends into the area approaching the all-time high. Within this region, prior activity suggests the presence of UnFilled Orders (UFOs)—areas where selling pressure previously exceeded buying interest.
This is where many participants make a critical mistake: assuming that once price revisits resistance, it will break. In reality, markets often require multiple attempts to absorb supply, and until that happens, resistance remains structurally relevant.
The key takeaway here is simple:
Price is trading below a well-defined resistance zone
The structure reflects relative weakness
The probability distribution favors non-breakout scenarios unless proven otherwise
Strategy Selection: Why a Bear Call Spread?
Given this backdrop, directional trading becomes less attractive than structured positioning. Instead of relying on a strong downward move, the objective shifts toward capturing value from price not exceeding resistance.
This is where the bear call spread becomes relevant.
A bear call spread is a defined-risk options strategy that benefits when price:
Moves lower
Moves sideways
Moves slightly higher but remains below a defined level
It consists of:
Selling a call option (closer to price)
Buying a further out-of-the-money call option (protection)
This structure introduces several advantages:
Defined risk: Maximum loss is known from the start
Time decay (theta): Works in favor of the position
Flexibility: Does not require precise directional timing
Most importantly, it aligns with the current market condition:
We are not attempting to call a top—we are positioning around the idea that resistance may hold.
Trade Construction (Case Study)
Let’s break down the structure illustrated in the chart.
Expiration: Mid-May
Short Call Strike: Near the resistance zone
Long Call Strike: Above the resistance zone
This creates a vertical spread positioned above current price, allowing the trader to collect premium while defining risk.
Key Components:
Credit Received: 137 points
Maximum Risk: 363 points
Breakeven Level: 50,237
The breakeven sits above the current resistance zone, which is a crucial element of the setup.
This means price would need to:
Break resistance
Sustain above it
Continue higher
…all before expiration, in order for the position to move into a loss.
This positioning introduces a favorable structure:
If price stalls → premium decays
If price pulls back → position benefits
If price rises modestly → still within acceptable range
The strategy is not dependent on being “right” about direction—it is dependent on price behavior relative to resistance.
Risk Profile Explained
The payoff profile of a bear call spread is asymmetric but controlled.
Maximum Gain: The premium collected
Maximum Loss: The defined spread width minus the credit
Breakeven: Strike of short call + credit received
From a scenario perspective:
Scenario 1 — Price Moves Lower: The spread rapidly approaches maximum gain as both options lose value.
Scenario 2 — Price Moves Sideways: Time decay gradually erodes option premiums, favoring the position.
Scenario 3 — Price Moves Slightly Higher: As long as price remains below breakeven, the structure remains intact.
Scenario 4 — Price Breaks Resistance Strongly: The position moves toward maximum loss, which is predefined and capped.
This is where structure matters more than prediction. The goal is not to anticipate exact price movement, but to define acceptable outcomes ahead of time.
Forward-Looking Trade Idea (Illustrative Case Study)
This case study illustrates how such a structure could be approached.
Entry Consideration: As price approaches or reacts within the resistance zone
Target Outcome: Expiration below breakeven level, allowing full premium capture
Stop-Loss Consideration: A sustained move above resistance, indicating invalidation of the thesis
Reward-to-Risk Ratio: Approximately 0.37:1 based on the structure
While the reward may appear smaller than the risk, it is important to consider the probability distribution. The strategy is designed to benefit from a wide range of outcomes, not just a single directional move.
This highlights a key principle in options trading:
Structuring trades around probabilities could potentially be more effective than relying on precise forecasts. Ultimately this depends on the trader’s style.
Contract Specifications
Understanding contract specifications is essential for proper risk management.
E-mini Dow Jones Industrial Average Index Options:
Tick size: 1.00 index point = $5.00
Margin: Currently ~$15,000 per contract
Risk Management: The Real Edge
No strategy, regardless of structure, replaces the need for disciplined risk management.
Key considerations include:
Position sizing: Never allocate excessive capital to a single idea
Defined exits: Know when the trade thesis is invalidated
Time awareness: Options lose value over time, but adverse moves can accelerate losses
Diversification: Avoid concentration in highly correlated positions
Managing a spread is not just about holding to expiration. In many cases, traders may:
Close early to lock in partial gains
Reduce exposure if conditions change
Adjust positions if necessary
Consistency in execution often matters more than individual outcomes.
Key Takeaways
Relative weakness provides insight into underlying market structure
Resistance zones are more meaningful than single price levels
Bear call spreads allow for structured, defined-risk positioning
Profitability is not dependent on sharp downward movement
Risk management remains the cornerstone of any strategy
Chart Reference
The chart provided illustrates:
A potential double top formation
A clearly defined resistance zone
Alignment with UFO-based supply areas
A projected downside target
These elements collectively support the structured approach discussed.
Data Consideration
When charting futures, the data provided could be delayed. Traders working with the ticker symbols discussed in this idea may prefer to use CME Group real-time data plan on TradingView: www.tradingview.com - This consideration is particularly important for shorter-term traders, whereas it may be less critical for those focused on longer-term trading strategies.
General Disclaimer
The trade ideas presented herein are solely for illustrative purposes forming a part of a case study intended to demonstrate key principles in risk management within the context of the specific market scenarios discussed. These ideas are not to be interpreted as investment recommendations or financial advice. They do not endorse or promote any specific trading strategies, financial products, or services. The information provided is based on data believed to be reliable; however, its accuracy or completeness cannot be guaranteed. Trading in financial markets involves risks, including the potential loss of principal. Each individual should conduct their own research and consult with professional financial advisors before making any investment decisions. The author or publisher of this content bears no responsibility for any actions taken based on the information provided or for any resultant financial or other losses.  Education
 Short
Short
 Short
Short
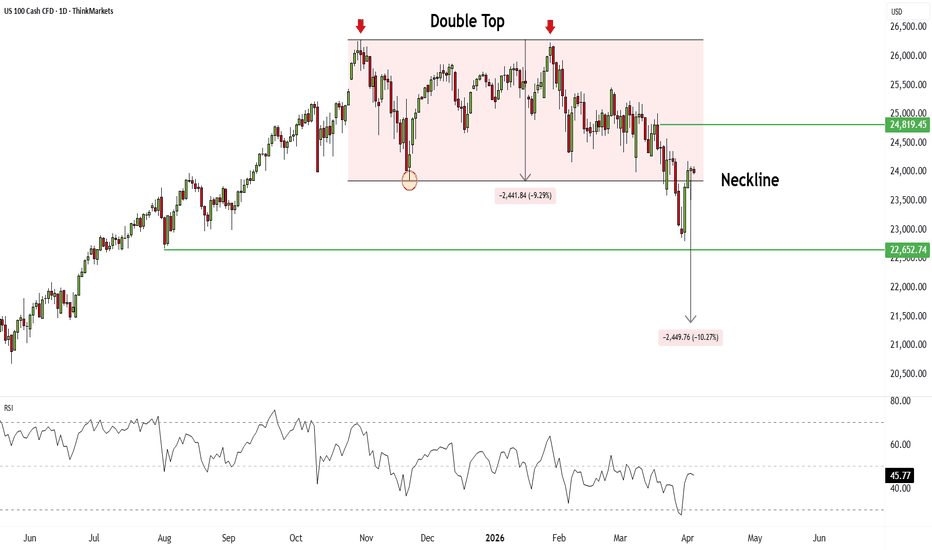
Nasdaq 100 (US100): 10% correction or bear trap?The tech-heavy Nasdaq has experienced extreme volatility this week. After a brutal multi-day selloff that plunged the index down to 23,500, officially dropping more than 10% from its recent highs into correction territory, buyers stepped in aggressively. Thursday saw a massive swing, pushing the index back up to close above the 24,000 handle.
Was this 10% plunge a false signal and a massive bear trap, or just a dead cat bounce before we head lower? We break down the crucial "Three-Day Rule" for confirming breakdowns and map out the key levels to watch as we head into a major holiday weekend.
Key topics covered
- Geopolitical relief rally: What sparked Thursday's massive reversal? We discuss the slight easing of geopolitical tensions, including rising hopes that commercial traffic may soon be allowed through the Strait of Hormuz after Iran announced it is drafting a maritime transit protocol with Oman.
- "Three-Day rule" & false breakdown: We look closely at the official 10% correction threshold near 23,650. While the Nasdaq traded below this level, it only managed two daily closes below it, failing to meet the three consecutive closes typically required to technically confirm a structural breakdown. This suggests the recent dip might be a false break.
- Holiday Liquidity Warning: With London and European markets closed for the Easter holidays (Good Friday and Easter Monday), institutional volume and liquidity will be exceptionally low. We explain why traders need to stay defensive through Friday's NFP data release and wait for the true market reaction when full volume returns on Tuesday.
- Double Top neckline : We analyse the daily chart's massive double top pattern. The battleground is the support zone between the 23,800 neckline and the 23,650 correction limit.
Nasdaq 100 scenarios & trade plan:
- Bullish (Bear Trap recovery): If this bounce gains traction when institutions return on Tuesday, it completely invalidates the double top and the "official" correction. The immediate upside target is the short-term peak at 24,200. A break above that clears the path to the massive liquidity pool resting at the recent highs near 24,810.
- Bearish (cconfirmed breakdown): If Tuesday brings renewed selling pressure and we officially break and hold below the 23,650 level (confirming the breakdown), the floor opens up. The first major structural support sits at 22,800, followed by 22,650. However, if the double top measured move plays out fully, the downside target points to a much deeper drop toward 21,390.
Are you buying the dip or preparing for the measured move down to 21,390? Share your thoughts in the comments.
This content is not directed to residents of the EU or UK. Any opinions, news, research, analyses, prices or other information contained on this website is provided as general market commentary and does not constitute investment advice.
ThinkMarkets will not accept liability for any loss or damage including, without limitation, to any loss of profit which may arise directly or indirectly from use of or reliance on such information.
 Short
Short
Mastering double tops and bottoms: avoid the falling knife trap!Every beginner wants to catch reversals, but most end up catching falling knives and top-ticking altcoins right before they rug your soul.
So let's talk about one of the cleanest, most classic reversal tools we have: the double top and double bottom - and what actually confirms them on crypto.
Because two bumps on the chart is not a pattern yet. It's just chaos with confidence.
What is a double bottom / double top in normal human language?
Double bottom
Picture a W at the end of a downtrend:
- Price dumps
- Makes a low
- Bounces
- Comes back to roughly the same zone
- Fails to break lower and then pushes up again
That middle high between the two lows - that's your "neckline".
Double top
Same thing upside down - looks like an M at the end of an uptrend:
- Price pumps
- Makes a high
- Pulls back
- Retests that same high zone
- Fails to break higher and rolls over
Middle low between the two highs - neckline again.
But here’s the trap everyone falls into in crypto: they see the M or W shape forming and instantly start shorting or longing. No confirmation, just pure hope, caffeine and copium.
Crypto loves to fake patterns
This market is wild. Wicks are long, volume is patchy, and whales play ping-pong with your stop loss.
So what actually confirms a double top or bottom for me?
1. Neckline break with a close
For me, the pattern is not confirmed until the candle closes through the neckline on the same timeframe where I spotted it.
- Double bottom - I want a strong close above the neckline
- Double top - I want a strong close below the neckline
Wicks through the neckline mean nothing on crypto. I want body, not just wick noise.
2. Volume backing the move
You don’t need to become a volume guru. Just ask:
- Is there more activity on the breakout than during the second top/bottom?
If yes - good sign it's real, not just a sad little stop hunt.
3. A clear prior trend
No trend - no reversal pattern.
If price was just crab-walking sideways and draws an M or W, that's not a reversal - that's just the market doodling.
Double bottom - I want a visible downtrend before it.
Double top - a visible uptrend.
4. Bonus: the retest
My favorite entries often come on the retest:
- After a double bottom - price breaks above neckline, then comes back and tests it from above, holding as support
- After a double top - breaks below neckline, retests it from below, holds as resistance
That retest, with a rejection candle, often gives a cleaner entry with tighter risk.
Where I place stops and targets
Simple version:
- For a double bottom long - stop usually goes under the second low
- For a double top short - stop usually goes above the second high
Take-profit: a classic approach is to target at least the "height" of the pattern (distance from neckline to the lows/highs) projected from the breakout.
And timeframes?
On crypto, the lower you go, the more fake stuff you see.
I trust:
- 1H, 4H, daily patterns a lot more than
- 1-minute madness on your favorite meme coin
Maybe I'm wrong, but 90% of the "double tops" people post on 5-minute charts are just noise with extra steps.
Key idea
Double tops and bottoms are not about guessing the turn.
They’re about letting the market show:
- "I tried twice - I can't go further - I'm done"
Then you step in, with structure, not emotion.
If you start training your eye to only trade the ones with:
- clear prior trend
- neckline break and close
- some volume kick
- maybe a retest
you'll filter out a ton of garbage and stop donating as much to the liquidation engine.
The market will still humble you, but at least you’ll know why - and that's already progress.  Education
The Nasdaq-100 is dancing on a smouldering volcano.🌋🌋🌋
The tech-heavy index showing massive tension between record liquidity and a deepening rotation out of software.
As of mid-February 2026, we’ve seen the index tumble 2% in a single session, driven by fears that billions in #AI capital expenditures are hitting profit margins, and disrupting business models.
Scenario A: The "AI-llusion" Cracks.
Double Top (Bearish 🐻)
The Trigger: A clean break below the 22,300 - 22,500 zone.
Technical Outcome: A confirmed close below the 100-day moving average (~25,000) would shift the medium-term bias to neutral-bearish, potentially opening a path to the 20,000 level (a 20% "healthy" retracement).
Scenario B: The #HVF (Bullish 🐂)
The Trigger: A sustained breakout above the 26,200 - 26,400 resistance zone.
The Narrative: The Fed signals a pivot to rate cuts earlier than the currently expected June meeting, compressing discount rates for high-duration tech names.
Technical Outcome: If the current "horizontal stability" holds support at 24,100, the symmetrical triangle pattern suggests a target of 28,000+ by April 2026.
Crowd Alert: "The triangle is tightening. If we clear the ATH (26,250), we aren't just rallying—we're entering the final 'melt-up' wave toward 30k."
The "Nervousness" Reality Check
The "Fear Gauge" (VIX) has recently spiked nearly 18%, showing that traders are finally pricing in the "last mile" of AI uncertainty.
While most of the index gains in 2025 were narrow, the 2026 market is increasingly bifurcated: "Old Economy" sectors like energy and consumer staples are shining, while the previously invincible tech sector is undergoing a "shakeout". Long 
Options Blueprint Series [Advanced]: Self-Financing SpreadsMarket Structure: Pressure Building on ES
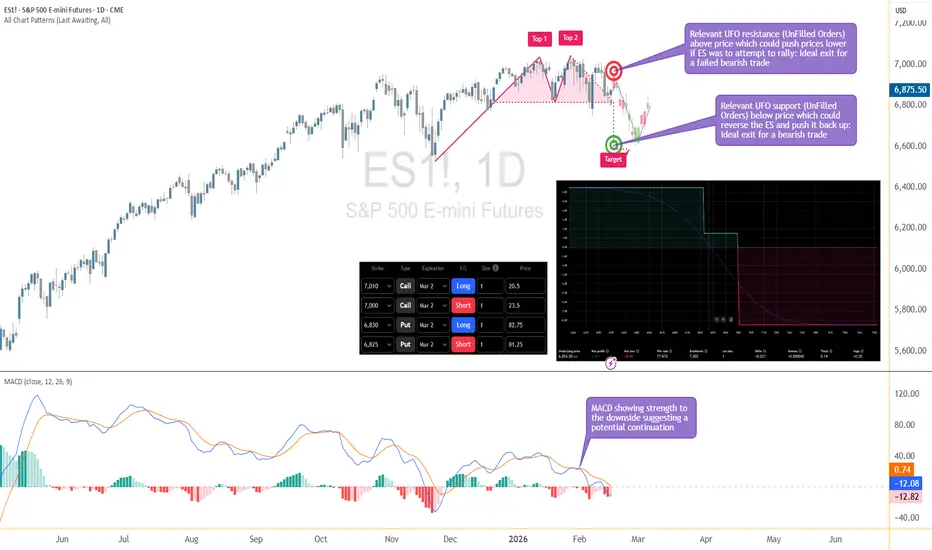
The S&P 500 E-mini Futures (ES) are currently developing a technically sensitive structure on the daily timeframe. What began as a potential double-top formation now carries the structural possibility of evolving into a triple-top configuration.
At the same time:
MACD is showing strengthening downside momentum.
A sell UFO (UnFilled Orders) zone sits above price.
A buy UFO zone aligns closely with the classical projected target of the double-top.
The most recent session printed an indecision candle.
This is where structure becomes interesting.
A traditional double-top target is measured from the neckline projected downward. That projected objective aligns closely with the green buy UFO around 6677.50. That confluence matters. When classical chart structure and liquidity positioning converge, it increases the probability that price may gravitate toward that zone.
Above price, we have a sell UFO near 6921.00 and higher unfilled order activity between approximately 7011.50 and 6921.00. If price attempts to rally, that area may act as supply.
So structurally:
Below: Vacuum toward 6677.50.
Above: Overhead supply.
Momentum: Leaning bearish.
Short-term candle: Indecision.
This combination does not guarantee movement. Markets remain uncertain by nature. But it creates a clearly defined risk map — and that is precisely what options structures are designed to exploit.
Why a Self-Financing Spread Structure?
When directional conviction exists but invalidation is clear, experienced options traders often avoid naked exposure. Instead, they use defined-risk structures that:
Cap upside risk.
Define maximum downside exposure.
Improve breakeven positioning.
Reduce capital outlay.
Allow time decay to assist the thesis.
In this case, the structure combines:
A bear call spread (credit component).
A bear put spread (directional component).
Together, this creates what can be viewed as an Iron Condor variation with downside bias — but here we frame it as a Self-Financing Spread Structure.
The call credit spread generates premium. That premium partially finances the cost of the put spread. The result:
Lower net capital exposure.
Slightly higher breakeven.
Defined maximum risk.
Maximum reward achieved even before price reaches the projected technical target.
This structure is commonly used by options traders when:
A move is anticipated.
Risk needs strict containment.
And capital efficiency matters.
Structure Breakdown – March 2 ES Options
Expiration: March 2
Underlying: ES Futures
Contract Multiplier: $50 per index point
1. Bear Call Spread (Credit Component)
Short 7,000 Call
Long 7,010 Call
Width: 10 points
This caps upside exposure above the sell UFO zone. If price rallies through resistance, risk is limited to the 10-point spread width.
Dollar exposure:
10 points × $50 = $500 maximum call-side risk (before premium adjustments).
Purpose:
Finance the structure.
Define risk above resistance.
Benefit from time decay if price remains below 7,000.
2. Bear Put Spread (Directional Component)
Long 6,830 Put
Short 6,825 Put
Width: 5 points
This spread benefits from a decline below 6,825.
Dollar exposure:
5 points × $50 = $250 maximum intrinsic spread value.
Combined with the call spread credit, this creates a structure where maximum reward is achieved below 6,825 — even before reaching the 6677.50 buy UFO.
That alignment is critical.
The trade does not require perfection. It does not require the full double-top projection. It only requires continued downside pressure.
Combined Payoff Characteristics
From the risk profile graph:
Maximum profit: Below 6,825.
Maximum risk: Above 7,010.
The structure benefits from:
Downside movement.
Time decay.
Price stalling below resistance.
Volatility normalization.
It is harmed by:
Aggressive upside breakout above the indecision candle and resistance.
Strong volatility expansion against the structure.
The beauty of defined spreads is clarity. There are no hidden exposures.
The Indecision Candle: Tactical Invalidation
The most recent daily candle reflects hesitation.
If price:
Breaks above that candle’s high and sustains acceptance,
Pushes through the sell UFO,
And begins building value above resistance,
then the thesis weakens.
In options trading, defined risk does not eliminate the need for active monitoring. A structural invalidation can justify exiting early rather than holding to maximum risk.
Forward-Looking Trade Plan (Illustrative Case Study)
This section is purely illustrative and demonstrates risk mechanics.
Entry Logic:
Structure remains intact below the sell UFO.
No strong acceptance above the indecision candle high.
Directional Objective:
Movement toward 6677.50 buy UFO.
Maximum Reward Zone:
Below 6,825.
Risk Definition:
Above 7,010.
Estimated Reward-to-Risk:
Dependent on net premium received and paid.
Typically favorable if structured with credit offset.
The key takeaway:
The trade achieves maximum reward before the classical target is reached.
That increases structural efficiency.
ES Contract Specifications
Symbol: ES
Multiplier: $50 per index point
Minimum tick: 0.25
Tick value: $12.50
Approximate margin (as of Feb-16 2026, subject to change): ~$24,200 per contract
For defined spreads:
Margin is generally capped at the maximum potential loss.
Call spread: Up to $500.
Put spread: Up to $250.
Combined structure: Determined by net risk and broker margin methodology.
Always confirm margin with your broker.
MES Alternative – Capital Efficiency
The Micro E-mini S&P 500 (MES) offers identical structure at 1/10th scale.
Multiplier: $5 per point
Tick value: $1.25
Approximate margin (as of Feb-16 2026, subject to change): ~$2,420 per contract
Spread risk comparison:
Call spread:
10 points × $5 = $50 max intrinsic width.
Put spread:
5 points × $5 = $25 max intrinsic width.
This allows:
Smaller accounts to replicate structure.
More granular position sizing.
Portfolio scaling flexibility.
MES does not change the thesis. It changes capital efficiency.
Risk Management Principles
Even defined-risk structures require discipline.
Position Sizing:
Risk per trade should remain a small percentage of portfolio capital.
Volatility Risk:
Sudden volatility spikes can expand option values rapidly.
Assignment Risk:
Short options can be assigned before expiration.
Time Management:
Consider managing spreads before expiration rather than holding to the final day.
Structural Review:
If market structure changes, reevaluate thesis.
Defined risk does not mean zero risk.
Why This Structure Fits This Setup
This ES environment presents:
Structural resistance above.
Liquidity support below.
Momentum leaning bearish.
A defined invalidation level.
A realistic projected target.
A self-financing spread structure allows participation in that scenario while:
Capping exposure.
Enhancing breakeven.
Limiting capital allocation.
Benefiting from time decay.
It aligns with advanced options mechanics without requiring aggressive directional exposure.
Key Takeaways
Double-top structures gain credibility when aligned with liquidity zones.
Sell UFOs above price increase probability of supply response.
Buy UFOs below often attract price.
Self-financing spreads improve capital efficiency.
MES allows flexible scaling.
Risk management always overrides conviction.
Structure first. Thesis second. Risk always.
Data Consideration
When charting futures, the data provided could be delayed. Traders working with the ticker symbols discussed in this idea may prefer to use CME Group real-time data plan on TradingView: www.tradingview.com - This consideration is particularly important for shorter-term traders, whereas it may be less critical for those focused on longer-term trading strategies.
General Disclaimer
The trade ideas presented herein are solely for illustrative purposes forming a part of a case study intended to demonstrate key principles in risk management within the context of the specific market scenarios discussed. These ideas are not to be interpreted as investment recommendations or financial advice. They do not endorse or promote any specific trading strategies, financial products, or services. The information provided is based on data believed to be reliable; however, its accuracy or completeness cannot be guaranteed. Trading in financial markets involves risks, including the potential loss of principal. Each individual should conduct their own research and consult with professional financial advisors before making any investment decisions. The author or publisher of this content bears no responsibility for any actions taken based on the information provided or for any resultant financial or other losses.  Education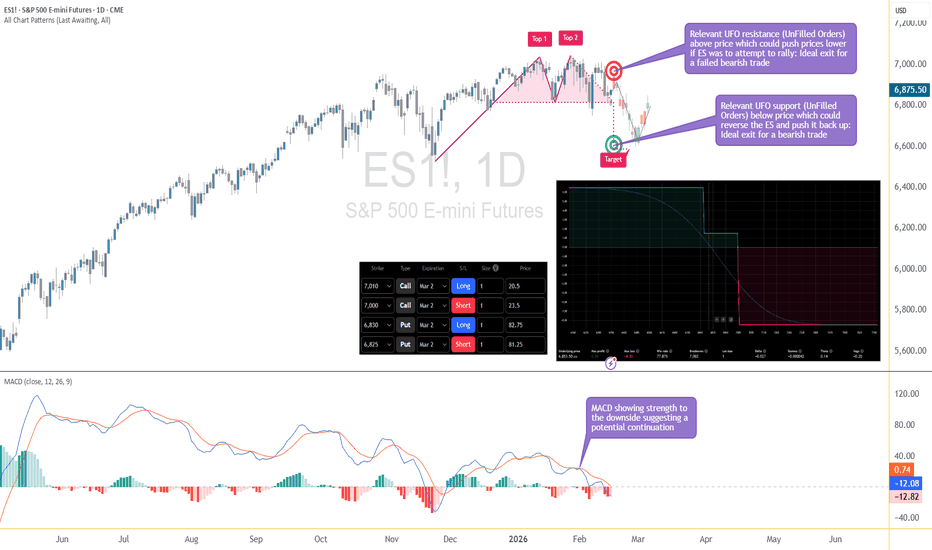
 Long
Long
 Short
Short
RegimeWorks Context Note (GBPJPY • 1H) — Scenario MapPrice printed a clear double-top structure, broke the neckline (~210.675), and then retested that level. The key detail: after the retest, bear follow-through failed — price did not sustain acceptance below the neckline. Instead, it rotated back up and is now squeezing higher inside the broader rising channel, pressing toward the upper band.
What I’m watching next (permission-first)
Context: Rising channel remains intact; price is compressing into the upper boundary (higher-risk area for late longs).
Trigger: I want to see rejection at/near the upper channel band (momentum stall + bearish reaction).
Confirmation: A clean rejection sequence (e.g., bearish displacement / breakdown from the squeeze structure), then a retest that fails.
Execution idea: Only after confirmation I’ll consider a short position, targeting a mean rotation back toward the channel interior (and potentially the lower band if momentum expands).
Invalidation
If price accepts above the upper band and holds, the short idea is invalid — that’s continuation, not rejection.
This is not advice and not a prediction — it’s a RegimeWorks-style scenario map based on current structure and location. KC1! (Coffee) — Multi-Timeframe Technical OutlookICEUS:KC1!
On the weekly chart, Coffee is forming a potential Double Top reversal pattern, with the range defined between $437.95 , and $277.25 acting as the neckline/support.
A confirmed break below $277.25 would activate the pattern and project a measured move toward $197.45.
On the daily chart, however, price action allows for the anticipation of a bullish Shark pattern, projected to complete at $303.70 — above the Double Top neckline placed at $277.25.
This creates a clear structural dependency:
The Double Top requires a breakdown below $277.25 to validate the reversal.
The Bullish Shark may act as a trend-sustaining harmonic structure, supporting price before any test/break of that neckline.
As long as Coffee holds above $277.25, the broader uptrend remains structurally intact, and the bullish Shark scenario can prevent activation of the weekly reversal pattern. The loss of this level is what shifts the commodity from trend continuation into confirmed high-timeframe reversal dynamics.
Daily chart below...
Happy Day,
André Cardoso  Short
Short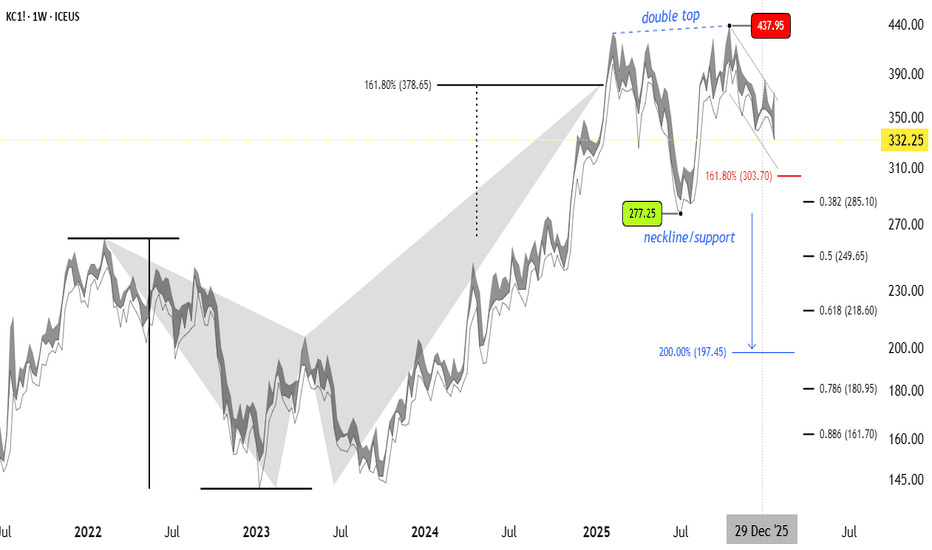
XAUUSD (Gold) 1H chartThe price action is forming a Double Top / Distribution structure near a key resistance zone.
Top 1 & Top 2 are clearly marked at almost the same price level.
This shows buyers are losing momentum and sellers are defending this zone strongly.
After the first top, price corrected, then retested the same zone → classic rejection behavior.
This pattern usually signals potential trend exhaustion if resistance holds.
🔴 Resistance Zone
Major Resistance:
5,085 – 5,100
Why this zone is important:
Multiple candle rejections
Double top formation
Price struggling to close strongly above it
Psychological round-number area
👉 A strong hourly close above 5,100 would invalidate the bearish setup and open the door for continuation.
🟢 Support Levels
Support 1 (Near-term):
5,030 – 5,040
This is the neckline / pullback base and dynamic support (near EMAs).
Support 2 (Major Target Zone):
4,860 – 4,880
This aligns with the projected move of the double top and previous structure support.
📈 Bullish Scenario
If price:
Breaks and holds above 5,100
Shows strong bullish candles with volume
Then:
Upside continuation is likely
Next bullish move can extend toward 5,150 – 5,180
📌 This would mean resistance has flipped into support.
📉 Bearish Scenario (Preferred if Resistance Holds)
If price:
Fails to break 5,085–5,100
Breaks below 5,030 support
Then:
Selling pressure may accelerate
Price can move toward 4,860–4,880 (pattern target)
This aligns with the double top breakdown projection shown on the chart.
Wait for confirmation, not anticipation
 Short
Short
 Short
Short
Short 
Short 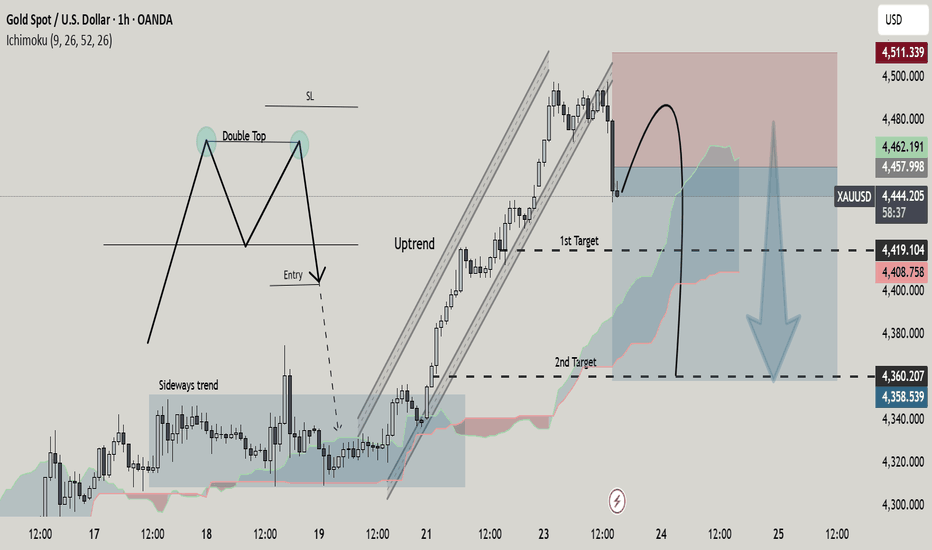
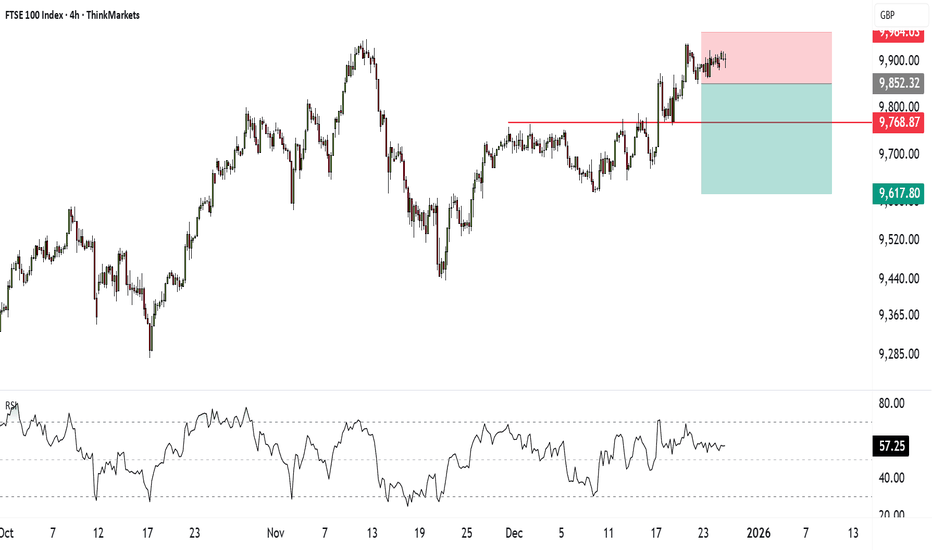
FTSE 100 stalls at record highs: Double top or breakout to 10k?The FTSE 100 is flirting with a potential double top at 9,950 as markets reopen after Christmas. While a bullish ascending triangle could be building on the 4-hour chart, heavy pressure on defence stocks amid new Ukraine peace talks is creating a battle between a breakout to 10,000 and a correction back to 9,600.
In this video, we break down the macro headwinds hitting BAE Systems and Babcock as investors price in de-escalation risks. Then, we map out the technical tug-of-war: a bullish continuation toward the psychological 10k mark versus a bearish double-top reversal targeting 9,770 and lower.
Key drivers
Defence sector drag : Reports of positive peace talks between Trump and Zelenskyy have triggered profit-taking in defence majors, weighing on the index. However, rotation into defensive sectors like pharmaceuticals is keeping the FTSE relatively stable.
Double top vs. ascending triangle : Price stalled again at the 9,950 record high, forming a double top. Yet, higher lows on the 4-hour chart suggest an ascending triangle—a continuation pattern that could fuel a breakout.
RSI divergence : The 4-hour RSI is showing bearish divergence and drifting toward the 50 line, signalling waning momentum. A reset to 30 could coincide with a deeper pullback if support fails.
Key levels :
Upside : A break above 9,950 targets the psychological 10,000 barrier.
Downside : Immediate support lies at 9,850. Below that, 9,770 is crucial structure. Losing 9,620 and finally 9,440 would confirm a trend reversal.
Trade plan :
Bearish : Sell a breakdown below 9,850 targeting 9,770 and 9,620.
Bullish : Buy a break above 9,950 targeting 10k, but beware of limited upside compared to downside risk at these levels.
Are you betting on the 10k breakout or fading the double top? Share your FTSE strategy in the comments and follow for more market updates.
This content is not directed to residents of the EU or UK. Any opinions, news, research, analyses, prices or other information contained on this website is provided as general market commentary and does not constitute investment advice. ThinkMarkets will not accept liability for any loss or damage including, without limitation, to any loss of profit which may arise directly or indirectly from use of or reliance on such information.
 Short
Short
 Short
Short