$SKUU , GraniteShares 2x Long SK Hynix Daily ETFSKUU is the GraniteShares 2x Long SK Hynix Daily ETF, providing leveraged exposure to the daily price movement of SK Hynix.
The weekly structure shows a sharp decline from the recent highs, with price now around $14.93 after breaking below the previous trading range.
The chart identifies several areas of interest within the developing correction.
The overhead gaps around $20–$22 remain potential resistance zones if price recovers.
Below the current price, the $12–$11 region is the first area t
ETF
$SOXX , 12M Semiconductor Cycle Structure IdeaSOXX tracks the semiconductor sector, giving exposure to companies across chip design, manufacturing, memory, semiconductor equipment and related technologies.
That makes SOXX much more important than simply another technology ETF.
Its cycle structure can be used as a broader reference for the semiconductor complex, including major names such as NVIDIA, AMD and Broadcom on the chip-design side, TSMC and Samsung on manufacturing, Micron and SK Hynix in memory, and ASML, Applied Materials, Lam Re
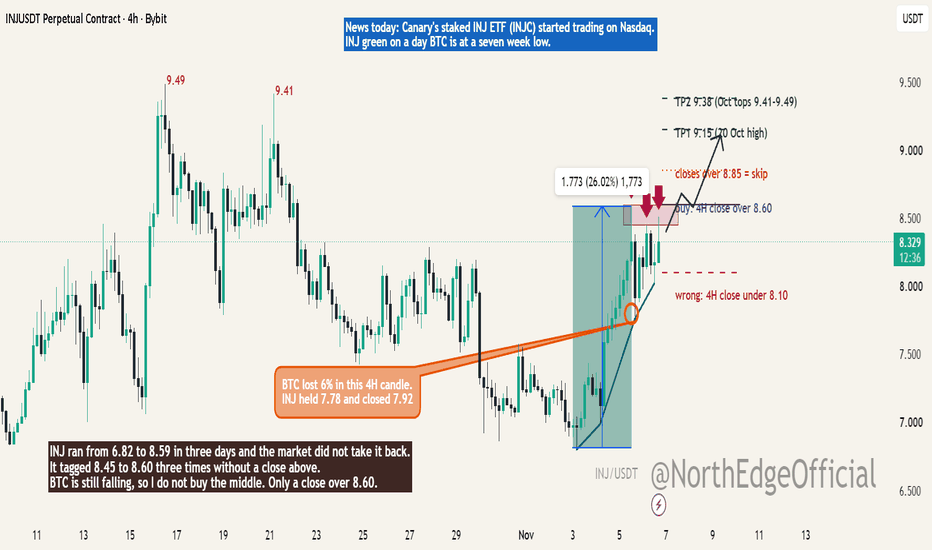
INJ got its ETF and held while BTC fell. I buy only over 8.60My last INJ idea (16 Oct) never triggered and I cancelled it. Today Canary's staked INJ ETF (INJC) started trading on Nasdaq, and INJ is green on a day BTC sits at a seven week low. X is all bell ringing and celebration.
The chart: INJ ran from 6.82 to 8.59 in three days (+26%). When BTC lost 6% in one 4H candle on 5 Nov, INJ dipped to 7.78 and still closed at 7.92. Since then it tagged 8.45 to 8.60 three times (8.59, 8.45, 8.51) without a 4H close above. It is over its 4H 200 average (7.64) an
ITA : iShares U.S. Aerospace & Defense ETF IdeaThe defense sector has been in a steady structural advance for years, and price is now resting inside a zone of interest formed at the highs. Above it, three institutional areas sit stacked like floors of a building that has not been visited yet. Below, two support zones wait in silence, one shallow, one deep.
Scenario 1: the current zone holds. Price consolidates, builds energy, and begins the staircase climb, reacting at each overhead area, pulling back, and continuing. Trend continuation in
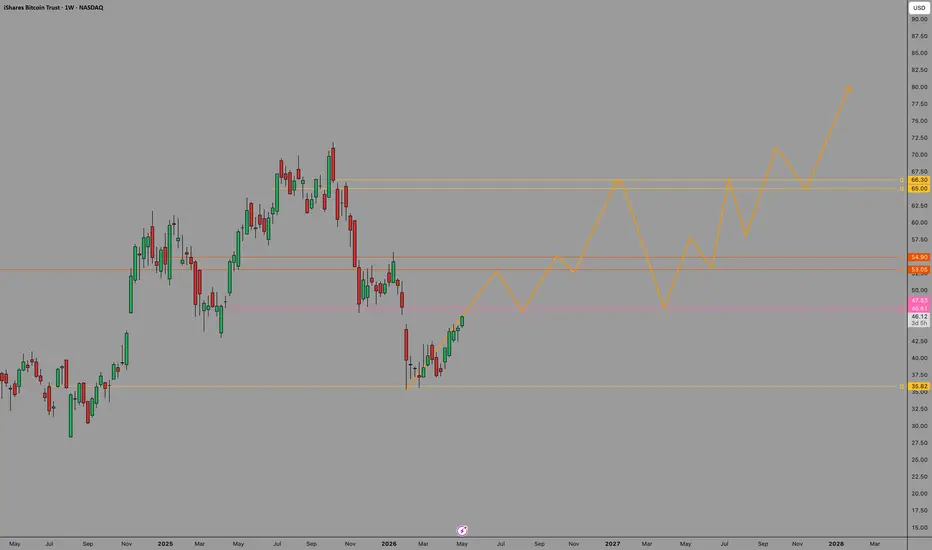
BIT Weekly — Make or BreakNASDAQ:IBIT — Weekly
One level matters right now: $47.
That's the flip zone. Resistance needs to become support before this moves anywhere meaningful.
If it holds:
→ Rally into year-end
→ Flush in 2027 (shakeout, not the end)
→ New ATH by 2028
Invalidation: lose $35.82 on the weekly and the thesis is dead.
Not financial advice. Just watching the map.
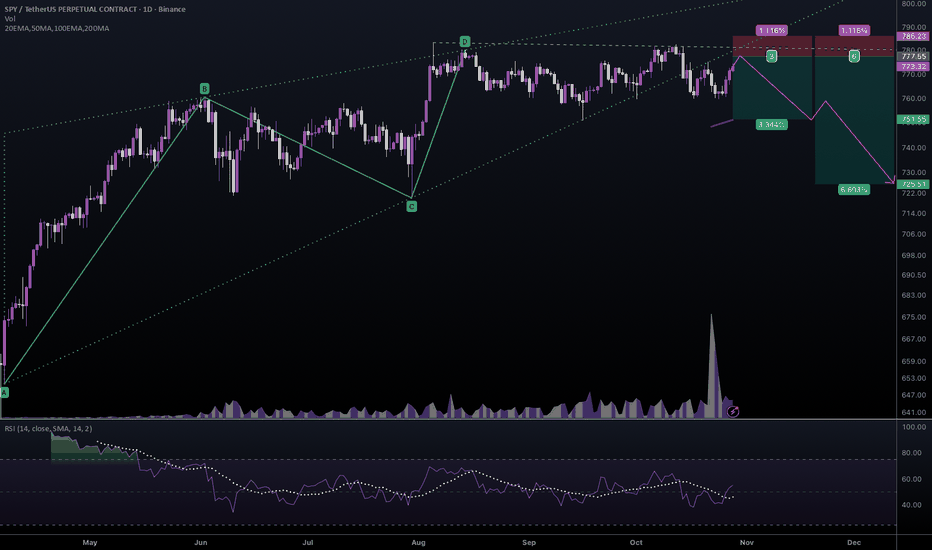
#SPYUSDT #1D (Binance) Rising wedge breakdown and retest [SHORT]SPY (SPDR S&P 500 ETF Trust) seems to have marked the top and looks likely to retrace down to 200MA support next.
⚡️⚡️ #SPY/USDT ⚡️⚡️
Exchanges: Binance Futures, Bitget Futures
Signal Type: Regular (SHORT)
Leverage: Isolated (36.0X)
Amount: 5.0%
Entry Targets:
1) 777.55 - 100.0%
Take-Profit Targets:
1) 751.55 - 50.0%
2) 725.51 - 50.0%
Stop Targets:
1) 786.23 - 100.0%
Trailing Configuration:
Stop: Breakeven -
Trigger: Target (1)
Published By: @TradingOn
AMEX:SPY BINANCE:SPYUSDT.P #1D #
BTC/USDT – Bearish RSI Divergence and Rejection at 78.8K M15Context
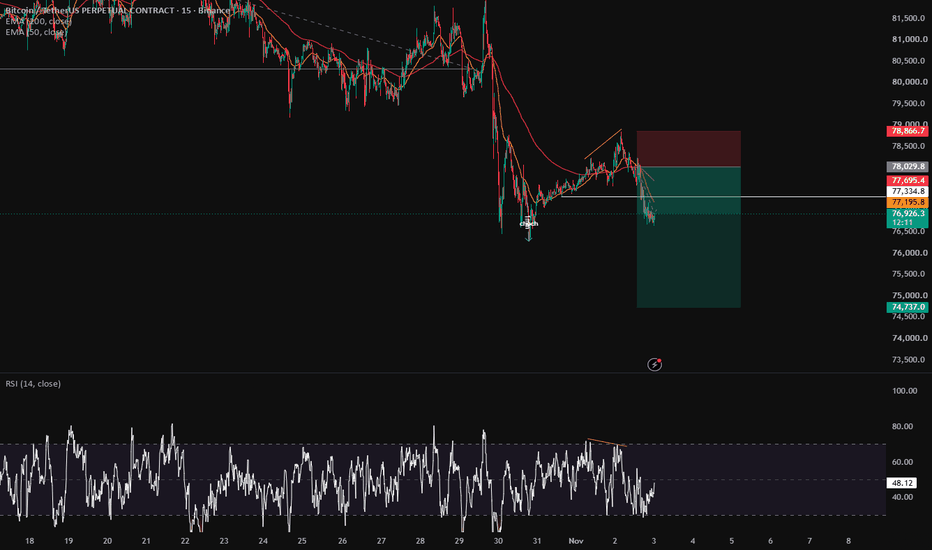
After the sharp sell-off on October 29–30, Bitcoin made a relief rally (after a CHoCH near the low) up to about 78,900. That rally stalled right under the previous breakdown area and rolled over. Price is now back below both the EMA 200 (77,703) and the EMA 50 (77,205), with the broken level at 77,335 now acting as resistance. The structure on this timeframe is bearish: the bounce failed and sellers took control.
Momentum
A bearish RSI divergence formed at the top of the bounce: price m
SMH: Two Years of Price, Earnings and Sales GrowthHas the semiconductor rally been matched by growth in the underlying businesses? This chart compares cumulative SMH share-price growth with estimated trailing 12-month earnings and sales per fund unit, all rebased to 100 on 30 September 2024.
Through 29 October 2026:
• Yellow: SMH price +128.8%
• Purple: estimated earnings per fund unit +215.9%
• Teal: estimated sales per fund unit +66.8%
The earnings and sales figures are reconstructed from the underlying companies and dated fund holdings, ad
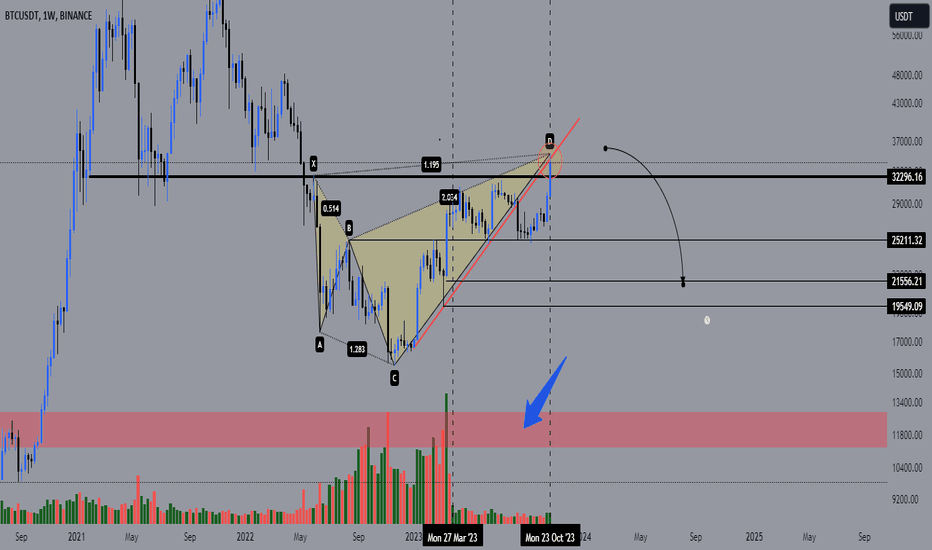
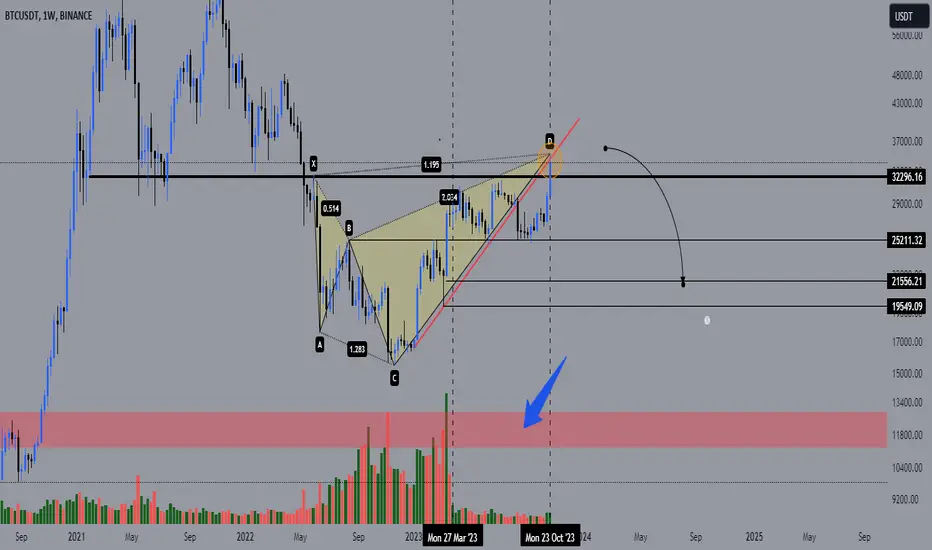
BTC Macro UpdatesBTC make perfect Bearish Shark at 35900$ as i have already share chart regarding this.
As you can see BTC spot has no volume since March as mentioned in chart.
It is just manipulation and grapping liquidity
According to onchain analysis Upside liquidity has been grab almost 1.5B$ has been liquidate.Everyone is bullish now which means big move is coming.This senerio is remindering about recent crash when BTC touch 50k$ from 30k$ in May 2022.
Becaregul with your trade on larger tf.
Trendline has a
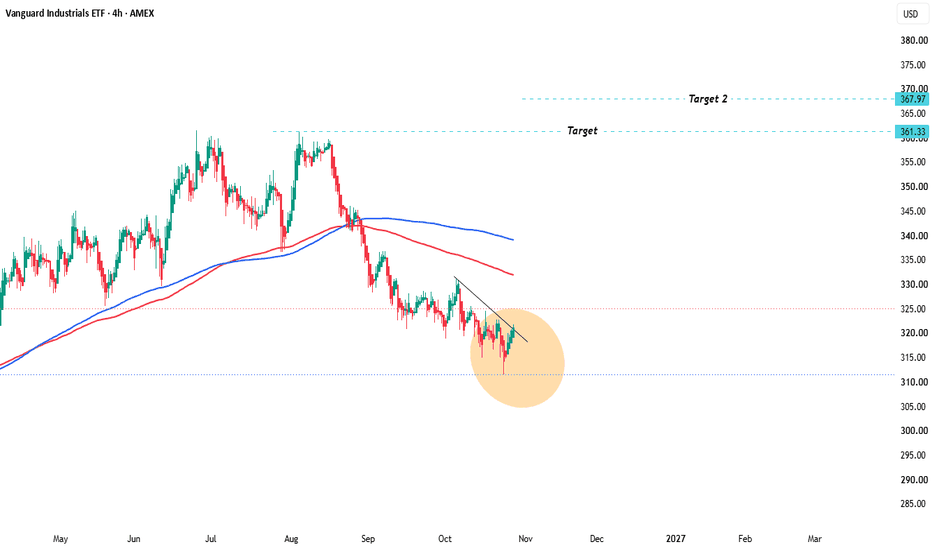
Vanguard Industrials ETF (VIS). VIS**Vanguard Industrials ETF (VIS)**
The Vanguard Industrials ETF provides diversified exposure to U.S. industrial companies, including businesses operating in aerospace, machinery, transportation, construction, and industrial services.
The broader higher-timeframe pattern provides the directional context for this analysis. On smaller timeframes, the focus is on identifying a **confirmed shift in market structure toward the upside**, potentially opening the way for a continuation toward the **Al
SPY holds near its 50-day average below the October highSPY has gone sideways. The close of $769.66 is almost flat over 5 sessions and only about 0.7% higher over 20, sitting right on SMA20 $770.41 (-0.1%) and SMA50 $767.53 (+0.3%). Volume was 28.1M, just 0.69x the 50-day average, and RSI14 is a neutral 51: no conviction either way.
The bigger picture is still constructive, with the SMA200 at $727.76 about 5.8% below. But since late August the tape has been a range, not a trend: highs at $775.30, $775.14 and $781.62 (Oct 6, the 52-week high) against
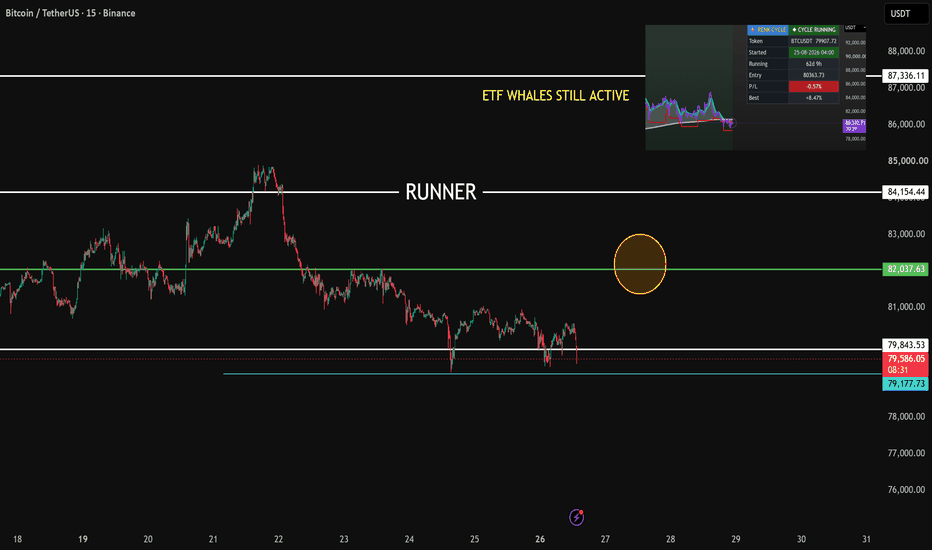
ETF CYCLE STILL ACTIVE 84k+ ON WAY - AS LONG ETF IS ACTIVE = POSDepending on trend study ETF whales still acctive and rebuilding the trend, on this reason there is totally no reason for main breakdown.
There is high chance BTC is going to enter 84K in the coming time, after it play the fake volume out at the 79.5K and the 79K area.
Depending on TA The runner can become an important next target. ETF volume will play depending this study as stracture volume, which can defend the trend of BTC to next 82-84K+
With Renk system we did predict the best increases
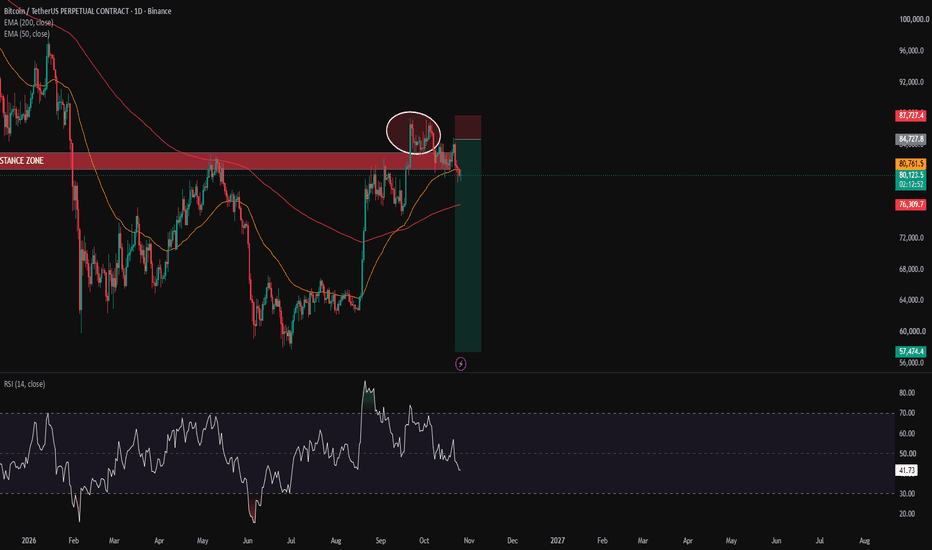
BTC/USD – Bearish Rejection After a Liquidity SweepBitcoin is in a larger bearish structure: it fell from above 96,000 to a low near 57,500, then rallied sharply back into a major resistance zone (about 80,000–83,000). That zone rejected price before, and the recent push above it was a quick sweep of highs (circled on the chart) that failed to hold. Price has now closed back below the EMA 50 (80,761) and is trading at 80,115, with the EMA 200 (76,309) as the next dynamic support.
Momentum
RSI (14) is at 41.7 and has dropped from the overbough
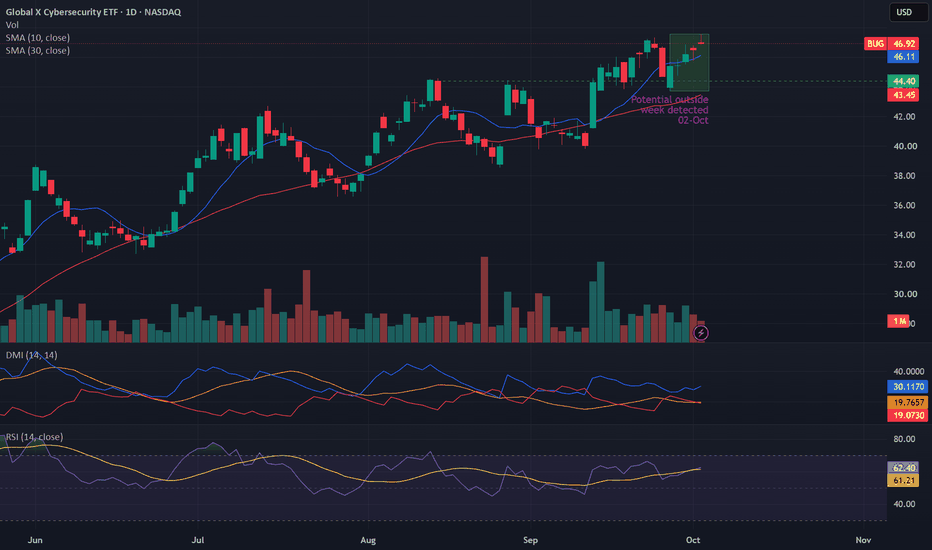
Potential outside week and bullish potential for BUGEntry conditions:
(i) higher share price for NASDAQ:BUG above the level of the potential outside week noted on 2nd October (i.e.: above the level of $47.54).
Stop loss for the trade would be:
(i) below the low of the outside week on 28th September (i.e.: below $43.72), should the trade activate.
$VHYL , Vanguard FTSE All-World High Dividend Yield UCITS ETFThe monthly chart shows a long-term advance from the 2011–2012 lows, with price now trading near the recent highs.
The current structure identifies two potential correction areas:
Premium: the first major correction zone, around £58.50.
Ultra Premium: a deeper correction area, with liquidity identified around £45.46.
These are potential areas of interest within the broader structure. Their relevance will depend on how price reacts as the correction develops.
The long-term projections identif
$SMH , VanEck Semiconductor ETFSMH provides exposure to the semiconductor industry, including chip designers, manufacturers and semiconductor equipment companies.
The monthly structure shows a strong expansion from the 2022 lows, followed by a sharp acceleration into the current highs. Price is now trading below its recent peak, bringing the next corrective phase into focus.
The structure identifies three major long-term valuation zones:
Premium: first major correction zone.
Ultra Premium: deeper correction zone.
Mother o
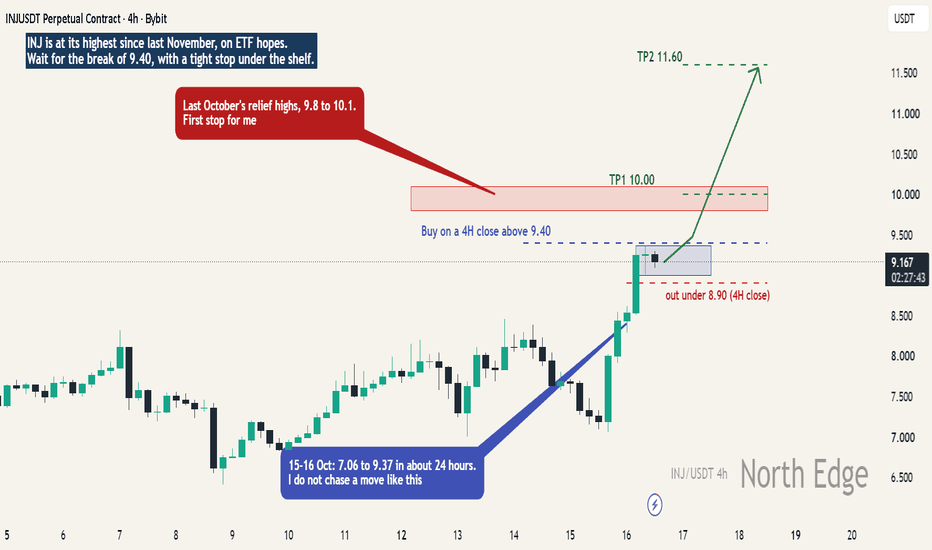
INJ ran 30% in two days. I buy only above 9.40INJ went from 7.06 to 9.37 in about 24 hours on 15-16 Oct, its highest since last November. The story is ETF hopes: three US filings (21Shares, Canary, REX-Osprey) and the CEO saying he expects INJ ETFs before 2027. Nothing is approved yet.
I do not chase a vertical move. After the spike it built a small shelf at 9.0-9.37, and last October's relief highs at 9.8-10.1 sit just above. I buy only after a 4H candle closes above 9.40. TP1 10.0, TP2 11.6, the spike added on top of the shelf. Wrong on
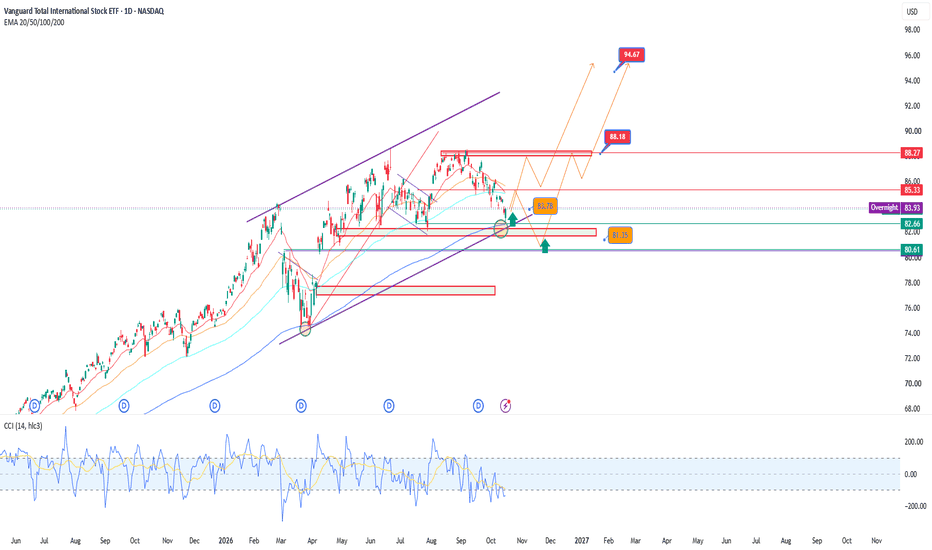
VXUS: Pullback Toward SupportVanguard Total International Stock ETF
VXUS is trading at 83.84 on the daily chart, pulling back from the 88.27 resistance after a prolonged advance within a broad ascending channel. Price is testing a key support cluster around 82.66, where the rising trendline and previous consolidation zone converge. The first recovery level is 85.33, while a decisive breakout above 88.27 would confirm renewed bullish momentum and open the way toward 94.67. If support at 82.66 fails, the next downside levels
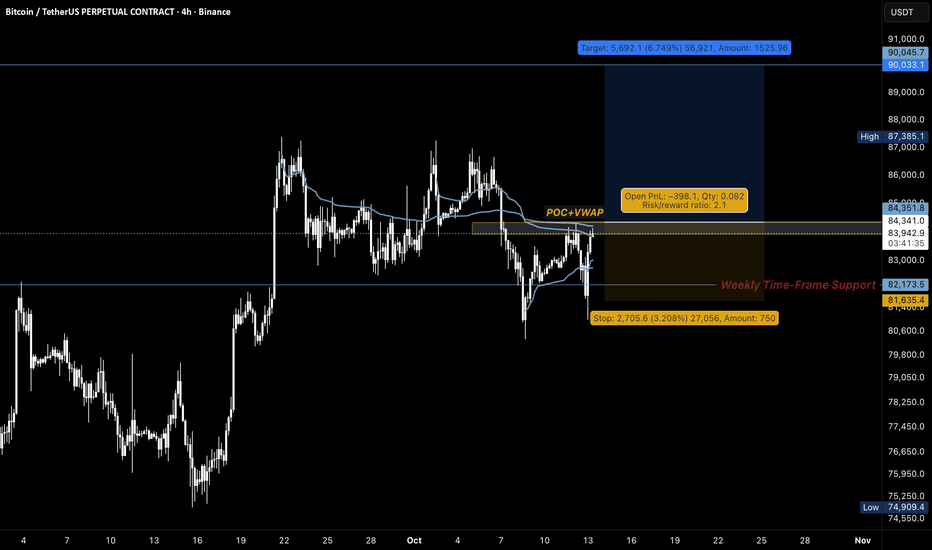
BTC at the Gate: Break 84K and 90K Opens Up BINANCE:BTCUSDT.P 4H Time Frame:
Bitcoin is trading inside the most important resistance zone on the chart: 84,000 – 84,360.
Why does this zone matter?
It holds the POC of the entire range, the price level with the most traded volume.
Two major VWAPs converge here.
It was support before the recent breakdown, so it now acts as resistance.
Structure:
Price is ranging between ~80K and the 87,385 range high, which has been rejected several times.
Weekly time-frame support at 82,173 held. Wicks b
$BWET - ETF , Tanker Freight Cycle Structure IdeaBWET (Breakwave Tanker Shipping ETF) is not a traditional tanker-stock ETF. It provides exposure to crude-oil tanker freight through futures, primarily VLCC TD3C contracts for Middle East Gulf to China, with additional TD20 Suezmax exposure. The instrument therefore reflects tanker freight rates, vessel availability, route changes and the pricing of future transportation costs rather than the equity value of shipping companies.
That distinction is important when reading the long-term chart.
Th
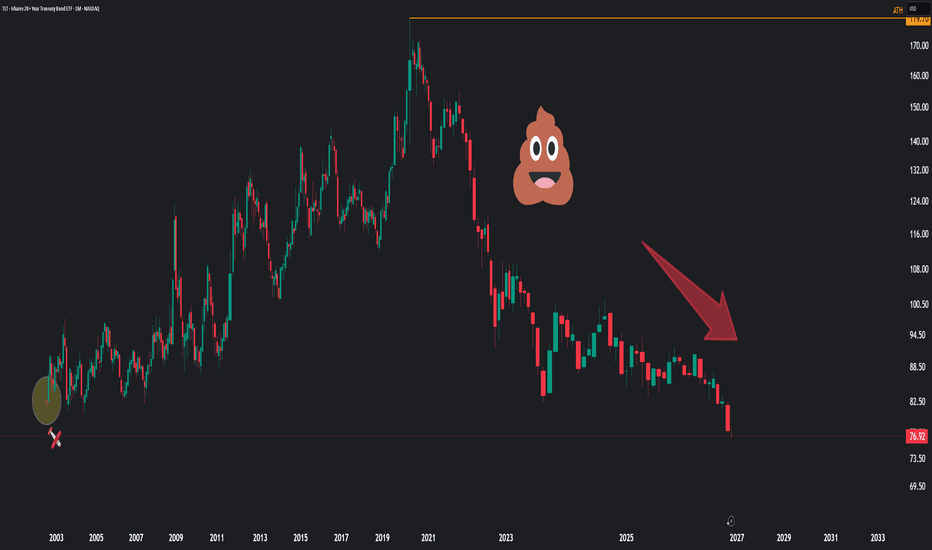
TLT: The “Safe Haven” Has TeethTLT’s monthly chart looks like a masterclass in disappointing dip buyers. Since the 2020 peak, rebounds have repeatedly stalled below previous highs. The latest decline pushes price beneath the recent consolidation, keeping the bearish structure firmly in place.
Calling every bounce a reversal does not make it one. So far, the bulls have delivered enthusiasm; the chart has delivered lower highs.
And “Treasury” is not a magic spell against losses. TLT holds long-dated government bonds, leaving
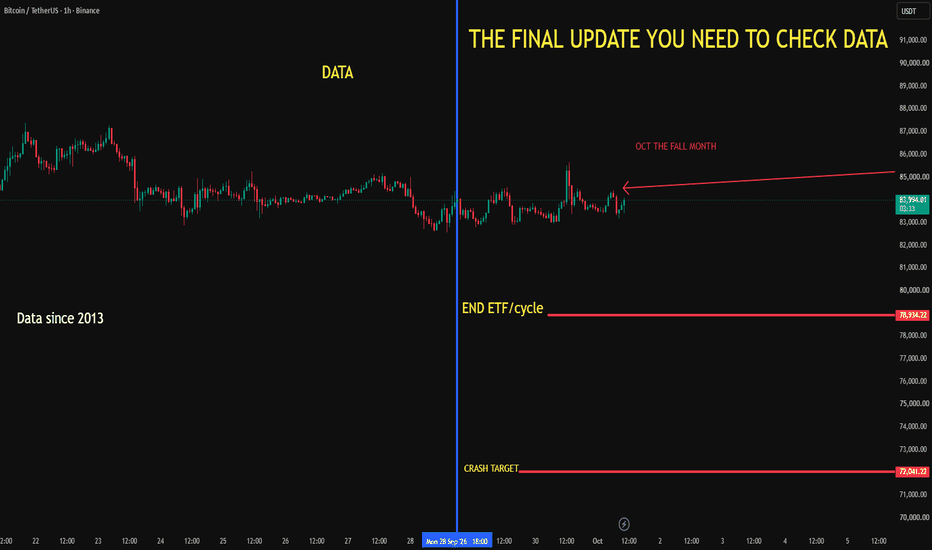
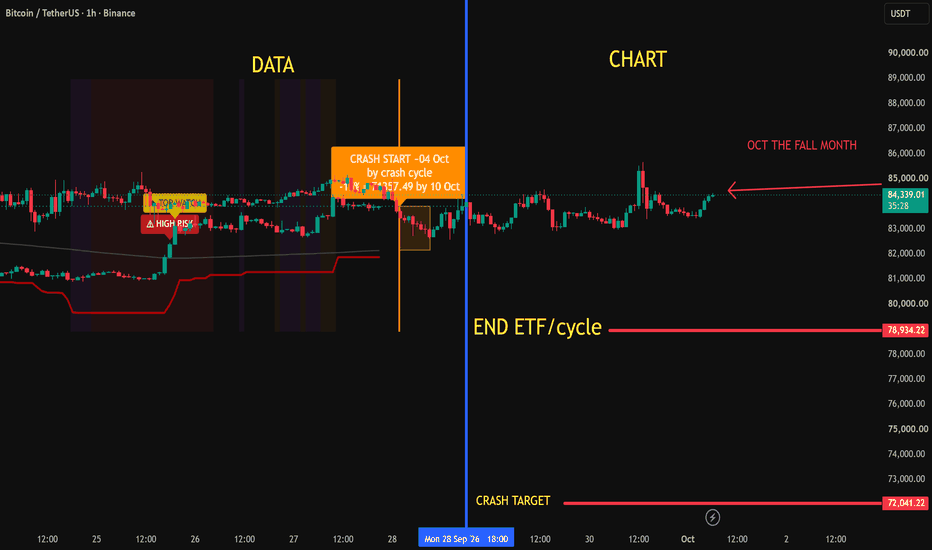
ALL THE DATA INFO HERE IN 1 UPDATE - BTC ON WAY TO 72K..CHECK IT📊 BTC UPDATE
📈 Day
According to the day trend, Bitcoin is currently in an accumulation zone, but there is still no confirmed uptrend.
⚡️ Renk Spider
According to the Spider trend, BTC is in a short-term trend and is currently waiting for Sell 1 through Sell 3 signals.
💫 Cycle Trend
According to the cycle trend, BTC is still showing an active cycle.
🏦 ETF Data
Based on the current ETF data, we are seeing a pause or potentially a stop in the main ETF flow. At the moment, $77,800 is the main ta
OCT ONE OF THE HISTORICAL CRASH MONTHS OF BTC - BTC to 72k+-We are into a new day of OCT, and the month where the data expecting the main crash to happen, we see a ETF outflow, which gives a huge signal that the fal is near and near, we have seen before more ETF falls. This effected into free fall trends, as BTC looks on the day trend normally, and even increasing with manipulation volume, is what the data shows what else
Data shows OCTO will become one of the historical crash months for BTC
Normally we know SEP as worse month, depending on our data O
US INTEREST + HOUSE BUBBLE US + ETF OUTFLOW MAIN REASON BTC 72KBitcoin is holding around 84K+, but the rally is losing steam and the macro picture is turning against it. Here is my bearish scenario.
Data shows that ETF getting step by step out after the cycle of BTC
one of the signals of manipulation crash market makers playing with volume, is the speed to use to increase the volume, and to force to have more up volume, with the goal of upcoming crash.
1. US interest rates
Treasury yields are climbing and analysts now talk about a 6% 10-year yield. High