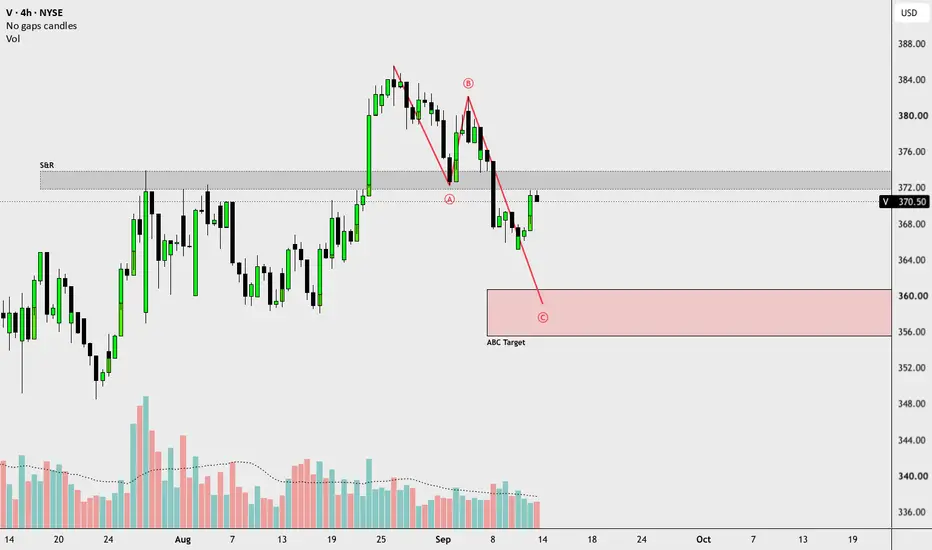
Short
Short
 Short
Short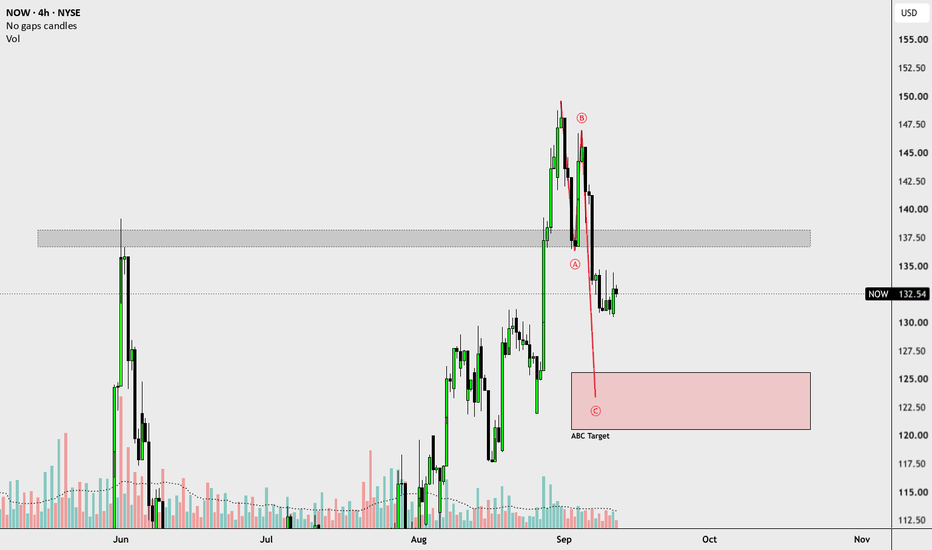
 Short
Short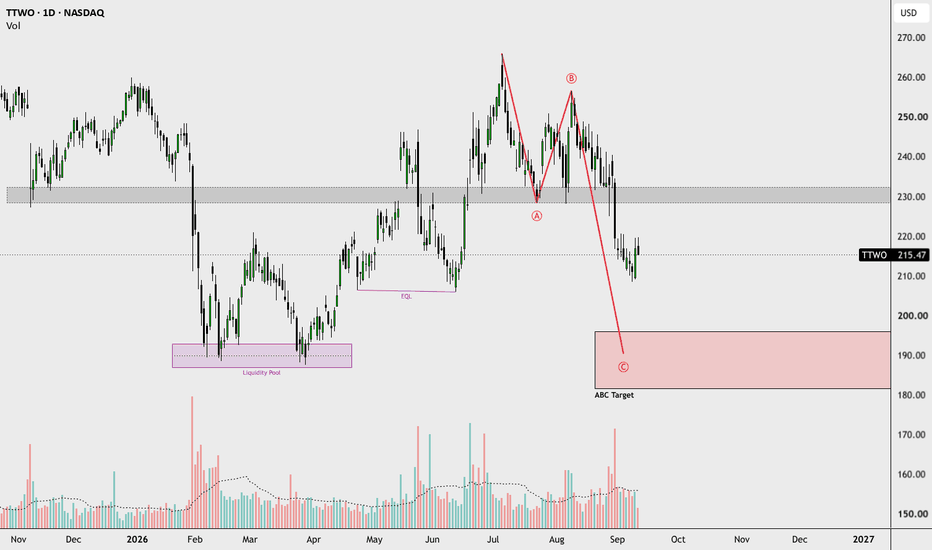
 Long
Long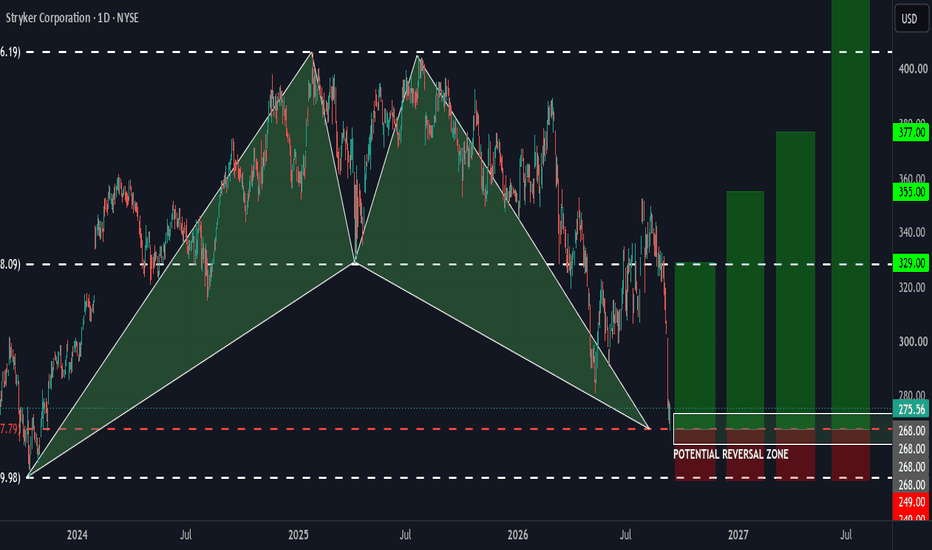
HINDALCO - Long SetupHello traders, let's look at the current technical structure for Hindalco Industries Limited (HINDALCO) on the 125-minute timeframe.
After a strong rally of over 16% driven by solid QoQ and YoY earnings performance, the stock touched a high of 1,088 before entering a swift corrective pullback. The price recently tested a low of 1,021.4 and is now showing signs of stabilizing at key demand confluence.
Key Technical Observations:
Fibonacci Retracement Confluence: Based on backtested parameters focusing on institutional retracement zones (0.618 and 0.79), the stock is reacting directly off the 0.618 Fibonacci level (~1,022).
Role Reversal (Resistance-Turned-Support): The current support zone precisely overlaps with previous structural resistance levels (marked with dashed lines), creating a high-probability demand floor.
Favorable Risk-to-Reward: Following the sharp correction from 1,088, the current consolidation offers an asymmetric entry with minimal downside risk against a substantial upside target.
Trade Plan (Long)
Entry Zone: 1,025 – 1,030 (Accumulation within the Fib support band)
Stop Loss (SL): 1,015 / 1010 (Strict invalidation below the 0.618 Fib support level)
Target: 1,088 – 1,090 (Retest of the recent swing high)
Risk-to-Reward (R:R):~1:4+
Trade Psychology & Risk Management:
When buying corrective pullbacks in an established uptrend, discipline is key. **Avoid chasing the price and let the price come into our planned trading range of 1,025 – 1,030 so that the Risk-to-Reward remains heavily in our favor.** Never enter out of FOMO; execute only where downside risk is clearly defined and protected by major support confluence. Keep your position sizing aligned with your risk tolerance and always respect your hard stop loss at 1,015.
What is your outlook on HINDALCO? Do you expect the rally to resume towards fresh highs, or will it test the lower 0.79 Fib zone first? Let’s hear your thoughts in the comments!
Disclaimer: This analysis is strictly for educational purposes and does not constitute a trade idea or financial advice. Investment in the stock market is subject to market risks.*  Long
Long
GOLD - A Hunt for Liquidity Ahead of Further DeclinesICMARKETS:XAUUSD has been forming a countertrend correction since the session opened. The fundamental backdrop remains unstable, and this correction could end with another move lower
Gold remains exposed to two-sided risks ahead of the release of U.S. CPI data. The sell-the-bounce strategy remains in place, especially against the backdrop of higher-than-expected inflation in China. TD Securities expects core inflation to remain under control in August but warns of upside risks
Drivers:
Upside: weak U.S. CPI data, dollar weakness, de-escalation of the conflict.
Downside: hot CPI data, dollar strength, escalation of the conflict, hawkish Fed rhetoric
Resistance levels: 4,410, 4,435, 4,461
Support levels: 4,365, 4,287
A weaker dollar, driven by yen strength, is supporting gold. At the same time, however, gold remains under pressure from the Fed’s hawkish stance and geopolitical risks.
Technically, I expect a short squeeze around the 4,430–4,435 liquidity zone, followed by a decline toward range support at 4,365–4,287
Best regards,
R. Linda!  Short
Short
AVGO: Elliott Wave roadmap and the 440 recovery testBroadcom's daily chart presents a recovery attempt with unfinished business. Holding 342.331 is the first requirement; reclaiming 398–405 is the next test. A daily close above 440 followed by a successful retest would provide stronger evidence that the correction from June's 495.000 high is ending.
This roadmap is dated September 9, 2026. The latest completed session shown is September 8, with a close of 368.560 and RSI(21) at 45.73. Prices are in USD, as displayed on the TradingView feed. Momentum has not yet confirmed a sustained bullish turn.
Three degrees, one working interpretation
The requested history begins on March 16, 2020. The lower low on March 18, at 15.567, provides the actual wave origin. The larger interpretation places Cycle at the December 2021 high of 67.776 and Cycle at the October 2022 low of 41.507.
The blue Primary sequence inside possible Cycle runs through 251.880, 138.100, 414.610, 289.960 and finally 495.000 on June 3, 2026. Primary 4 remains above Primary 1, and Primary 3 is not the shortest motive wave. Purple Intermediate waves detail selected subdivisions within Primary 1; the chart does not claim an exhaustive audit of every internal wave since 2020.
The subsequent decline can be read as Primary A at 356.430, B at 432.730 and a possible C at September's 342.331 low. That could complete Cycle , but the question mark matters: a more complex or extended correction remains possible.
What Elliott adds to the decision
A plausible count should identify what price must do next and where the interpretation fails. It should not turn every rebound into an assumed fifth wave. Here, the larger upward structure and the current corrective sequence can coexist while the market decides whether September produced a durable low.
The practical distinction is between identifying a candidate bottom and receiving confirmation. Fibonacci relationships help organize reaction areas; they do not establish probabilities or guarantee a reversal. The current RSI reading supports patience rather than treating the C label as an entry signal.
The recovery ladder
R1: 398–405. The 38.2% retracement of the decline from 495.000 to 342.331 is 400.65: 342.331 + 0.382 × (495.000 − 342.331).
R2: 430–440. The 61.8% recovery retracement is 436.68, close to the B-wave high at 432.73. A daily close above this zone and a held retest would strengthen the recovery thesis.
R3: 490–500. This brackets the previous 495.000 high. These are recovery retracements and historical resistance, not new-high extension targets.
A rejection at resistance or a failed retest argues for waiting. Before considering an entry, the distance to the next resistance must justify the risk to a setup-specific invalidation. There is no automatic market entry or position size attached to this chart.
If the September low fails
Below 342.331, the thesis that September already ended the correction fails. The next marked area is 315–325, containing 321.77: the 38.2% retracement of the entire 41.507-to-495.000 advance. The prior Primary 4 low at 289.960 is another reference. Below it, 265–275 contains the 50% retracement at 268.25.
This local failure does not by itself invalidate the entire multiyear count. For the standard Cycle impulse interpretation, overlap with Cycle at 67.776 would invalidate this specific Cycle labeling. That distant structural boundary is not a practical trade stop.
The next useful checkpoint is whether AVGO can recover 398–405 and ultimately hold above 440. A future Cycle projection needs a confirmed low. Dotted paths illustrate conditional sequences, not calendar forecasts. This analysis is educational; manage risk around the actual setup. MY FIBONACCI FVG & ORDER BLOCK TRADING STRATEGYMy trading strategy is based on identifying the Higher Time Frame direction, using Fibonacci retracement to locate a high-probability area, and then refining the entry on the 5-minute and 1-minute time frames.
1. Identify the Main Swing
First, identify the major move on the higher time frame.
High to Low → Bearish setup
Low to High → Bullish setup
2. Apply Fibonacci Retracement
Apply Fibonacci to the confirmed high-to-low or low-to-high swing.
My main area of interest is the 0.50–0.60 Fibonacci retracement zone.
3. Wait for Price to Reach the Zone
I do not enter simply because price reaches the Fibonacci level. I wait patiently for price to return to my 0.50–0.60 zone.
4. Refine the Entry on 5M & 1M
Once price reaches the Fibonacci zone, I move to the 5-minute and 1-minute time frames and look for confirmation through:
Fair Value Gap (FVG)
Order Block
Liquidity Sweep
Market Structure Shift
5. Execute the Trade
After confirmation, I take the entry from the refined FVG or Order Block.
The Stop Loss is placed beyond the relevant invalidation point, while the Take Profit is planned around opposing liquidity, previous highs/lows, or the selected target.
STRATEGY FLOW
HTF Swing → Fibonacci 0.50–0.60 → Price Enters Zone → 5M/1M Confirmation → FVG/Order Block → Entry → SL & TP
The key to this strategy is patience, confirmation, risk management, and discipline. No setup is guaranteed, so every trade should be managed with controlled risk rather than relying on the strategy alone. Education 
ORCL: An Elliott Wave roadmap through the next resistance testsORCL has recovered from its July low, but the next useful question is whether buyers can establish strength above $171–172. That is the first decision point in this daily Elliott Wave roadmap. The more ambitious targets depend on several further confirmations.
This chart covers September 30, 2022 through September 8, 2026. The latest displayed regular-session close is approximately $162.52. Prices are in USD on the TradingView ORCL daily chart; some historical anchors remain visually rounded.
The working count treats the advance from roughly $61 in 2022 to $345.72 in September 2025 as Cycle wave . The blue Primary-degree 1–5 sequence describes that advance. The subsequent decline is provisionally counted as an A–B–C correction within Cycle , with a possible ending low at $114.50 on July 28, 2026. Purple Intermediate-degree subdivisions add detail inside Primary wave 5 and the corrective A, B and C legs. This is a selected, nested subdivision, not a claim that every internal swing has a unique interpretation.
The distinction between a plausible count and a confirmed turning point matters. A completed-looking correction can evolve into a more complex structure. Elliott analysis is most useful here as a framework for asking what price must do next, and what would invalidate the interpretation. Labels organize the evidence; they do not remove uncertainty.
The 2025 acceleration and subsequent deep retracement can be read as a transition from an extended advance into a larger correction. That interpretation supports watching for a new cycle, but it does not establish that the new cycle has begun. A rally can still be part of the correction it appears to be escaping.
For a practical decision framework, I would first look for a daily close above $171–172, followed by a retest that holds and a higher low. A brief intraday break followed by rejection would be weaker evidence. Until that confirmation develops, patience remains a valid position. Even after confirmation, the distance to the next resistance zone needs to justify the risk of the particular setup.
The target ladder is deliberately conditional:
• $200–205: the first recovery reference. A 38.2% retracement of the $345.72-to-$114.50 decline is approximately $202.83.
• $250–260: a more substantial test, combining the June wave B high near $250.25 with the 61.8% recovery level near $257.39. Sustained acceptance above this area would strengthen the case for a larger trend reversal.
• $340–346: the previous cycle-high region. This only becomes a relevant continuation objective after the lower resistance zones have been reclaimed.
• $395–410: a longer-term projection, conditional on the July low surviving and price eventually breaking above $346. The arithmetic reference is $114.50 + 1.0 × ($345.72 − approximately $61), or roughly $399. It is a measured-wave reference, not a promise or a timed forecast.
The alternative deserves equal visibility. A break below $114.50 would invalidate the claim that Cycle ended at the July low. A more complex W–X–Y correction would then remain possible, with roughly $94–100 as the next reference zone; the 88.6% retracement of the 2022–2025 advance lies near $93.46. A break below the 2022 origin around $61 would invalidate this entire Cycle I/II interpretation.
The $114.50 level is a structural invalidation, not automatically a suitable stop for a new trade near current prices. A trade stop should come from the actual entry structure, with position size reflecting that distance and the risk of gaps. No order or position is implied by this analysis.
For now, the most informative development is how ORCL behaves around $171–172. A sustained reclaim would advance the recovery thesis; rejection would keep the correction scenario open. The dashed paths show possible sequences, not dates.
Educational technical analysis. Wave counts and target zones are conditional and should be reassessed as price develops. GOLD - The market is under pressure from a bearish trend ICMARKETS:XAUUSD remains in a local bearish trend, while consolidation below the 4,435 liquidity zone is becoming a technical catalyst for further downside
The dollar is stagnating, but at the same time, it is weakening due to interventions by the Bank of Japan. Gold looks weak against this backdrop, especially given the Fed’s medium-term hawkish stance. Geopolitical risks and inflation expectations that could limit further upside remain in place. The key event of the week will be the U.S. inflation data on Friday, which will determine the next direction.
Drivers:
Upside for gold: further dollar weakness, a stronger yen, weak U.S. CPI data.
Downside for gold: dollar strength, hawkish Fed rhetoric, rising geopolitical tensions (supporting oil and the dollar), strong CPI data
Resistance levels: 4,435, 4,461, 4,490
Support levels: 4,365, 4,320, 4,290
Gold remains under pressure from a weak fundamental backdrop and the local bearish trend. A short squeeze around the liquidity zone is triggering further downside. I do not rule out a retest of local resistance before another decline toward 4,365–4,290
Best regards, R. Linda! Short 
Maruti Suzuki: Reversal Signs Emerging on Daily ChartMaruti Suzuki: Reversal Signs Emerging on Daily Chart
Maruti Suzuki India Ltd. – Technical View
CMP: ₹13,824
Stop Loss: ₹13,170
Targets: ₹14,570 | ₹15,440
Maruti Suzuki is showing encouraging signs of a potential trend reversal on the daily chart. The price structure resembles a Cup & Handle, Double Rounding Bottom, or even a Volatility Contraction Pattern (VCP)—all of which are considered constructive bullish formations when confirmed by a breakout.
From a broader perspective, the stock appears well-positioned for a fresh upside move if buying momentum continues. Additionally, declining crude oil prices could act as a supportive macro factor for the automobile sector, potentially benefiting Maruti through lower input and logistics costs, subject to broader market conditions.
Risk Management
Maintain strict stop-loss discipline.
Control position sizing.
Avoid overexposure in a volatile market.
Pyramiding can be considered only after a sustained move above key resistance levels with confirmation of trend continuation.
Consider partial profit booking near Target 1 and trail the stop loss thereafter.
⚠️ Be cautious in volatile markets. Maintain strict stop-loss discipline, control position sizing, avoid aggressive pyramiding, and do not overexpose capital.
⚠️ Clarification:
This is an independent analysis based purely on technical and market study. No part of Religare is involved in this view or recommendation.
📝 Important:
I am not responsible for any loss or profit incurred. I am not taking any fees for these views—just sharing my analysis for educational and informational purposes.
📉 Disclaimer:
Not SEBI-registered. Please do your own research or consult a financial advisor before taking any investment decision.  Long
Long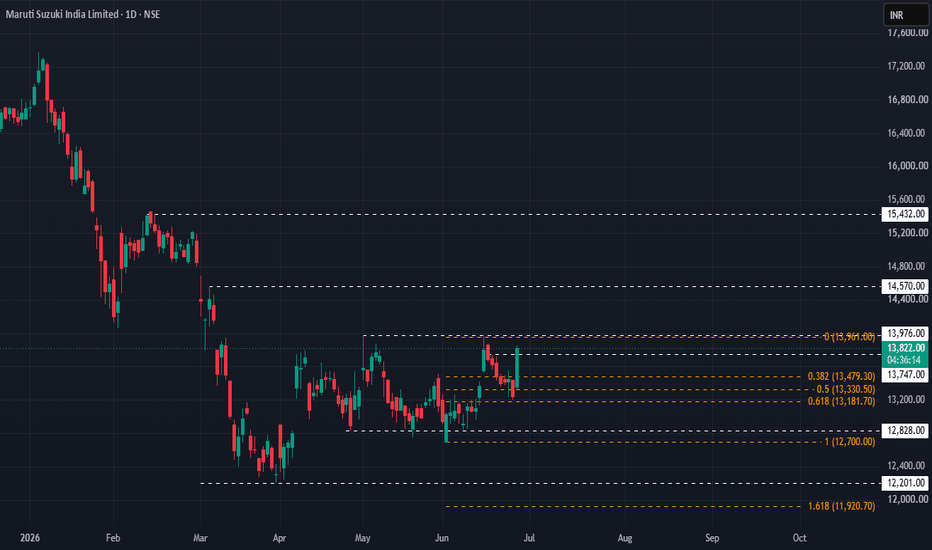
 Long
Long
ETHUSDT - The Hunt for Liquidity Ahead of a Bullish Rally BINANCE:ETHUSDT.P continues to consolidate within the 2,350–2,550 range. Resistance has been confirmed and is acting as an important trigger. A breakout above 2,550 could trigger a rally higher, but...
Bitcoin has been consolidating near resistance for the third consecutive week, suggesting that the bulls may still be interested in pushing prices higher. Ethereum is also consolidating. A scenario involving a long squeeze of support before the next move higher remains possible. Such a move could support the broader altcoin market.
Technically, when it comes to Ethereum, the key focus is on the local 2,444–2,430 liquidity zone. A retest and long squeeze of this support zone could shift the balance of power toward buyers and trigger an impulse toward 2,620–3,000
Resistance levels: 2,550, 2,620
Support levels: 2,443, 2,431, 2,356
A false breakdown of support followed by consolidation above the level could become a technical catalyst for further upside, both within the local 2,430–2,550 range and within the broader bullish trend that has been developing since the beginning of July
Best regards,
R. Linda!  Long
Long
GOLD - The price remained within the range following the NFPICMARKETS:XAUUSD is reacting to Friday’s NFP data with a fairly strong sell-off. However, the market is aggressively buying the dip. What should we expect from the market on Monday?
The dollar remains weak, but toward the end of Friday’s trading session, the market gave back part of the bullish impulse, providing some support for the dollar.
The main focus remains on geopolitical developments and upcoming economic data, including PPI and CPI.
Technically, I expect a correction toward 4,396–4,381 to potentially develop from the session open, followed by a possible move higher toward the 4,490–4,510 area of interest.
However, the fundamental backdrop remains mixed, with no clear directional bias. A close below 4,365 could trigger a sell-off toward 4,280
Resistance levels: 4,435, 4,461, 4,490
Support levels: 4,396, 4,381, 4,365
Within the local correction, gold is testing the 4,440 liquidity zone, where a bounce toward the 4,396–4,381 support zone could develop. If the bulls manage to maintain the bullish impulse, this could lead to a move toward 4,440–4,490 within the local range
Best regards,
R. Linda! Long 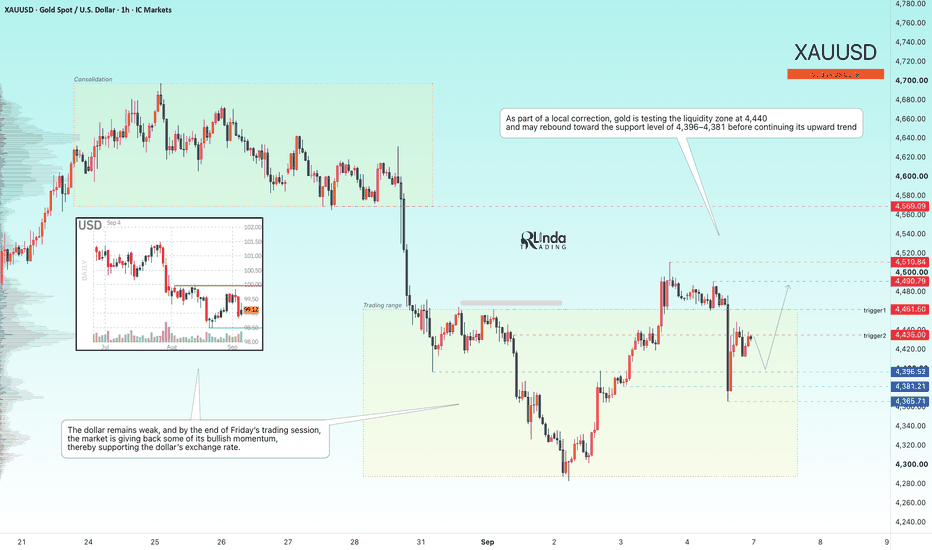
BTC / USDT: Higher Timeframe Structure at Critical 61.8% Decisio**Title:**
`BTC / USDT: Higher Timeframe Structure at Critical 61.8% Decision Point`
**Market Context & HTF Structure**
On the higher timeframe, BTC continues to print lower highs, having previously faced strong rejection from the 61.8% Fibonacci retracement level down to structural lows. Price has now pushed back up with solid bullish displacement and is once again retesting the 61.8% zone.
---
### Key Levels to Watch
* **Fibonacci Retracement Zone:** $61.8\%$ (approx. $82,600$) to $75\%$ (approx. $88,000$)
* **Bull Trap / Expansion Zone:** $82,600 \text{ to } 88,000$
* **Structural Bearish Confirmation Level:** Daily close below $77,300$
---
Scenario Analysis
**Scenario 1: Trend Continuation & Bull Trap**
Treat this current rise as a potential bull trap originating from the $61.8\%$ to $75\%$ retracement zone ($82,600 \text{ – } 88,000$). If buyers fail to sustain momentum within this premium area, expect a sharp rejection leading to another impulsive sweep toward the lower range lows.
**Scenario 2: Immediate Bearish Reversal**
If price rejects directly from current levels and prints a confirmed daily close below $77,300$, the daily market structure will (CISD) from bullish/neutral correction to explicitly bearish, validating continuation of the lower-high sequence.
---
*Keep these levels locked in on your charts. Let's wait for Monday's open to assess price action confirmation before the next update.* BITCOIN - Consolidation following the NFP. There's a chance...BINANCE:BTCUSDT.P is consolidating within the 76,000–81,000 range. The key target at 83K has still not been reached, which is why it remains relevant. Yesterday’s NFP data triggered another round of liquidity collection, and the market continues to consolidate
Bitcoin continues to consolidate. Yesterday’s attempt to break through resistance failed amid the mixed NFP report. However, the market is holding the downside, with price consolidating above 79,500.
Technically, the medium-term outlook remains favorable. The flagship asset previously broke out of the global bearish trend. ETF inflows continue to increase, as does bullish sentiment. Within the current consolidation, I would highlight two key levels: 79,850 and 77,000
Resistance levels: 79850, 81300, 82850
Support levels: 79550, 77000
At the moment, price is consolidating above the intermediate 79,550 support zone, while a close above 79,850 could trigger a continuation of the local uptrend.
However, given yesterday’s news, the broader consolidation could continue, and the market maker may form a retest of the lower area of interest. The key focus is 77,000 — the second trigger. A long squeeze could also trigger an impulse toward 83K
Best regards,
R. Linda!  Long
Long
Gold Weekly OutlookGold is currently trading around the 0.618 Fibonacci level near **4,426**, making this a critical decision zone.
The recent reaction from the **4,300–4,400 support area** suggests buyers are still defending the lower levels.
My HTF structure remains constructive as long as price holds above the **4,219–4,300 region**.
The first upside obstacle is around **4,571**, followed by the **4,717** Fibonacci level.
A clean break above 4,717 could open the way toward the **4,890–5,028 liquidity zone**.
My main **liquidity target is 5,028**, where significant buy-side liquidity may be resting.
However, price must first reclaim the intermediate resistance levels with strong momentum.
If 4,300 fails decisively, the bullish scenario becomes weaker and deeper correction becomes possible.
For now, I am watching for a bullish confirmation from the current HTF support rather than chasing the move.
**Weekly bias: Bullish above support, with 5,028 as the major liquidity target.**
Long 
How Fibonacci ACTUALLY Works (And How Smart Money Uses It)A lot of traders draw Fibonacci retracements backwards, get confused by too many lines, or trade them blindly.
Fibonacci levels aren't magical lines where price magically bounces. In institution-driven markets, Fibonacci levels represent mathematical zones where Smart Money seeks liquidity and discount pricing.
Here is the exact breakdown of how to pair Fibonacci with SMC to locate high-probability trade entries:
📌 1. Finding Point A & Point B (The Swing Points)
Point A (The Anchor): Drawn from the major high where the initial impulse leg started.
Point B (The Low): Drawn to the point where price completed its leg down before starting a corrective retracement.
📌 2. The Golden Pocket (61.8% – 78.6%)
The 61.8% retracement level acts as a primary inflection point. When price pulls back into this area, retail traders often attempt to trade the break, while Smart Money looks for rejection or continuation.
In the chart above, price is directly testing the 61.8% Golden Pocket right near key resistance. A clean break here unlocks higher expansion toward external liquidity targets.
📌 3. Confluence with SMC (The Secret Sauce)
Never trade a Fib level on its own. The highest probability trades occur when a Fibonacci level aligns perfectly with an SMC structural element:
The 38.2% / Discount Level: Notice how the lower retracement level aligns directly with an Inverse Fair Value Gap (IFVG) near $68,000.
When an IFVG or Order Block overlaps with a Fib retracement level, it transforms that area into a high-probability demand zone.
💡 Takeaway for Traders
Stop using Fibs as standalone signals. Use them as a ruler to measure Premium vs. Discount zones, and only take the trade when an Order Block, FVG, or Liquidity Sweep lines up right at the level.
How do you use Fibonacci in your daily trading? Do you prefer the 61.8% Golden Pocket or deep 78.6% OTE entries? Let’s discuss below! 👇
⚠️ Disclaimer: For educational and analytical purposes only. Not financial advice.
#TradingView #Fibonacci #SmartMoneyConcepts #TechnicalAnalysis #CryptoTrading #Education Education 
XAUUSD: Bearish Matryoshka Sequence & BC ShortGold initiated a macro bearish sequence from the cycle peak down into Red (A), retracing to establish Red (B) before resuming downward order flow. Within the subsequent impulse, price formed an internal sub-cycle (Pink sequence) that cleanly fulfilled its micro ABC target around 4,400–4,600. The completion of this sub-sequence unlocked its Whole Correction Level (WCL), which converged directly with the macro Red BC correction zone to print a major confluence rejection at Black Point (B).
Following the defense of the WCL/BC cluster at 4,983.597, aggressive distribution pushed price below the Black (A) pivot, officially activating the Black Matryoshka sequence. Instead of chasing the breakdown, patience allowed the impulse to bottom out and retrace into the newly projected Black BC zone (4,412–4,650). Price has cleanly mitigated this correction pocket, offering an asymmetric limit entry aligned with higher-timeframe bearish continuation.
Structural invalidation is placed strictly above Black (B) at 4,983.597, where any breach immediately kills sequence context. Take Profit 1 targets the macro Red (C) zone at 3,000–3,450 to bank 75% of the position and move the stop loss to breakeven. The remaining 25% runner will ride through any intermediate retracements toward the extended Matryoshka Target (TP2) at 2,250–2,650. Short 
 Long
Long
GOLD - Correction and retest of the 4460 resistance levelICMARKETS:XAUUSD continues its rebound after the false breakdown of the 4,300 support level. The fundamental backdrop remains mixed, but selling pressure is still present
The dollar is stagnating, potentially due to intervention from the Bank of Japan. The correction in the Dollar Index is giving gold room to recover. The key event is Friday’s NFP report. A weak report could support a further recovery in gold, while a strong report could bring selling pressure back. The 4,460 level remains the nearest resistance, with 4,300 acting as support.
Drivers:
Upside: weak NFP data on Friday, further dollar weakness, lower yields, technical rebound.
Downside: strong NFP data, hawkish Fed rhetoric, stronger dollar, renewed rise in oil prices
Resistance levels: 4,466, 4,480
Support levels: 4,300
The long squeeze of the 4,300 support zone has triggered a rebound, which has developed into a stronger move amid the dollar correction.
Ahead lies the 4,466–4,480 resistance zone. A short squeeze in this area could trigger a downside pullback, potentially pushing gold back into the range ahead of the NFP release.
The retest of this resistance zone and the market’s reaction to it will help determine the medium-term direction
Best regards,
R. Linda. Short 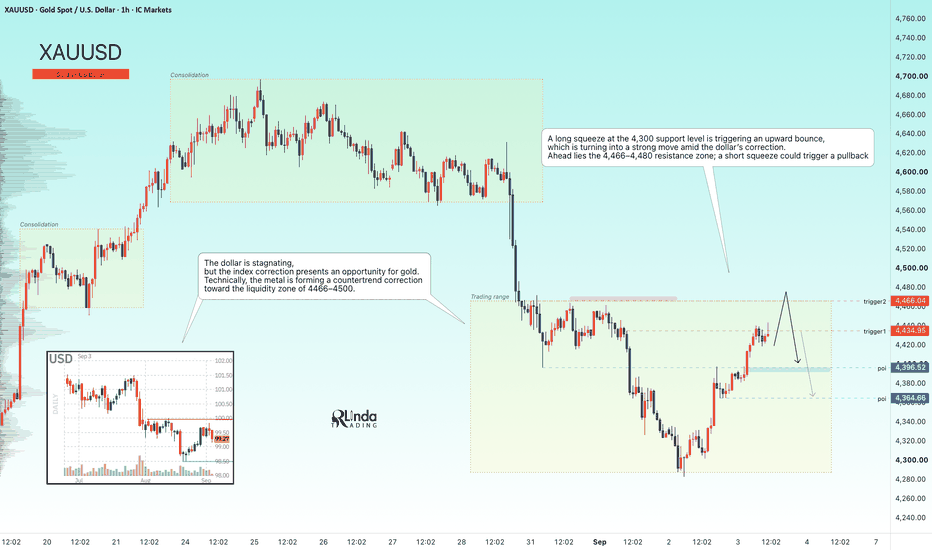
ETHUSDT - Consolidation ahead of a potential breakout and rallyBINANCE:ETHUSDT.P continues to consolidate after the strong rally, but at the moment, the market is once again testing resistance within yesterday’s rally...
Bitcoin is consolidating near the 83K resistance, which represents a technical retracement zone from the previous bearish cycle. A close above 83K could trigger a bullish impulse, providing additional support for the altcoin market.
From a broader perspective, Ethereum has not declined after the strong rally. A three-week consolidation is forming. At the same time, the retest of the 2,356 support ended with a bounce and a local rally, after which the market moved back into consolidation near resistance. This increases the probability of an upside breakout.
Today, all attention is focused on NFP. Weak data could strengthen the bullish trend, while hawkish signals could trigger a correction, in which case the market may continue consolidating.
Resistance levels: 2,550, 2,620, 2,790
Support levels: 2,450, 2,356
There are several possible scenarios. As part of a local pre-breakout consolidation, Ethereum could test 4,500 before moving higher. However, gradual compression toward resistance could trigger an upside breakout. A close above the level could become the technical catalyst for a move toward 2,620–2,790
Best regards,
R. Linda! Long 
BITCOIN - Consolidation Following Strong GrowthBINANCE:BTCUSDT.P , after a strong rally, has entered a consolidation phase near the resistance formed by the technical retracement of the previous bear cycle. What happens next?
Bitcoin previously broke the structure of its bearish trend, but it has still not tested the 83,000 technical retracement zone, which also represents a liquidity pool. Therefore, we can assume that this target remains relevant within the current local bullish trend.
After the strong rally, price has been consolidating for two weeks without forming a significant pullback. This can also be viewed as a bullish indication and a potential setup for further upside.
Technically, the market remains in consolidation. Price is showing a relatively weak reaction to the conflict escalation and has not declined despite the strong rally. A long squeeze of the 76,800–76,300 zone could develop before the move higher toward the 83K target.
The market remains bullish
Resistance levels: 79,500, 81,200, 83,000
Support levels: 76,800, 76,400, 75,600
A false breakdown of support as part of a liquidity-hunting phase, followed by consolidation above the 76,400–76,853 zone, could become a technical catalyst for further upside
Best regards,
R. Linda. Long