BTCUSDT 4H: Range Support Breakdown & Liquidity Sweep
1. Market Context
On the 4H chart, Bitcoin (BTC/USDT) has been consolidating inside a wide high-level range between 76,000.00 and 82,525.09 following its strong parabolic rally. After multiple rejections near the top resistance ceiling (around 82,000.00), price is rolling over toward the lower consolidation boundary at 76,562.95, setting up a high-probability range breakdown short plan.
2. Sentiment & House Trap Analysis
• Where Traders Place Orders: Retail buyers are opening BUY positions
Gann
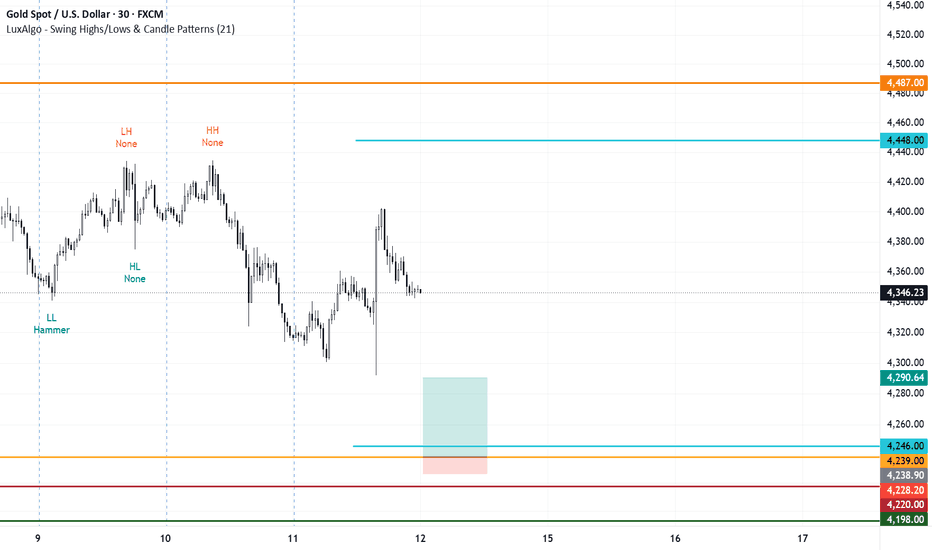
Pound vs Dollar - 30 minute chart - Action and reaction linesAfter all that decline, the market had trouble making new lows. It reached up to a previous range (blue lines) and started making swings to the upside.
This area is a buy zone for me.
There are 2 rectangles on the chart. The small one is a 15 pip stop, the big one is 25. They are examples of valid stops placed below previous lows.
The take profit is a minimum of 3:1.
US30 1H: Macro Bottom Liquidity Sweep & Range Reclaim1. Market Context
On the 1H chart, US30 (Dow Jones) experienced an aggressive markdown from above 53,700.0, dumping straight into the macro support base at 51,990.8. After executing a swift liquidity sweep beneath the bottom floor, price produced a strong V-shaped recovery and is currently consolidating near 52,374.1, preparing to break out above local resistance at 52,658.5.
2. Sentiment & House Trap Analysis
Where Traders Place Orders: Retail shorters jumped into late SELL positions during t
| USDCAD | FRGNT DAILY CHART ANALYSIS | DXY POI CONFLUENCE |📈 | Q3 | W38 | D14 | Y26
📊 | USDCAD | FRGNT DAILY CHART ANALYSIS | DXY POI CONFLUENCE |
💡 | DXY CONFLUENCE
This forecast is built using FRGNT X SMC — my advanced adaptation of Smart Money Concepts — applying a structured, disciplined approach to market analysis.
The process consists of:
🕰️ Identifying High Time Frame (HTF) Points of Interest (POIs)
📐 Defining a clear and controlled trading range
🔎 Refining opportunities on Lower Time Frames (LTFs)
✅ Waiting for confirmed Break of Structure (B
| DXY | FRGNT DAILY CHART ANALYSIS | POI CONFLUENCE |📈 | Q3 | W38 | D14 | Y26
📊 | DXY | FRGNT DAILY CHART ANALYSIS | POI CONFLUENCE |
💡 | WEEKLY OUTLOOK USED AS CONFLUENCE
This forecast is built using FRGNT X SMC — my advanced adaptation of Smart Money Concepts — applying a structured, disciplined approach to market analysis.
The process consists of:
🕰️ Identifying High Time Frame (HTF) Points of Interest (POIs)
📐 Defining a clear and controlled trading range
🔎 Refining opportunities on Lower Time Frames (LTFs)
✅ Waiting for confirmed Break of
Intersections from nodes are used for channel alignment.
See the image above for the chart with DWEB node trends turned on.
I use the intersections from these to build out added trends. The more the price respects these the more they are validated in the future.
The base layer of trends from the actual DWEB indicator is often my quick glance tool. However, there are times when a few more trends can be helpful for future trades. When you publish a chart it locks in your drawing and reveals an unbiased replay later on. It is great for testing an
The Gap Matters Less Than What Happens After ItOpening gaps are often treated as trading signals on their own. A large gap higher is considered bullish, while a gap that has not been filled is sometimes viewed as unfinished business that price will eventually need to revisit.
A more useful approach is to treat the gap as a repricing event and then watch whether the market accepts that repricing.
Suppose a stock closes at 100, strong earnings are released after the session, and the next morning it opens at 108. The eight-point gap tells you
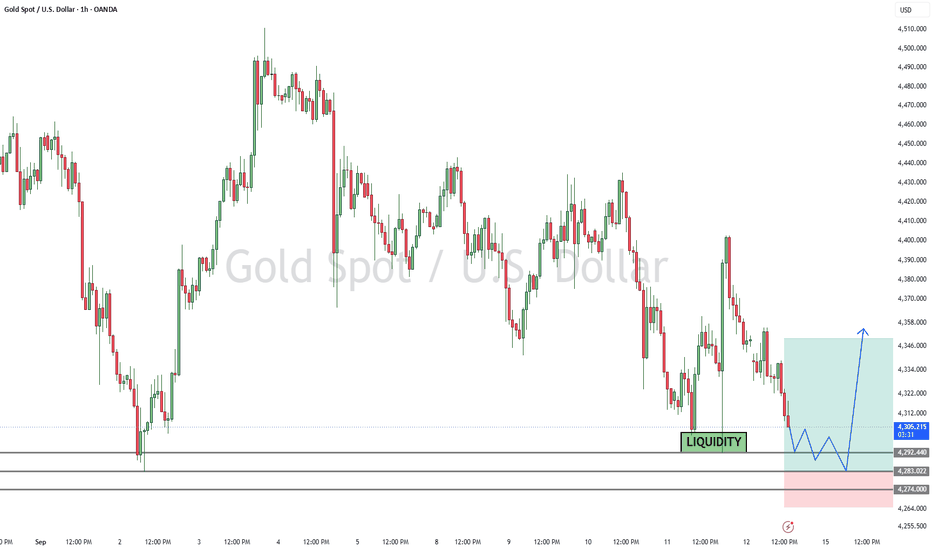
XAUUSD (Gold) – Bullish Support Bounce🟢 XAU/USD Buy Signal
Buy Zone: 4283 – 4273
Stop Loss: 4265
Take Profit 1: 4290
Take Profit 2: 4310
Take Profit 3: 4350
📚 Educational Market Idea:
Gold is approaching the 4283–4273 buy zone, which may act as a potential support area. Traders should wait for bullish confirmation, such as a strong rejection candle, bullish engulfing pattern, or a break above a nearby short-term resistance before entering.
If buyers defend the zone and price maintains bullish momentum, the move could target 4290
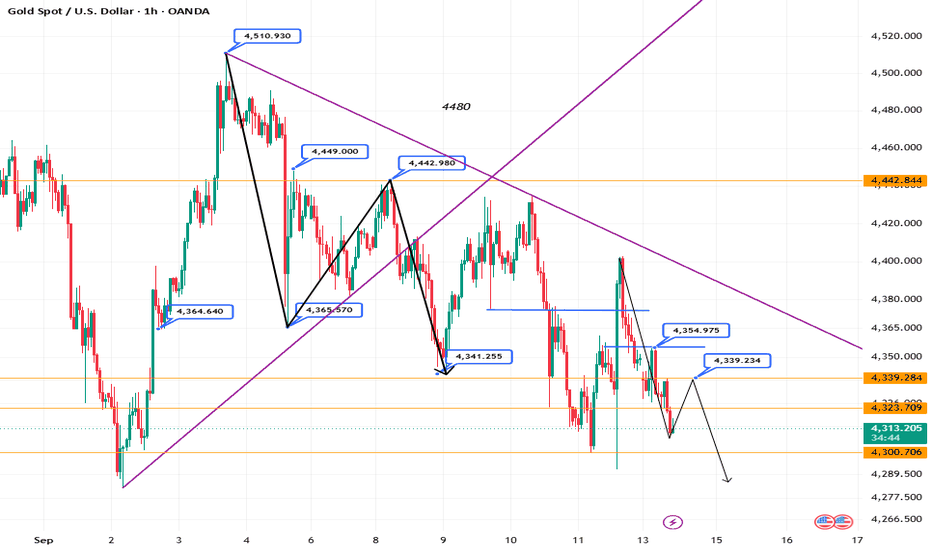
Gold prices will continue to fall.On the 4-hour chart, the market is seeing a tug-of-war between bulls and bears, with the rebound lacking strength. Key short-term support lies at $4,300, with strong support at $4,260; initial resistance is at $4,345, with strong resistance at $4,375. If the price stabilizes above $4,345, the potential for a short-term rebound opens up, targeting $4,375; conversely, if it falls back below $4,300, the bearish trend will resume, likely testing the $4,260 level. Strategy for the NY session: priorit
XAUUSD – Sideways Climb, Target 4,381🔶 XAUUSD – "FRESH WEEK SIDEWAY": NO "BOMB" NEWS TODAY, LEO HUNTS THE 4,303 DIP!
Leo | 14/09/2026 (Monday) – M15
🌍 REALTIME MACRO
Folks, fresh week, US economic calendar is empty today – no CPI, no NFP, no FOMC. But don't get complacent: FOMC rate decision this Wednesday (16/09) is the real "bomb." Market is split ~46% expecting 25bp hike, ~52% expecting hold – Leo leans toward Fed holding + less hawkish as inflation is cooling.
📌 Snapshot:
Gold spot: 4,316.91, session range 4,322 –
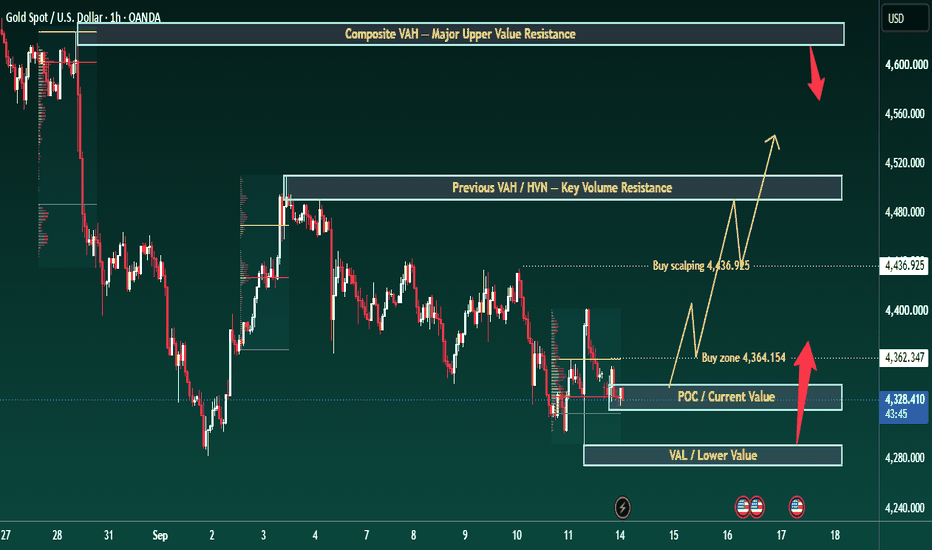
BRIAN XAUUSD – GOLD HOLDS VALUE, FED DECISION MAY TRIGGER THE BRIAN XAUUSD – GOLD HOLDS VALUE, FED DECISION MAY TRIGGER THE BREAK
Gold starts the new week under pressure around 4,330 - 4,340 after failing to build a strong recovery from last week’s lower value area.
The macro background is still heavy for gold. US inflation remained persistent in August, increasing the probability that the Fed may keep a tighter policy stance at the September meeting. With the Fed rate decision coming on Wednesday, the market is not likely to move cleanly without confirm
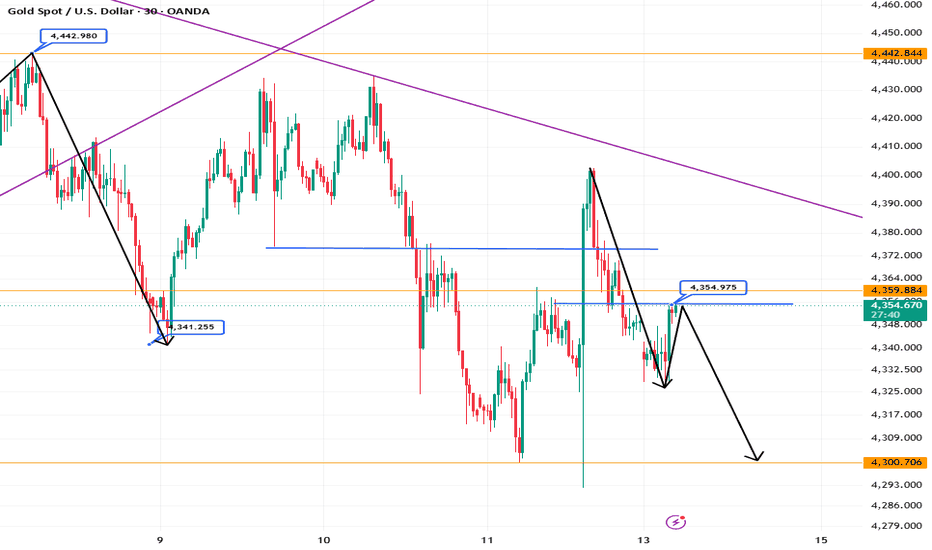
XAU/USD: Market Analysis and Strategy for September 14Last Friday, following the release of US CPI data, gold bottomed out at $4,294 and staged a strong rebound, surging to $4,402 before pulling back; it gained over $100 to close at $4,327. Looking at the trend over the past two weeks, gold has been in a fluctuating downtrend on the daily chart since peaking at $4,696 on August 15, having now fallen nearly $400. Weekly and monthly charts suggest the bearish trend will persist, with a high probability of the price dropping below $4,000.
On the dail
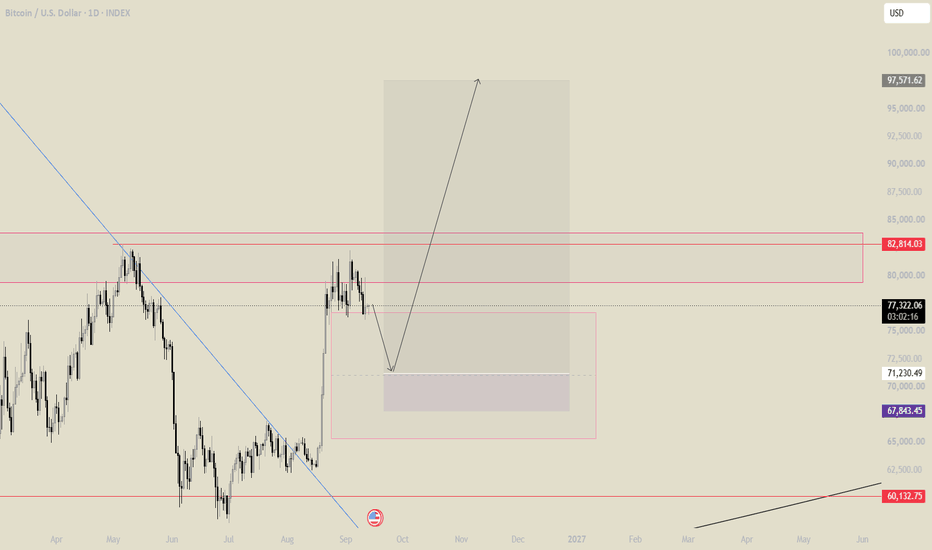
Bitcoin looking for longs Waiting for the CE of that weekly gap , and then there is daily low right below the daily gap too , so we might get the desired dip on wednesday during the fomc meeting , where rates are expected to go up for 75bps. I will enter a long position and try to bottom tick at that price range .
XAUUSD | Bullish Buy Zone | Long SetupXAUUSD is approaching a key demand zone where I’m looking for a potential long setup.
🔹 Buy Zone: 4240
🔹 Entry: After bullish confirmation
🔹 Stop Loss: Below the demand zone
🔹 Take Profit: 4290
The setup is based on price action and the reaction around this key demand area.
⚠️ This is my personal analysis and not financial advice. Always use proper risk management.
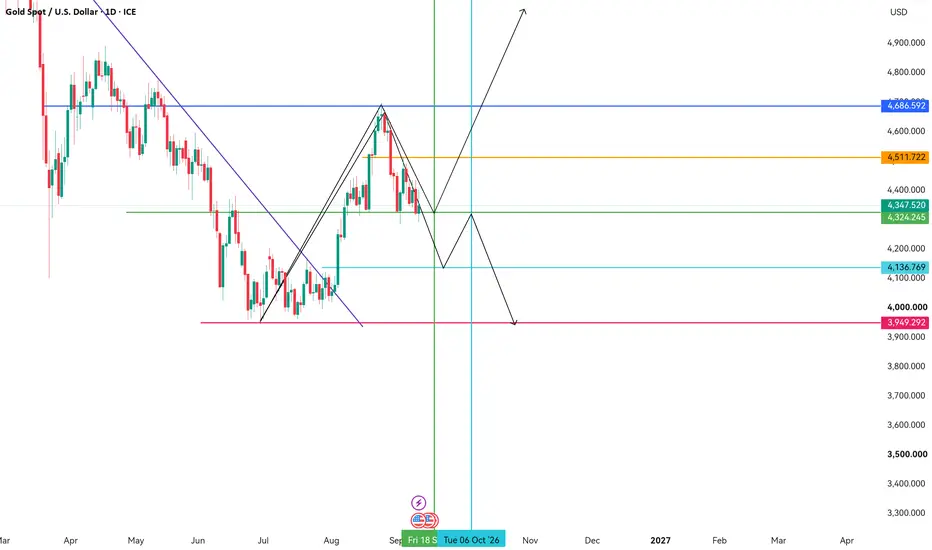
Gold Market Analysis UpdateIf the price manages to hold above 4,324 through the 18th, the current trend is likely to continue. Traders should remain cautious around the 18th, as this date could become a key turning point.
However, if the price fails to sustain the 4,324 level through the 18th, the next potential target could be 4,136. Pay close attention around the 6th, as a price reaction occurring around this date could potentially trigger a strong reversal.
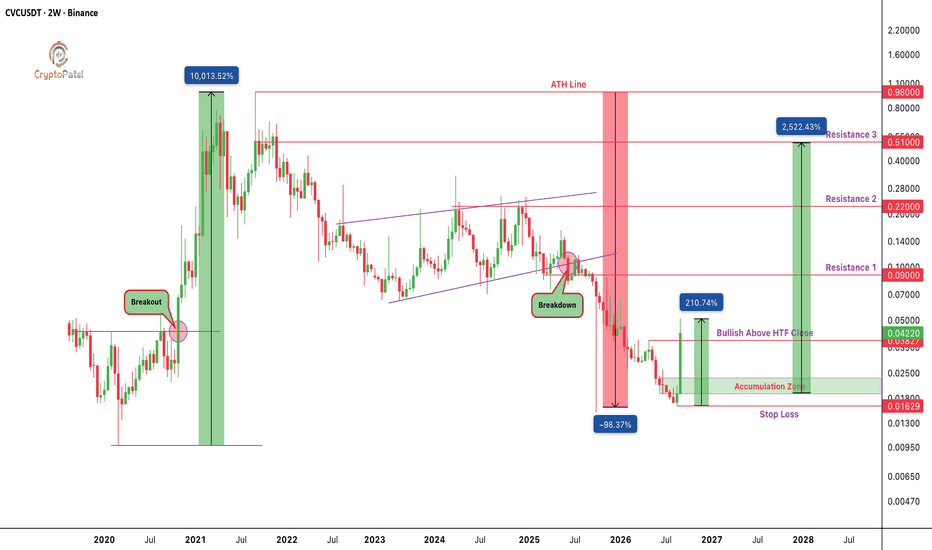
$CVC Up 210% in Just 4 Week So Still 10X Potential?EURONEXT:CVC DOWN NEAR 96% FROM ATH: IS THIS THE NEXT 2,000%+ CRYPTO REVERSAL SETUP?
#CVC Has Experienced A Multi-Year Bearish Cycle, With Prolonged Selling Pressure And Structural Weakness.
But After A Deep Correction, Price Is Now Showing Strong Recovery Momentum, Rising 210% In Just 4 Weeks. Is CVC Building Its Next Major Expansion?
TECHNICAL STRUCTURE
✅ Multi-Year Bearish Corrective Structure | 4-Week Rally: +210%
✅ Critical HTF Bullish Flip: $0.03827
✅ Potential Accumulation Zone: $0.024
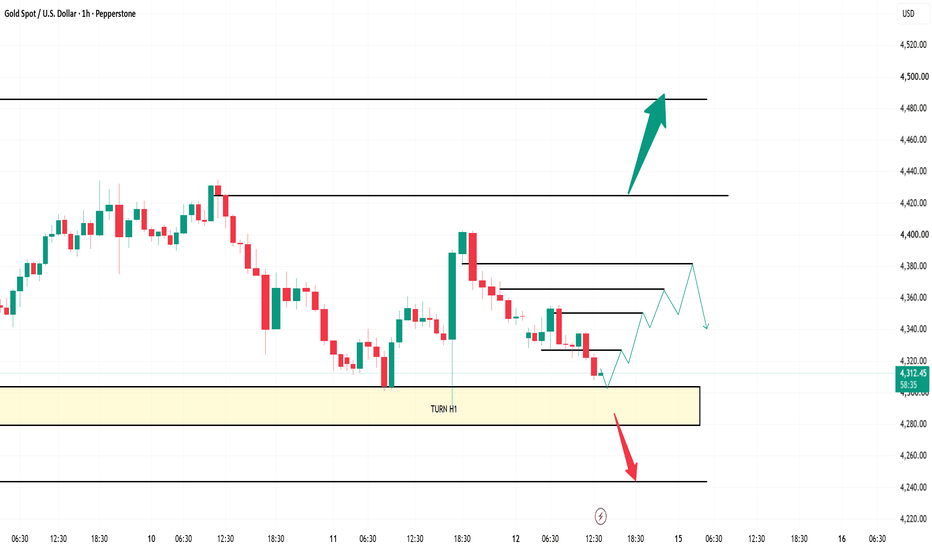
XAUUSD H1 – Gold Is Consolidating, Waiting for a BreakoutOn the H1 timeframe, Gold is currently moving within a clear consolidation structure following the previous bearish move.
Main Scenario
Price is moving between an important support area and resistance area.
If the support continues to hold, Gold may continue consolidating before making a decisive move.
The bullish scenario will become more attractive if price breaks above the resistance zone and confirms the breakout.
In this case, the next move could extend toward the higher liquidity area