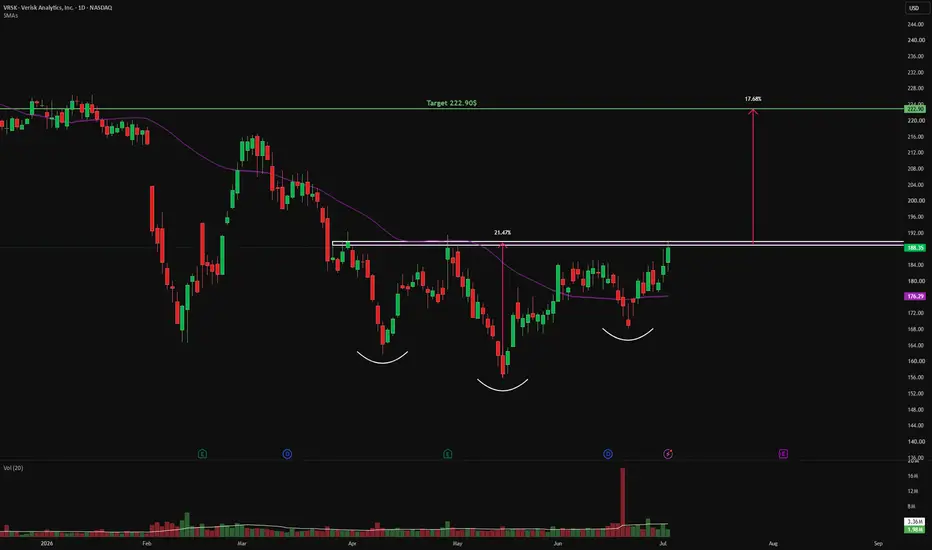
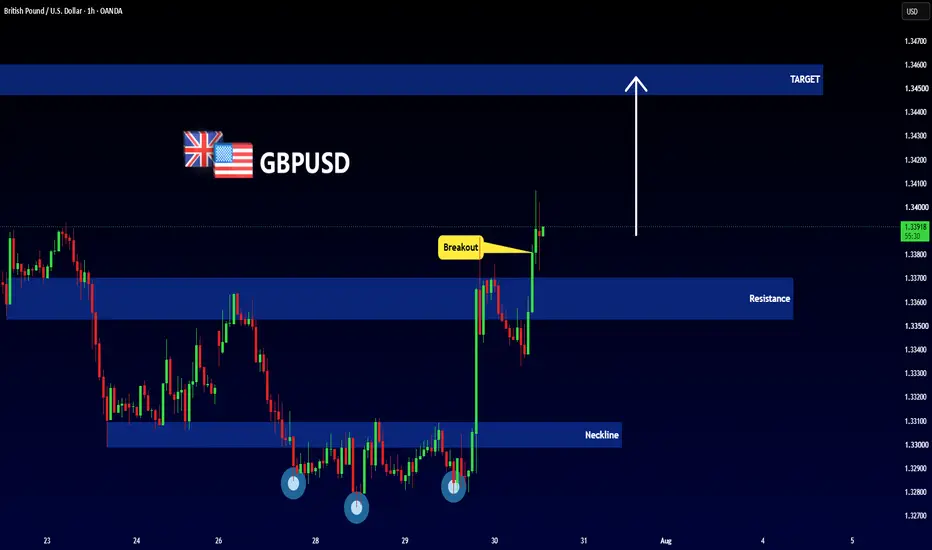
Head and Shoulders
Good time to Long SilverSilver peaked on January and has been going through correction for the past few months.
Pattern looks like an inverse head and shoulder to me. We've seen strong rebound early february when price touched 20 week SMA. Price retested the support on late march and it rebounded successfully. I don't think it'll create a lower low this time but even if it does, I think it's a safe time to invest.
Volume on the week it peaked was 1.23M while last week it was 210k. Rebound happens when people forget about the asset and no one trades or talks about it any more.
We've seen what silver is capable of. Price increased 300% in just 1 year. We're looking at the 1week chart so it'll be a long a patient investment.
MESM June 8: Bounce watch 7473, then 7533MESM analysis for Monday, June 8
MESM is trying to bounce after last week’s sell-off, and for me today is more of a station-by-station session than a day to be aggressively bullish or bearish.
On the 4H chart, I’m watching 7473 as the first bounce target. If bulls can keep pushing after that, then the next upside level for me is 7533.
On the downside, I’m still watching the overnight low / liquidity around 7355.
On the 1H chart, the structure remains similar, and 7386 is the key support level for me. If we get a 1H close below 7386, then I think price could continue lower toward 7355.
On the 15M chart, the same higher-time-frame levels are still in play, with 7473 and 7533 as the upside stations.
Key levels
7473 = first bounce target
7533 = second upside target
7386 = key support
7355 = downside liquidity
Plan for today
Stay patient and trade it station by station
Watch 7473 first on the bounce
If bulls stay strong, watch 7533 next
If price loses 7386, watch for downside toward 7355
Not financial advice. No confirmation, no trade. CME_MINI:MESM2026
AUDUSD: Strong Bearish Pattern 🇦🇺🇺🇸
AUDUSD broke and closed below a horizontal neckline
of a huge head & shoulders pattern on a daily time frame.
It turns into a strong resistance.
The price will likely drop lower after a pullback.
Next goal will be 0.7
❤️Please, support my work with like, thank you!❤️
I am part of Trade Nation's Influencer program and receive a monthly fee for using their TradingView charts in my analysis.
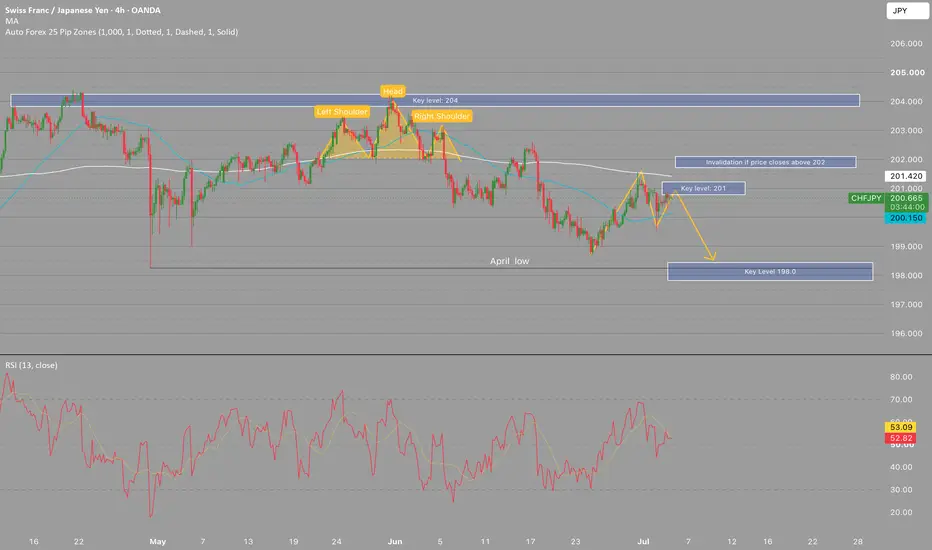
CHFJPYCHFJPY has formed a Head and Shoulders pattern on the 1-hour time frame, indicating a potential bearish continuation setup.
Based on the Fibonacci retracement levels, the price may revisit the Golden Zone around 202.074 before resuming its downward movement. This area could act as a key resistance zone for sellers to re-enter the market.
EURUSD Short: Bears Defend 1.1670 Resistance, Downside FavoredHello traders! Here’s my technical outlook based on the current EURUSD (4H) chart structure. EURUSD has been trading inside a broad descending channel after rejecting from multiple pivot points near the upper trendline resistance. Earlier, price formed an inverse head and shoulders pattern and rallied higher, but the recovery stalled near the 1.1670 supply zone, where sellers regained control.
Currently, EURUSD is trading below the 1.1670 supply zone while holding above the 1.1570 demand zone. Price recently attempted a breakout above the descending trendline but failed to sustain momentum, creating a fake breakout and confirming that resistance remains firmly in place.
As long as EURUSD remains below the 1.1670 supply zone and continues to respect the descending channel resistance, the bearish scenario remains valid. A continuation lower could push price toward the 1.1570 demand zone (TP1). Manage your risk!
Bitcoin at a Critical Crossroad: Bounce or Breakdown?This daily BTC/USD chart highlights one of the most important technical zones in the current market structure. Price has declined into a major confluence area where two key supports meet:
A long-term ascending trendline (black line)
Horizontal support around $53,500
At the same time, Bitcoin is trading below the 50-day Simple Moving Average (SMA 50) near $75,800, indicating medium-term weakness.
Market Structure Analysis
The blue zigzag pattern drawn on the chart illustrates a sequence of lower highs and lower lows, suggesting that the market has shifted from a strong bullish trend into a corrective phase.
The most important observation is that the latest selloff has reached the intersection of the long-term trendline and horizontal support. This area is likely to determine the next major directional move.
There are currently two primary scenarios.
Bullish Scenario: Support Holds
If buyers successfully defend the $53,500 region and daily candles begin closing above support, Bitcoin could stage a meaningful recovery.
Short-to-medium-term upside targets:
First target: $68,000
Second target: $75,800 (50-day SMA)
Third target: $82,000
A strong breakout above $82,000 would increase the probability of a move toward the $90,000–$95,000 zone.
Bearish Scenario: Support Breaks
If Bitcoin closes decisively below $53,500 on the daily timeframe, especially with increased selling volume, the bearish structure would strengthen significantly.
Potential downside targets:
$48,000
$42,000
$35,000
This aligns with the bearish projection shown by the red arrow on the chart.
Short-Term Outlook (Swing Trading)
For bullish traders, the preferred approach is to wait for confirmation that support is holding.
Potential long setup:
Entry after a clear bullish reversal signal near support
Stop-loss:
Below $52,000
Targets:
$68,000
$75,800
$82,000
For bearish traders:
Entry:
After a confirmed daily breakdown below $53,500
Stop-loss:
Above $57,000
Targets:
$48,000
$42,000
$35,000
Long-Term Outlook (Position Trading)
As long as the long-term ascending trendline remains intact, the broader bullish structure cannot be considered completely broken.
Long-Term Bullish Case
If the current support zone holds:
Targets:
$90,000
$110,000
$125,000–$130,000
Long-term stop-loss:
Weekly close below $50,000
Long-Term Bearish Case
If both the trendline and the $53,500 support are decisively broken:
Targets:
$42,000
$35,000
$30,000
Such a move would likely trigger a deeper multi-month correction and significantly damage the existing bullish market structure.
Professional Summary
The most critical level on this chart is $53,500. It represents the dividing line between a continuation of the long-term bullish trend and the beginning of a much deeper correction.
As long as this support remains intact, a recovery toward $68,000–$82,000 remains a realistic possibility. However, a confirmed breakdown below this zone could open the door to a decline toward $42,000–$35,000.
Bitcoin is currently sitting in a high-stakes decision zone, and its reaction around $53,500 is likely to determine the market direction for the coming weeks.
$AVAX Warning: Big Mountain Ranges = BIG Crevices!Why the MountainBears are Growling
The "Mountains of Avalanche" is looking shaky.
Avalanche by name.
Avalanche by nature?
While the bulls are trying to hold the line, the chart is printing a Head and Shoulders pattern that looks like a final warning for Q1 2026 before breakdown (maybe q2)
Negative Momentum: The MACD histogram on longer timeframes is showing weak momentum, and the RSI is hovering in a neutral-to-bearish zone near 38–42, suggesting sellers are slowly taking control.
Institutional Caution: Despite ETF rumors earlier in the month, the current market structure favors caution over aggressive long positions until major resistance at $16.55 is cleared.
Supply Hangover: A massive token unlock (9.5 million AVAX) is on the horizon, which could dump $240 million of fresh supply onto an already shaky market.
#AVAX #Avalanche #HeadAndShoulders #CryptoWarning #TechnicalAnalysis
XLE downtrend until june 19th 2026None of this is facts, it is all the creation of my brain, this is not financial advice, this is just me looking at numbers and creating stories that may or may not actually happen.
Thesis:
Trump wants to reduce the weight of the 39T debt, how? Can't pay it back so what then? Reduce the value of the debt!
How? By creating and maintaining higher inflation... so that the debt loses it's value.
Ok. What raises prices thus inflation? Tariffs and oil prices.
Ok tariffs done, mess up oil supply, Venezuela, Canada, Iran done.
Now how to control interest rate levels, be chummy with the FED.
Result, inflation is high while low or stable interest levels.
Low interest and high inflation = money needs to be invested as stocks rise with inflation while money loses value.
Huge inflow in the economy from people pulling money out of money markets... euphoric uptrend resumes, feeding into all the crazy IPOs until January... when things can violently turn around.
...
So, what does this mean for XLE? well... price drops = euphoric market as "fears" of interest rate hikes drop...
Technicals... well head and shoulder pattern detected... coinciding with the biggest IPO in history and the new fed chair going in... so this CANNOT go up or else the whole playbook dies and all hope goes in the drain.
XLE dropping = massive inflow into SPCX and markets... 15th June FED meeting confirms rate unchanged... euphoria once more.
June 19th ish... end of the downfall of oil... slow reversal as the markets realize the oil shortages... but still no fear yet as rates will remain unchanged...
then comes September/October... possible market drop again... Then Halloween effect then switch into Christmas rally...
Then if inflation is too high 6-7-8-9-10%+, the fed will have no choice but to start raising rates.
Retail traders will say... I SAW THIS BEFORE IN JUNE HA HA I WILL BUY THE DIP... and smart money will gladly sell their shares into retail strength...
I cannot see further than that but I could also be massively wrong and ignorant about element X or Y or Z which I cannot know or foresee in advance since I'm just a little peon in the game.
Could TRON #TRX 6X v #BITCOIN TRXBTC
has very good market structure
(higher high's , higher lows's)
for the past 3 years.
Overlooked , & under-appreciated it seems like, in my view on it's sentiment on Justin's success of network adoption.
We can see a clear Inverse head and shoulders
with a very key neckline level
that if broken with strength
could a indicate a run at the LOG target.
A disappointing TRX may only reach the linear target and not much beyond.
My TRXUSD chart which I am watching also does point to a stellar Bull market for TRX
TOTALES Head & Shoulders - The 2026 ResetThe Total Crypto Market Cap (excluding stables) is forming a massive multi-year
distribution pattern.
The "Head" peaked at roughly $3.3T, and the "Right Shoulder" is now tapering off at the $2.4T level.
The Critical Support (The Neckline): $1.77T.
This is the line in the sand.
If this breaks on a weekly close, there will be no denying from the people still holding out hope. That we are entering the final value wipeout phase of the 4 year cycle.
The Log Target: $781.05B.
This represents a potential ~56% drop from the neckline and a total wipeout of ~76% from the cycle peak.
If the TOTALES index hits that $781B floor, here is how the majors will likely re-price based on current May 2026 valuations:
BITCOIN Current price $80,093
likely approaches $45,000 – $48,000
Retesting the "Post-Halving" baseline.
BTC dominance likely spikes to 65%+ as capital flees #altcoins.
Ethereum (#ETH). currently at $2,246
likely price = $1,100 – $1,250ETH typically bleeds harder than BTC in total market collapses.
Expect a revisit of the 2022 lows.
Solana #SOL current price $91.07
likely bear bottom price $28 – $35
High-beta wipeout.
Solana would be the "Mahesh" of the top 10, losing significant ground in total cap.
Macro Catalysts for the Trigger Fed Transition Volatility: The market is pricing in uncertainty as Jerome Powell hands the reins to Kevin Warsh, whose hawkish stance could suck liquidity out of risk assets by mid-2026.
MSCI Exclusion: Fears of index funds being forced to sell companies with crypto holdings (Digital Asset Treasury) could create a massive "Sell-the-News" event for institutional-grade stocks, spilling over into the coins themselves.
The Aggressive Flip Opportunity
For the long term believer in this pace this isn't just a "bearish" outlook—it's a compounding roadmap:
Phase 1: Exit/Short if the $1.77T neckline fails.(even more aggressive traders will be shorting the right shoulder.)
Phase 2: Accumulate the "Generational Buy" at the $781B log target.
OIL INDIA: The Most Obvious Inverted Head & Shoulders ...YOU are ignoring.
🛢️🛢️🛢️🛢️🛢️🛢️
While everyone is obsessed (for right now) by the Middle East military operation, Oil India has quietly carved out a textbook Inverted Head & Shoulders pattern.
The neckline is currently being tested at ₹492, and the volume profile shows massive institutional accumulation during the "right shoulder" formation.
This isn't just a trade; it's a structural shift in the energy sector that’s ready to explode.
A breakout above ₹492 triggers a massive technical move toward ₹540 and eventually ₹600.
With a ₹73,015 crore order book in the sector and crude prices on a tear, this "Maharatna" is undervalued and over-ready. Is ₹600 a dream or a destination for OIL? Let me know your target!
( I can see even larger valutaions)
🚀 🚀 🚀 🚀 🚀
TRENT: The Bear-to-Bull Pivot🏬 🏬 🏬
The TRENT reversal is taking shape, and the structure is textbook. We aren’t guessing; we’re playing the pattern.
The Setup:
The Inverse Head and Shoulders has formed. Entries here represent an incredibly high reward-to-risk ratio.
The Entry: We are playing the consolidation near the neckline/right shoulder.
The Risk Management: The stop is non-negotiable—it sits under the right shoulder. If we break below that, the "bullish reversal" thesis is invalidated, and the pattern has failed.
Respect the stop.
The Target: The depth of the head dictates the potential move. The targets speak for themselves; let the price discovery play out.
5 Reasons Why TRENT is Shifting from Bear to Bull:
Inverse H&S Confirmation: The formation of a higher low at the right shoulder confirms that the selling pressure has been absorbed.
Volume Participation: —Look for a contraction in volume during the formation of the right shoulder, followed by an expansion upon the breakout.
Moving Average Support: The price is consolidating above , shifting the long-term trend bias from distribution to accumulation.
Relative Strength (RS): Compared to the broader index, TRENT has stopped making new relative lows, signalling that institutional buying is stepping in to support the floor.
Momentum Shift: Oscillators (like the RSI) are showing a bullish divergence at the right shoulder, indicating that while the price was grinding lower, the selling momentum was already drying up.
5 Fundamental Pillars: Why TRENT is a Structural Compounder
1.) Zudio’s "Value-Fashion" Moat
Zudio has effectively cracked the code of the Indian mass market by offering trendy, fast-fashion apparel at accessible price points.
Its FOCO (Franchise-Owned, Company-Operated) model allows Trent to scale aggressively without tying up massive capital in real estate, while maintaining tight control over store operations and the customer experience.
2.) Unmatched Operational Efficiency
Trent’s ability to keep margins resilient—even while expanding rapidly—is driven by its bulk manufacturing and private-label-only strategy.
By owning the entire supply chain and avoiding the margin-diluting discount cycles common in retail, they maintain superior inventory turnover and high Return on Capital Employed (ROCE).
3.) Data-Driven Tier-2/Tier-3 Penetration
Trent is no longer just a "big city" retailer. By leveraging AI-backed location analytics and micro-market data, they are strategically targeting smaller towns where consumption is shifting from unorganised to organised retail.
This "deep-farming" of existing regional markets significantly reduces the risk of expansion.
4.) Multi-Format Synergy
The portfolio is perfectly balanced between Westside (mid-premium/lifestyle focus) and Zudio (value-fashion focus).
This allows Trent to capture the entire spectrum of the Indian consumer’s wallet as they move up the income ladder, creating high brand stickiness and lifetime value.
5.) Execution-Led Revenue Momentum
Trent consistently delivers 17–20% year-on-year revenue growth, fuelled by both same-store sales growth (LFL) and a relentless pace of new store additions.
In a market often plagued by consumption uncertainty, Trent’s ability to sustain double-digit top-line growth is a testament to the brand's resilience and structural market demand.
#BreakoutAlert #TechnicalAnalysis #ValueInvesting #IndiaGrowth #StockMarketIndia
BTC: Technical Reversal Meets Fundamental Vacuum.₿
The Chart vs. The Narrative:
We are seeing a classic technical setup here, but the broader picture remains fundamentally broken. Look past the price action—where is the structural demand that was promised to us for 18 years?
The 3 Fundamental Cracks:
No Central Bank Accumulation: Unlike gold, central banks have consistently ignored BTC as a reserve asset. There is zero evidence of the "sovereign adoption" we were sold.
Trade Settlement Reality: After nearly two decades, BTC has failed to become a meaningful instrument for international trade settlement or central bank swap lines. It remains a high-friction asset in a world demanding low-friction solutions.
Government Distribution: Instead of institutional accumulation, we are seeing the opposite: governments are increasingly positioned as distributors, clearing out seized assets and increasing supply pressure.
The Bull Case (The "Crisis" Tail Risk):
Unless we see a systemic sovereign debt crisis or a total collapse of faith in the current monetary framework, the bull case for Bitcoin is effectively priced out. We are essentially betting on a "broken" global financial system rather than a "better" new technology.
The Strategy:
I am trading the technicals, not the revolution. The chart shows a potential reversal, but I am under no illusions about the long-term fundamental vacuum. I am playing the probability of a technical move, but I am keeping my stop-losses tight.
The Lesson:
Don't mistake speculation for adoption. If you are holding because you believe the PR campaign from 2013, 2017, or 2021 you are ignoring the data of 2026.
#Bitcoin #BTC #MarketMechanics #FundamentalAnalysis #TradingReality #Crypto
Liquidity Dreams and Reality Bites: Why the Banana Zone..was just a marketing ploy.
The Narrative vs. The Chart:
We’ve been sold a story.
For years, the "Banana Zone" has been peddled as an inevitable, macro-driven surge fuelled by global M2 liquidity.
It’s a compelling story—it’s easy to understand, it justifies high-risk allocation, and it keeps capital locked in the ecosystem during the long, painful sideways grinds.
The Savage Reality:The charts tell a different story.
While the "macro-bros" are waiting for the fuelled parabolic move to save their bags, the actual price action in high-beta assets like SUI shows something else entirely: Distribution.
The 3 Pillars of the "Banana Zone"
Myth:Liquidity does not = $ Price:
Liquidity is a necessary condition for speculative growth, but it is not a sufficient one.
Relying on M2 alone ignores structural failures in adoption, developer flight, and the massive overhang of unlocked supply waiting to hit the market.
Branding as Alpha: Framing a cycle as a "Banana Zone" is brilliant marketing.
It creates a psychological trap that keeps you holding through a 50% drawdown because you’re waiting for a vertical line that may never come.
The Macro-God Complex: When you try to boil the entire global economy down to a single "Everything Code," you lose the ability to see the technical reality right in front of you.
My Take: Look at the chart.
We aren't in a "pre-parabolic accumulation phase." We are seeing technical exhaustion.
I’m trading the price action, not the macro-fable.
If the "Banana Zone" were real, we wouldn't need to be sold on it by influencers every single week.
The Lesson:Don't let a catchy name keep you from seeing a structural top.
If the macro thesis doesn't manifest as technical strength, the thesis is just a story.
And stories don't pay the bills.
#BananaZone #RaoulPal #MacroThesis #SUI #CryptoReality #TradingView #MarketMechanics
Long Dimon, Short Corn: $XLF vs. $BTC🏛️🏛️🏛️🏛️🏛️
🌽🌽🌽🌽🌽
Banks make profits
Banks can innovate and adopt new technologies
Bitcoin core devs can't.
Goal: Capture the capital flight from the meme of decentralised money and the central bank disruptor, back to the money centers of the US empire.
I believe a retest of December 2017 is on deck.
#XLF #BTC #Bitcoin #Corn #MacroTrade
CNXMEDIA is on radar... keep focus...*********************************************************************
Disclaimer (Please Read Carefully):
This is not investment advice. The stocks shared here are purely for educational and informational purposes. Please do your own research or consult with a financial advisor before making any investment decisions.
The stock market involves risk, risk, and only risk. To survive in the market, accepting stop-loss with discipline and without hesitation. There is no other way to protect you capital.
Any stock I share is either already part of my existing holding or I take a fresh entry at the same level I mention. I always place the stop-loss in my system at the time of buying, and I give the highest importance to stop-loss more than the target. Once the target is achieved, I usually book profit once and then wait for either a retest or a fresh breakout.
I buy only on breakouts, never on supports. I also do not sell at resistance levels.
That is simply my trading style.
GREAVESCOTGREAVESCOT has given inverted H&S pattern with strong volume. Base line support seems near 175. So as long as it is closing above 175 the trend should continue. Pattern target is near 260 which is approx 35% from current level. Seems too strong to miss!! Risk reward is quite in favor. Classical book style pattern!
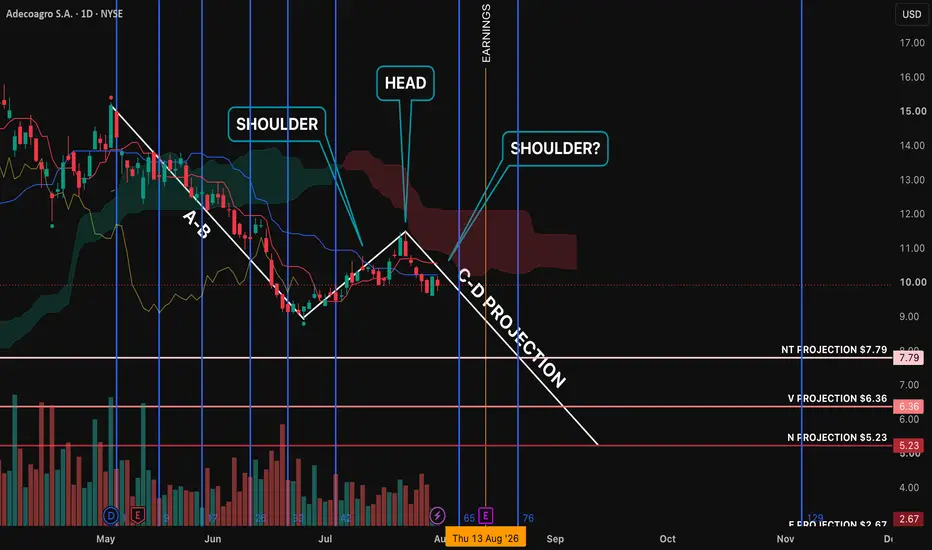
$VVV Top Confirmed with Bearish Engulfing + H&SNYSE:VVV TOP IS IN 💯
NASTY BEARISH ENGULFING Daily Close confirms Head & Shoulders reversal pattern (w/ a fake-out from upthrust).
PA responds with a dead-cat bounce into the bull flag (one last trap).
This will take a lot of time for the market to digest.
Should see a proper retest of the 50% gann level to decide next move.
Doubt that will hold with current macro market conditions coming online.
Would steer clear til ~$8-9 which is around the .618 Fib.
Better value buy sits ~$5 at the .786 fib
LOWER 📉