ARB BULL MARKET IDEADear followers,
Arbitrum had a great push last week and finally broke the bearish market structure on the 3D chart.
Entry zone: $0.16 to $0.10 โ I scale in, no need to go all at once.
Invalidation: a 3D close below $0.07. As long as that holds, the structure break stays valid.
Target: $1.16, the level where the whole bearish leg started.
Risk 1 to make more than 10. This is a swing trade with a 12-18 month horizon, so no need to rush it. It will take time to deliver.
Of course this is not fi
Ichimoku Cloud
Mid-Term Bitcoin Update: Bearish Momentum, Key Supports, and RevYou are looking at the historical weekly chart of Bitcoin .
After touching the ceiling of the historical channel (green), Bitcoin entered a correction and price decline. Its most important support was the floor of the ascending channel (yellow), which it lost. For this reason, its price decline gained more momentum.
Currently, it is declining inside the pink descending channel until one of these two scenarios happens:
It reaches the midline of the historical channel (around $38k to $40k) withi
Flat Ichimoku Levels: What They Are and Why They MatterFlat Ichimoku levels are horizontal areas created by flat segments of the Ichimoku lines. They bring structure to the chart by revealing equilibrium zones around which a trading hypothesis can be built.
1. What Is a Flat Ichimoku Level?
A flat Ichimoku level is an equilibrium level created when the midpoint used by an Ichimoku line remains unchanged. On the chart, it appears as a horizontal segment on one of the Ichimoku lines, such as the Tenkan-sen, Kijun-sen, Senkou Span A, or Senkou Span
EURUSD: EUR Reaches a โDecision ZoneโOn the H4 timeframe, EURUSD is entering a crucial technical zone. After a recovery from the bottom around 1.1580, the price has approached the 1.1660โ1.1676 area โ the convergence point of the medium-term downtrend line, the Ichimoku cloud, and the supply zone that has repeatedly pushed the market downwards before.
Notably, although buyers have tried to push the price up quite strongly in the last two sessions, the upward momentum has slowed down significantly upon reaching the resistance zone.
May 26 2026 Daily Insight We are currently at a neutral market state in all the pairs specially since DXY is trying its best to clarify which way the sentiment wants to move. But I tried to depict in how market is trying to behave so that we can wait for sniping options in the making.
I will update you on which pairs we should focus for an entry on today's market once NY session have its say.
Bullish Cup Formation with Ichimoku Breakout and ContinuationThe chart shows a transition from a previous bearish phase into a strong bullish recovery, forming a clear rounded cup structure that signals accumulation and trend reversal. Price initially declined sharply, creating a smooth curved bottom, which indicates weakening selling pressure and gradual buyer dominance.
Currently, price has broken above the Ichimoku Cloud, confirming a bullish shift in market sentiment. The cloud is starting to turn supportive, suggesting continuation rather than a sho
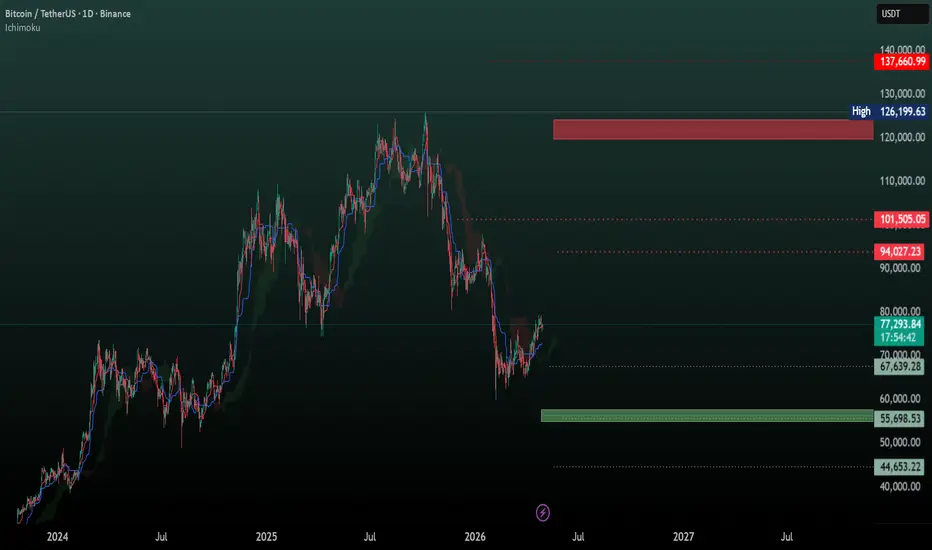
BTC DailyBased on last year's analysis Bitcoin has reached a resistance zone and has entered a correction phase
right now these two levels represent the most important support and resistance areas in the market:
Support zone: 55,600
Resistance zone: 120,000
All the mentioned levels are key zones for Bitcoin, and we trade based on them.
Based on the Ichimoku analysis, Bitcoin is trying to move toward the 94,000 resistance level.
The analysis will be updated after a breakout from any of the mentioned
Bitcoin in the cusp of BreakoutBitcoin today has rallied off a consolidation to the cusp of a breakout. Price is bullish versus the Daily Ichimoku cloud which is Step 1 in a breakout. For years I have watched the Daily Ichimoku Cloud breakout as one of the most reliable indicators of Bitcoin trends.
If price can make the Chikou (Lagging Span) close above the key level of 79022, which is also a Volume Profile node, then the bullish breakout will be confirmed.
March 2022:
The pattern of this Bitcoin bear cycle has been ee
Accumulation Phase Leads to Bullish ExpansionThe chart illustrates a clear shift from a prolonged bearish trend into a consolidation phase, followed by a strong bullish breakout. Initially, price moved within a well-defined descending channel, confirming sustained selling pressure. After reaching a key demand zone, the market formed a sideways accumulation range, indicating absorption of selling liquidity and building bullish strength.
Price has now decisively broken above the range and the Ichimoku Cloud, signaling a strong change in mar
Understanding the Bermuda Pattern: A Simple Guide for TradersIn technical analysis ๐๐, some patterns have names that perfectly capture their essence ๐ท๏ธโจ. The Bermuda Pattern ๐ is one of them 1๏ธโฃโ
. Just as its mysterious namesake ๐บ๏ธโ is known for its powerful pull ๐งฒ๐ช, this chart pattern ๐ signals a powerful ability to "attract" price ๐งฒ๐ฐ. Understanding this pull ๐ก๐งฒ is key to anticipating ๐๏ธ๐ฎ major market corrections ๐๐๏ธ before they happen โฐโก๏ธ๐. This guide will simply explain โ
what this pattern is ๐, what it signals ๐ก to a trader ๐จโ๐ผ, and how you can begin
Your All-in-One Trading SystemIntroduction: More Than Just an Indicator ๐๐ซ๐
As a new trader ๐ฑ, you might look at a busy chart ๐๐คฏ and ask, "Is Ichimoku enough to trade with on its own?" โ๐ค
Let me be direct โก๏ธ: the answer is an unequivocal yes โ
๐ฏ. Ichimoku โ๏ธ is not just an indicator ๐ซ๐; it is a complete trading system ๐ฏ๐งฉ, designed to make you independent ๐ of countless other indicators and methods ๐โ.
Think of it this way ๐ก๐ง : every line and cloud ๐โ๏ธ in the Ichimoku system works together ๐ค to give you a full picture of the ma
Understanding the Icicle Pattern: A Guide to Trend Trading1. Introduction: What is the Icicle Pattern? ๐งโ
Welcome to the world of technical analysis ๐๐! Learning to read charts can feel complex ๐คฏ, but it's really about recognizing specific patterns ๐๐งฉ that give you clues about market behavior ๐ต๏ธ๐. One such powerful pattern ๐ช๐ง is the Icicle pattern โ๏ธ.
Think of it as a specific shape โ๏ธ on a trading chart that helps you understand market corrections ๐๐ (temporary price movements against the main trend โฌ
๏ธ๐). Its primary purpose ๐ฏ is to signal that the ma
Identifying Valid Market Corrections Introduction: Navigating the Unknown ๐งญ๐บ๏ธโ
One of the most common challenges โ ๏ธ traders face is when an asset ๐, like a stock ๐ or cryptocurrency ๐ช, breaks into a new all-time high ๐๐. Suddenly, there is no past price data ๐ซ๐ to guide your analysis ๐. In these uncharted territories ๐บ๏ธโ, you can feel lost ๐ฐ, as if navigating a void without a map ๐๐ซ๐งญ. This feeling is normal โ
, but it's also where professional traders ๐จโ๐ผ๐ฉโ๐ผ learn to see patterns others miss ๐๏ธ๐โจ.
Even without historical reference p
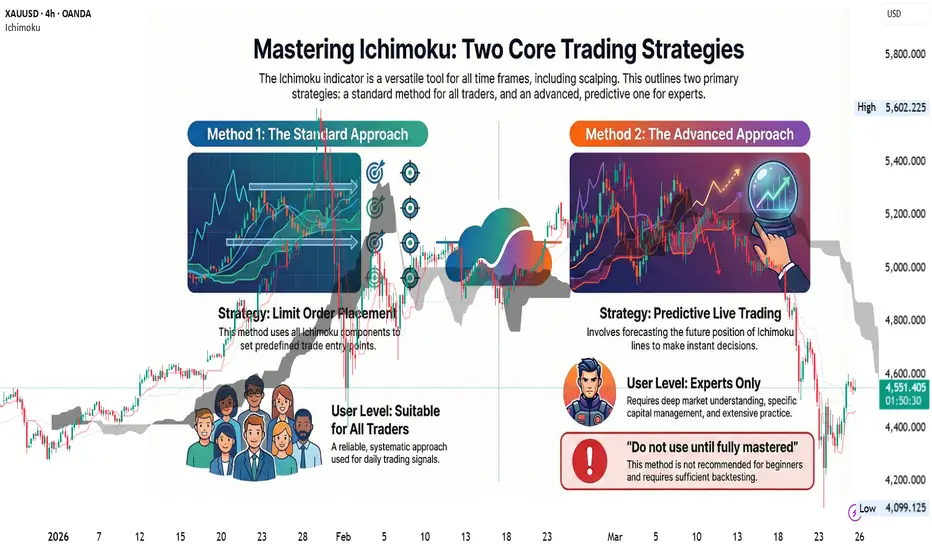
The Two Core Approaches to Trading With Ichimoku1. Introduction: The Versatility of Ichimoku ๐๐
As a novice trader ๐ฑ, you might wonder about the flexibility ๐ค of complex tools like the Ichimoku system โ๏ธ. A common question is whether it is effective across all timeframes โฑ๏ธ๐, from long-term charts ๐๐๏ธ down to very short-term strategies โก like scalping ๐โโ๏ธ๐จ. The short answer is yes โ
, it absolutely is ๐ฏ.
The key to its versatility ๐๏ธ๐ lies not just in the system itself โ๏ธ, but in how a trader applies it ๐ง ๐ฏ. There are two primary methods 2๏ธโฃ๐ ๏ธ
Reading Market Trends with Ichimoku๐ฏ Introduction: Your Quick Guide to Trend Spotting ๐๐๏ธ
For new traders, the complex charts of the Ichimoku system โ๏ธ can be intimidating ๐ฐ. This guide simplifies the noise ๐โจ by teaching you a powerful method ๐ช to read market trends ๐ using just three key lines 3๏ธโฃ๐, providing a solid foundation ๐๏ธ for your analysis ๐.
Our focus will be on the three primary trend indicators ๐ฏ: the Tenkan-sen โก, the Kijun-sen โ๏ธ, and Span B ๐๏ธ.
1. The Three Lines and Their Timeframes โฑ๏ธ๐
The Ichimoku system uses
Why Ichimoku Works Everywhere1. The Big Question for Every New Trader ๐คโ
One of the first questions every new trader asks is, "Will the system I'm learning work in all markets, like stocks, forex, and crypto?" ๐๐ฑ๐ช It's a critical concern โ ๏ธ. You want to know if the time you invest โฐ๐ช in learning a tool will pay off ๐ฐ across different opportunities ๐ฏ and time frames โฑ๏ธ.
For the Ichimoku system โ๏ธ, the answer is a definitive yes โ
๐.
This guide will explain the single, fundamental reason 1๏ธโฃ๐ก why Ichimoku is a universal tool ๐
Setting Take-Profit Levels with the IchimokuIntroduction: A Smarter Way to Set Profit Targets ๐ง โจ
Every trader, from novice ๐ฑ to expert ๐, faces the same critical challenge: knowing the right moment to exit โฐ๐ช a trade and secure profits ๐ฐ๐. A common approach is to use a fixed risk-to-reward ratio ๐, such as 1:2 or 1:3 ๐ฏ, to set a profit target. While simple โ
, this method can be arbitrary ๐ค and disconnected from the market's actual structure ๐ซ๐๏ธ.
The Ichimoku indicator โ๏ธ offers a more dynamic and market-aware solution ๐๐ก. Instead of relyi
Maximize Your Profit: Existing Trades with Ichimoku 1. The Trader's Big Question: "When Should I Exit?" ๐ชโ
One of the most frequent and critical questions a trader faces is, "How long should I hold my open trade?" โฐ๐ญ This question gets to the heart of maximizing potential profit ๐ฐ๐. The art of managing open trades is a complex skill with roots in three key areas: psychology ๐ง , capital management ๐ต, and technical analysis ๐. While mastering all three is essential ๐, this guide will focus on the technical solution ๐ ๏ธ. For this purpose, the Ichimok
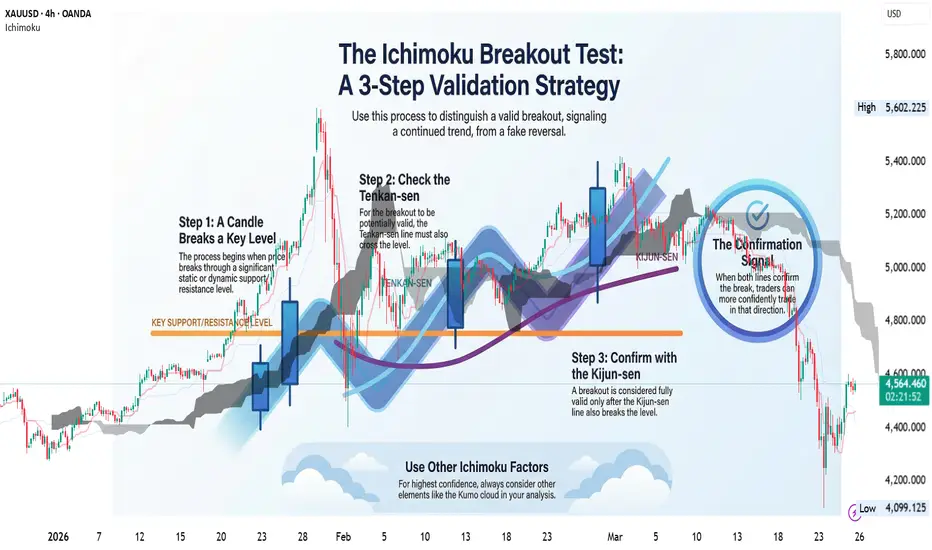
Spotting Real vs. Fake Breakouts๐ฏ 1. The Big Question: Is This Breakout Real? โ
Welcome to the world of trading! ๐๐ As you begin analyzing charts ๐, one of the most common and critical events you'll encounter is a breakout โ a moment when the price moves decisively through a key level of support or resistance ๐ช๐ฅ. The challenge is that not all breakouts are created equal โ ๏ธ.
Understanding the difference between a real move โ
and a false one โ is fundamental to making sound decisions ๐ง ๐ฏ.
โข Valid Breakout: โ
This is a real move.
Advanced Signals From Cloud, Kijun-sen and Divergence1. Introduction: Your Guide to the Ichimoku System ๐
This guide will simplify key concepts ๐, focusing primarily on the Kumo (the 'cloud') โ๏ธ and its relationship with price ๐ฐ, including a specific breakout technique involving the Kijun-sen (a key baseline) ๐. We will explore how to interpret the relationship between the price and the cloud, spot potential trend reversals ๐, and identify valid breakouts from a consolidation phase ๐ฆโก๏ธ๐.
While these techniques are powerful on their own ๐ช, they are
The Hidden Cloud in IchimokuIntroduction: Beyond the Main Cloud ๐
Every trader who uses the Ichimoku system knows the Kumoโthe main cloud that defines support and resistance ๐. But one of the secrets ๐คซ of experienced Ichimoku practitioners is that there's a second, hidden cloud they watch just as closely ๐. It's a commonly overlooked tool that offers an immediate read on market momentum โก.
This concept is known as Kumosen ๐ฏ. This article breaks down exactly what Kumosen is and how to use it to visually gauge the strength b
L-Pattern: A Simple Secret for New Traders๐ Meet the L-Pattern ๐
It's one of the simplest yet most effective patterns within the powerful Ichimoku system ๐. Its straightforward appearance and clear rules make it the perfect starting point for anyone new to trading ๐ฏ. Think of it as your first key ๐๏ธ to unlocking the insights Ichimoku has to offer.
Let's dive into what this pattern looks like and where to find it on your chart ๐.
What Exactly is the L-Pattern? โ
The L-Pattern is named for its most obvious characteristic: its shape ๐ค. To
Understanding the Ichimoku Quality Line 2If you're just starting ๐ฑ, it can feel like learning a new language ๐ฃ๏ธ. This guide is here to help by focusing on one specific, powerful tool ๐ง: the Ichimoku Quality Line.
The Quality Line is a component of the broader Ichimoku system. Think of it as a specialized instrument ๐๏ธ designed to help you spot potential changes in market trends with greater clarity ๐. Our goal here is to break down the three most important rules you need to know to start interpreting its signals effectively.
Before we