Short
Short
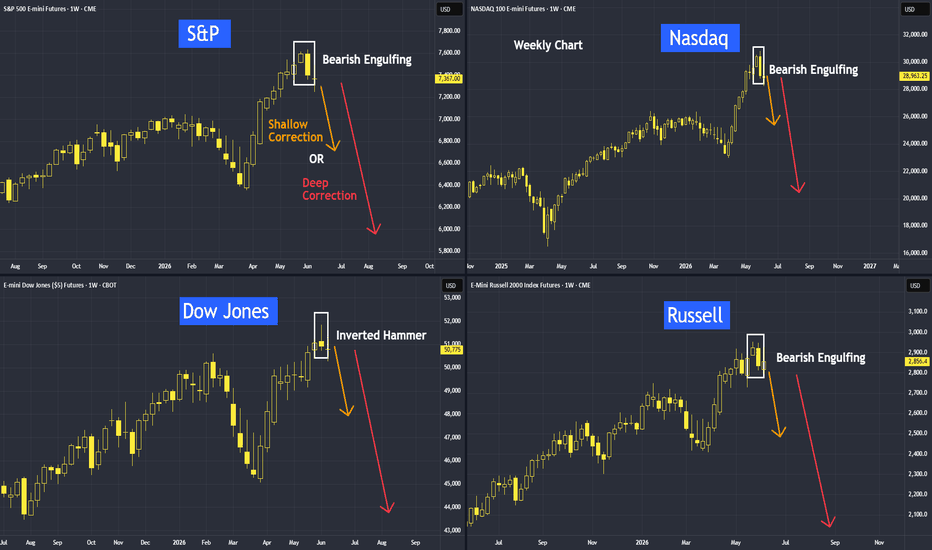
Will US Reversals Hold?As of last week's close, all major US indices completed their weekly movements, and all of them indicated a reversal pattern.
S&P 500, Nasdaq, and Russell 2000 all formed a bearish engulfing pattern, while the Dow Jones formed an inverted hammer.
So, is a correction coming?
Based on these technical studies, a correction appears to be developing.
We will discuss how to manage these risks and whether this correction will be shallow or deep.
Micro E-mini S&P 500 Index Futures & Options
Code: MES
Minimum fluctuation
0.25 index points = $1.25
Disclaimer:
• What presented here is not a recommendation, please consult your licensed broker.
• Our mission is to create lateral thinking skills for every investor and trader, knowing when to take a calculated risk with market uncertainty and a bolder risk when opportunity arises.
CME Real-time Market Data help identify trading set-ups in real-time and express my market views. If you have futures in your trading portfolio, you can check out on CME Group data plans available that suit your trading needs www.tradingview.com
 Short
Short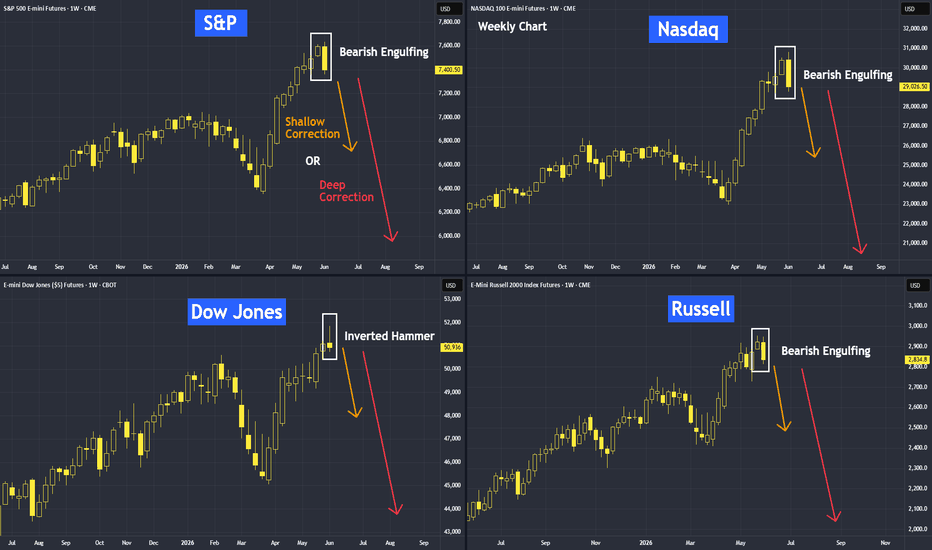
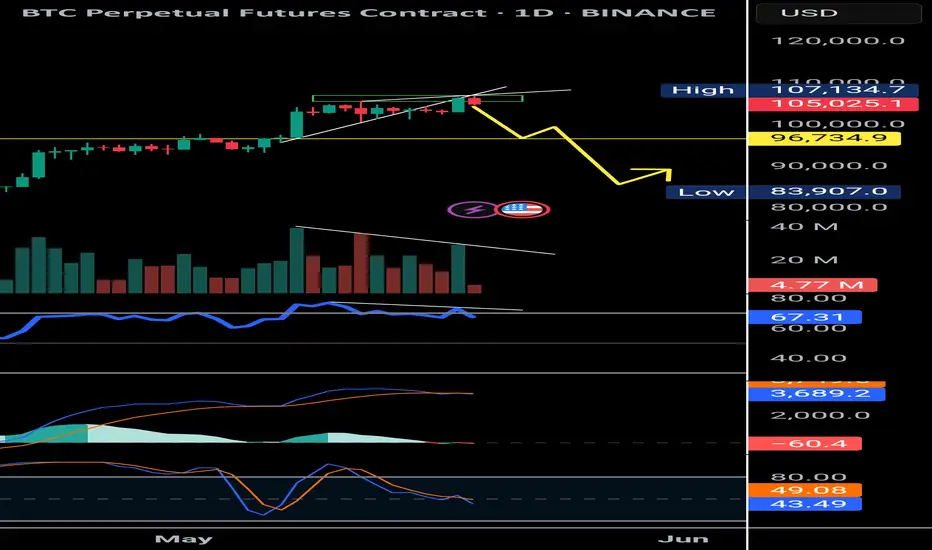
A Quick Bitcoin Warning, We may draw back to Range Low..........
There are a numberr of reason why I am watching a Fractal of the 2021 ATH to Low and comparing it to Current PA
This and the 50 SMA ( Red) and the 100 SMA ( Bliue) show us that we maybe about to see a Draw back if we continue to follow this fractal
As we can see,, in 2021, there was a brief push higher just before the 50 crossed below the 100 SMA.
This Cross over happened 315 days after the ATH in Nov 2021
PA is currently touching resistance after a push higher.
The 50 SMA is dropping to meet the 100 SMA and if we project the current paths of these SMA's they will cross bearish in Late July, Early August, providing PA continues roughlly in its cutrrent Range.
This Cross over will be 308 days after ATH.
Very Close to what we saw in 2021
The sharp drop we saw in late 2022 was a result of the collapse of FTX and we do not need to expect that this time though world events could throw a spanner in the works.
HOWEVER, there are many things that could suggest a new cycle Metric and so to say this WILL happen is foulish, but it s a good idea to be ready IF it does.
We may see PA continue higher, keeping the SMA apart.
We have to Watch but Keep your eye n where PA goes for the rest of this month.
The Month candle is currently Green but it could be seen as an inverted Hammer.....
a green inverted hammer is not considered bullish if it appears after a rise (uptrend). In an uptrend, this pattern is technically identified as a Shooting Star, which is a bearish reversal signal indicating that selling pressure is overcoming buying momentum. .
We have had 2 Green Months ina row and the chances of a RED May are certainly Higher as a result....
So CAUTION RULES US Stocks: Likely Scenarios After the Middle East Conflict on 28As of the close of the Dow Jones last Friday, 27 February, the monthly chart indicated an inverted pattern — not just in the cash market, but also in the futures market.
Then on Saturday, the Middle East conflict erupted once again.
First, I analysed the monthly chart, followed by the smaller time frame on the weekly. If you try it on the daily and even the hourly, you will see much more detail.
Video analysis:
Micro e-mini Dow Jones futures
Ticker: MYM
Minimum fluctuation:
Outright: 1.0 index points = $0.50
Disclaimer:
• What presented here is not a recommendation, please consult your licensed broker.
• Our mission is to create lateral thinking skills for every investor and trader, knowing when to take a calculated risk with market uncertainty and a bolder risk when opportunity arises.
CME Real-time Market Data help identify trading set-ups in real-time and express my market views. If you have futures in your trading portfolio, you can check out on CME Group data plans available that suit your trading needs tradingview.com/cme/
 Short
Short
Short

 Long
Long
Short 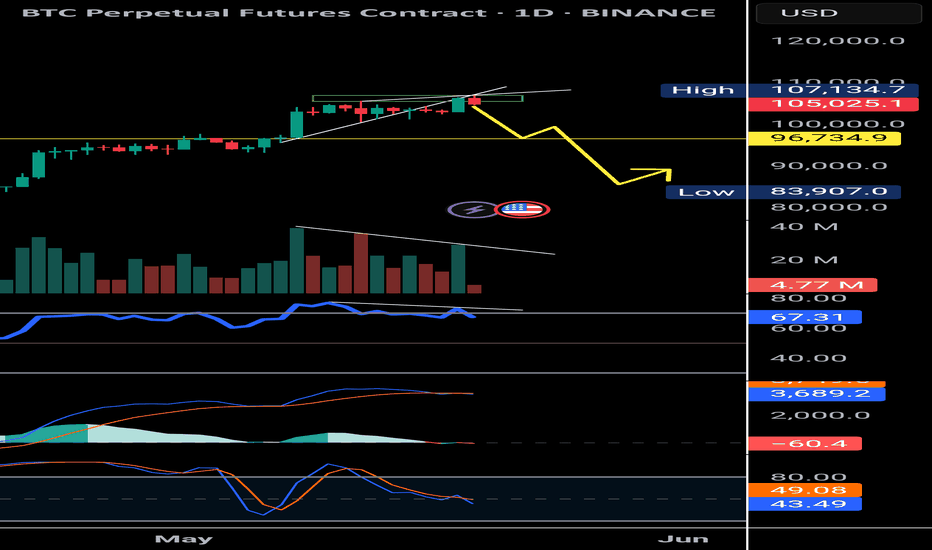
Short 
US Stocks Record High with Record Retrenchment, What's HappeningIn January alone, Microsoft, Google, Meta, and other tech companies have collectively cut more than 21,000 jobs. Furthermore, last year marked one of the worst periods in recent memory, with approximately 260,000 tech professionals losing their jobs.
Normally, we expect to see cost-cutting measures during a contraction stage, as was the case during the Dot-com bust, rather than during a period of growth like today. So, what is currently happening?
My name is Kon How, my work in this channel, as always, is to study behavioral science in finance, discover correlations between different markets, and uncover potential opportunities.
Micro E-mini Nasdaq Futures and Options:
Minimum fluctuation: 0.25 index points = $1.25
Code: MES
Disclaimer:
• What presented here is not a recommendation, please consult your licensed broker.
• Our mission is to create lateral thinking skills for every investor and trader, knowing when to take a calculated risk with market uncertainty and a bolder risk when opportunity arises.
CME Real-time Market Data help identify trading set-ups in real-time and express my market views. If you have futures in your trading portfolio, you can check out on CME Group data plans available that suit your trading needs www.tradingview.com
Short

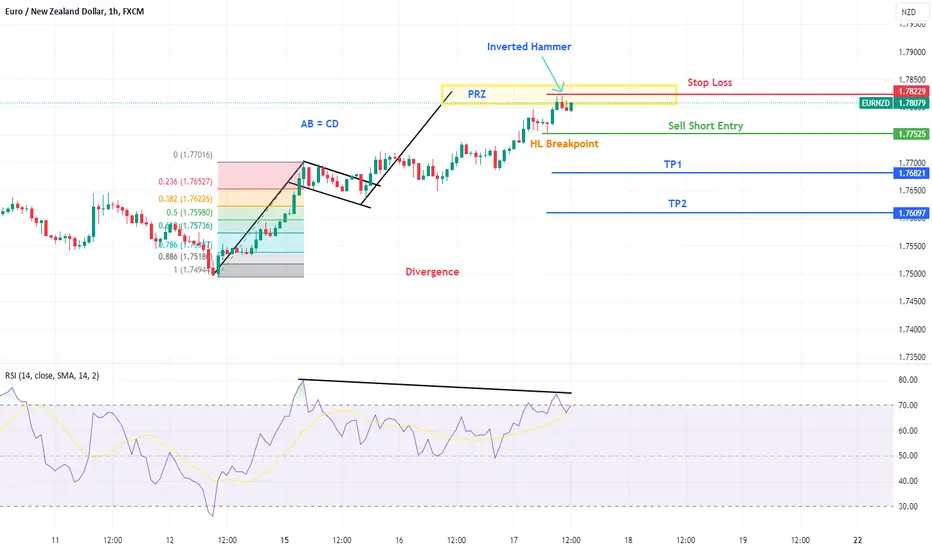
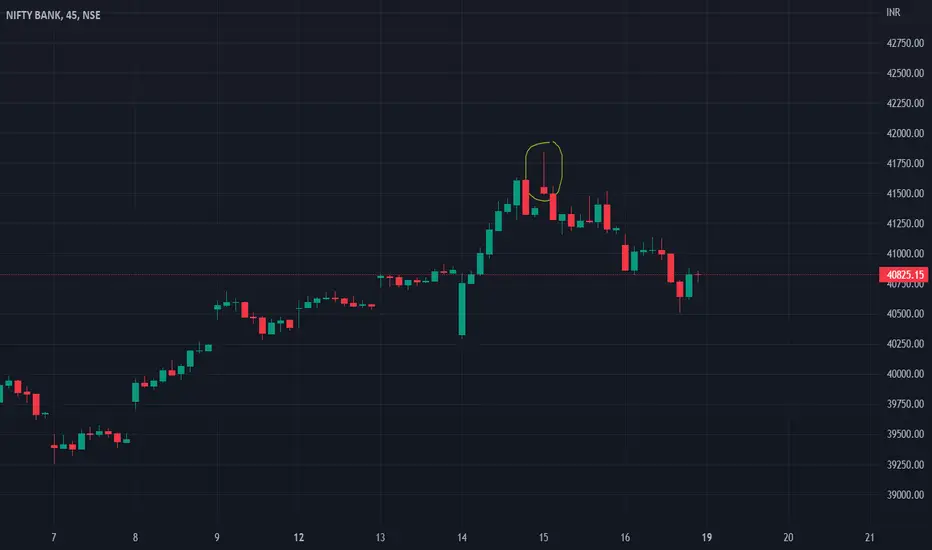
Hammer of Trend ChangeThe Hammer and Inverted Hammer candlestick patterns, two powerful tools adept traders employ for reversals.
If you appreciate our charts, give us a quick 💜💜
Here’s what you need to know:
1. Understanding the Essence:
Hammer: This pattern typically emerges at the culmination of a downtrend, indicating a potential bullish surge. Its small body and extended lower wick signify the bears' struggle to maintain lower prices.
Inverted Hammer: Contrarily, this pattern usually appears at the end of an uptrend, foreshadowing a possible bearish move down. Its small body and prolonged upper shadow denote the weakening grip of the bulls.
2. Decoding the Signals:
While Hammers don’t provide direct trading signals, they suggest a shift in momentum. Traders often see them as a sign of potential upward movement after a downtrend.
Inverted Hammers, appearing after an uptrend, hint at a potential reversal. The failed attempt by the bulls to sustain higher prices signifies a looming bearish sentiment.
3. Crafting Your Strategy:
When dealing with Hammers, traders might enter immediately after its formation or wait for confirmation with a bullish candle. Setting a stop-loss just below the recent low and targeting a significant resistance level is a common strategy.
For Inverted Hammers, a similar approach can be employed, focusing on prior support-turned-resistance levels. Vigilance and additional technical analysis are crucial for accurate predictions.
4. A Word of Caution:
While these patterns are robust, they should never be sole trading indicators. Combining them with other technical tools enhances accuracy and confidence in your trades.
5. Practice and Precision:
Prior to real trades, practice these strategies on demo accounts or paper trading. Platforms like TradingView, Vestinda and others like MetaTrader offer a conducive environment for refining your skills.
Incorporating Hammer and Inverted Hammer patterns into your trading toolkit empowers you to detect potential trend shifts. Remember, in trading, nuanced insights can translate into significant profits. Happy trading! Education 
 Long
Long
Bullish Opportunity on EURJPYBullish Opportunity on EURJPY - Inverted Hammer Pattern Indicates Potential Upside Move
Greetings, traders!
Today, I want to share an exciting trading opportunity on the EURJPY currency pair, which appears to be trading bullish on the 1-hour chart. After conducting a thorough analysis, I have identified a compelling bullish inverted hammer candlestick pattern, suggesting the continuation of the upward trend. Let's delve into the details of this trade plan.
Trade Plan:
Entry Point 1 (Market Execution): 155.878
Entry Point 2 (Market Execution): 155.874
Stop Loss (SL): 155.124
Take Profit 1 (TP1): 156.604
Take Profit 2 (TP2): 157.344
Reasoning:
Bullish Inverted Hammer Candlestick Pattern: The recent candlestick formation on the 1-hour chart has revealed a bullish inverted hammer pattern. This indicates a strong rejection of lower prices and potential buying interest in the market, validating the bullish sentiment.
Confirmed Bullish Trend: The presence of the bullish inverted hammer pattern further reinforces the bullish outlook on EURJPY. The pattern signifies a possible continuation of the existing uptrend, providing traders with an opportunity to capitalize on potential upward movement.
Trade Execution:
To take advantage of this bullish setup, I have executed a market order with two entry points. The first entry is at 155.878, and the second entry is at 155.874. This approach allows for a staggered entry strategy, which may result in a better average price and risk management.
Risk Management:
In order to protect our capital from potential adverse market movements, I have placed a stop loss (SL) at 155.124. This level represents the maximum acceptable loss for this trade setup, and it is essential to adhere to proper risk management principles.
Profit Targets:
For potential profit-taking, I have set two take profit levels. The first take profit (TP1) is at 156.604, aiming for a moderate resistance level. The second take profit (TP2) is set at 157.344, targeting a stronger resistance level. Traders are advised to consider adjusting their positions or securing profits at these levels.
Please be aware that trading involves risk, and it is vital to perform your own analysis and risk assessment before making any trading decisions. This post serves as educational content and should not be considered as financial advice.
Happy trading, and may the markets be in your favor!
Disclaimer: The information provided here is based on my analysis as a technical analyst and may not be accurate or suitable for everyone. Trading involves substantial risk, and you should only trade with capital you can afford to lose.  Long
Long
Short

Short 
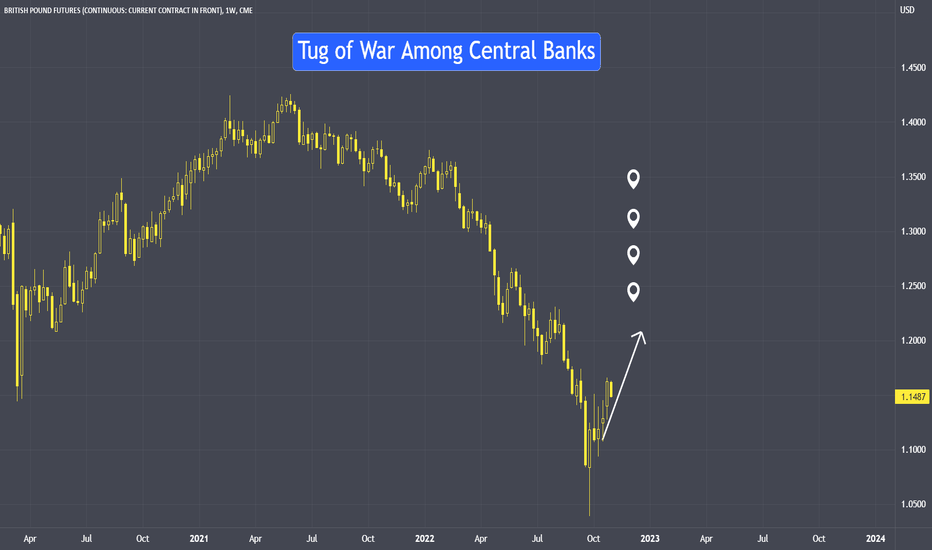
Tug of War Among Central BanksThere is a tug of war situation among the central banks to hike interest rates. What is the bad and the good that will come out from this?
i. Last week of October, European Central Bank officials announced another massive 75 basis point hike, increasing interest rates at the fastest pace in the history of the euro currency.
ii. This week, the Federal Reserve is expected to increase rates by 75 basis points for the fourth time in a row.
iii. The Bank of England could join the club on Thursday.
Content:
. The Interest Rate race has just started, why?
. The impact on different currencies
. It may not be all bad news, why?
With higher interest rates, it attracts investors to buy its currency, in this case the USD.
Currency is always a pair, when USD strengthens, the other side weakens.
When a currency gets weaker, it is very bad news for inflation because they will have to pay more on their imports.
Therefore in order to counter inflation, one of the best measures is to hike rate
Expect more volatility in the currencies market, meaning currencies will take its turn to move.
And if you are a trader, you should welcome volatility. Because with volatility, there are opportunities.
GBP Futures
0.0001 = $6.25
0.001 = $62.50
0.01 = $625
0.1 = $6,250
1.1000 to 1.2000 = $6,250
Disclaimer:
• What presented here is not a recommendation, please consult your licensed broker.
• Our mission is to create lateral thinking skills for every investor and trader, knowing when to take a calculated risk with market uncertainty and a bolder risk when opportunity arises.
CME Real-time Market Data help identify trading set-ups in real-time and express my market views. If you have futures in your trading portfolio, you can check out on CME Group data plans available that suit your trading needs www.tradingview.com
 Education
 Long
Long