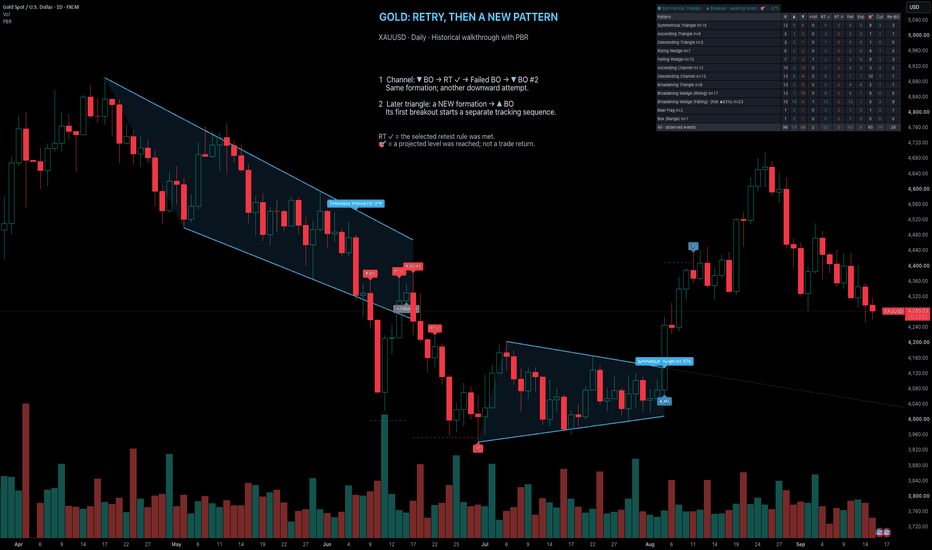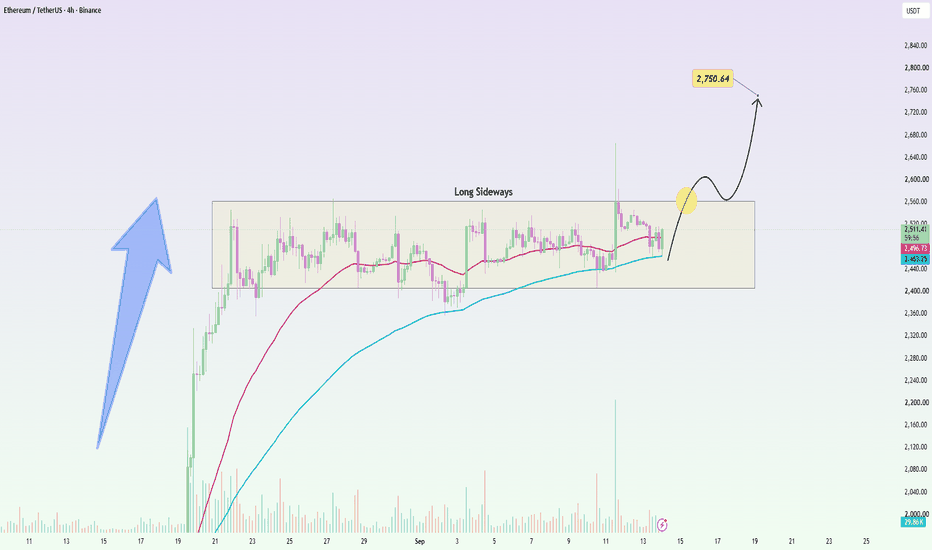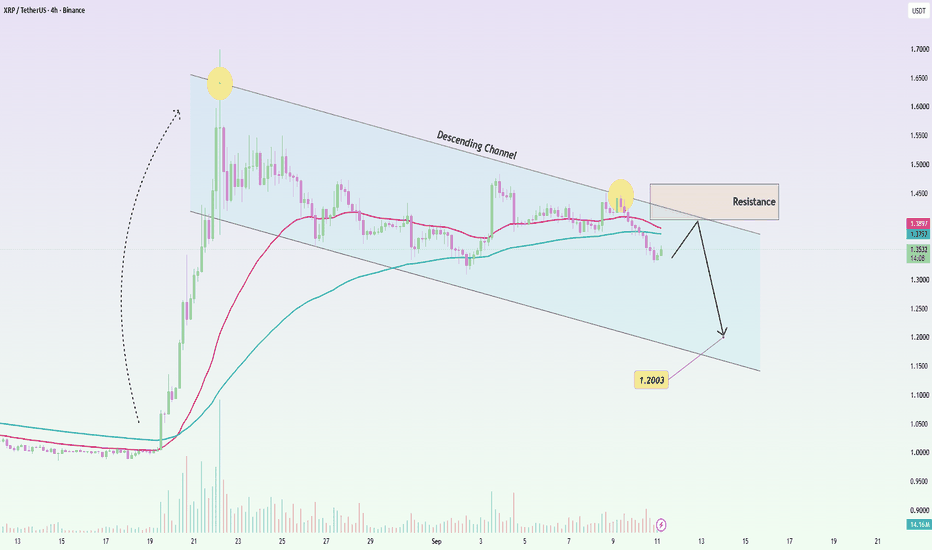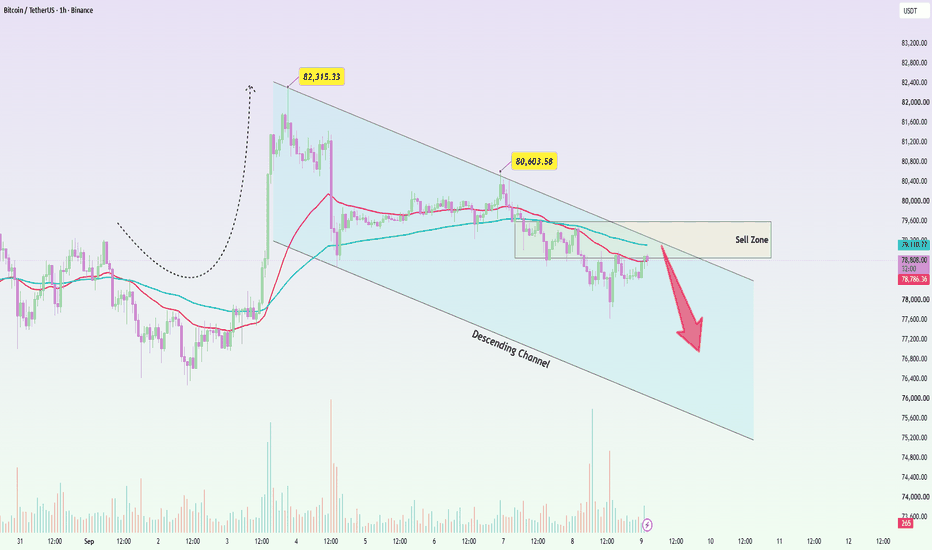
Gold H1: Resistance keeps the advantage for sellers!The strong recovery from the 4,000 region has brought gold back to an important supply area, but the price still cannot overcome the downward trendline. The rejection reaction around 4,110–4,120 shows that buying power is weakening as it approaches the high price range.
The 4.085–4.115 area continues to be the dominant semi-region. As long as XAUUSD remains below the trendline and has not broken the recent peak, the gradually lower peak structure will still be maintained. RSI is also turning back from the high zone, reinforcing the possibility that the upward momentum has begun to cool down.
I prefer to wait for the price to return to the resistance area and a clear bearish signal appears. When 4,060 is broken, selling pressure may extend to 4,040, then towards the main target around 3,995.
Selling viewing area: 4,085–4,115
Confirmation: H1 candlestick rejects at resistance or closes below 4,060
Main target: 3,995
Invalid: H1 closes clearly above 4,120
The recent increase is meeting the right supply zone, so the priority is still to wait for a recovery to sell.
M-pattern
Blow up the HYPEHello Traders! Welcome back after a long time.
Lets go with A1000x deep analysis
Normally this is not a bullish pattern but what Hype did with it makes it a bullish pattern.
Now we can see an expanding triangle facing towards downside and its normally a strong bearish pattern But look closely, When it was suppose to move towards D it started to drop and what it did next is that it formed a pattern on the supportive zone.
If the pattern x was exactly below the supportive zone than we would have already seen it flying but it failed to form a pattern exactly below the supportive zone. So it dropped more.
First it made pattern x thn it successfully made a pattern(y) exactly below resistive line of pattern x so it is now ready to blow up. A pattern exactly below the line show us that they are connected with eachother.
BUY Hypeusdt from 51.5
Stoploss 45.386 (-11.8%)
Target 69.077(+34.24%)
My goal is to be recognized as one of the highest win-rate traders in the TradingView community. :)
Trade Analysis Based on
> Fibonacci Tool (A1000x Way) – Custom Fibonacci approach for precise market analysis
> Candlestick Patterns – Strong price action confirmation through key candle formations
> A1000x Breakout Strategy – Identifying and trading high-probability breakout setups
> HH, HL & LH, LL Strategy – Market structure analysis for clear trend direction
> Swing Points – Tracking key highs and lows for accurate price movement insight
> A1000x Stoploss Strategy – Strategic stoploss placement for effective risk control
> A1000x Target Strategy – Structured target setting based on price action
We trade using carefully developed strategies and disciplined market analysis, always seeking the best possible accuracy while remembering that ultimate success comes only by the will of Allah.
In some trades, you may notice a relatively larger stop loss or a risk-to-reward ratio that may appear unusual at first glance. However, every trade is taken with proper planning and calculated analysis, not random entries.
Before entering any position, we perform detailed calculations and market evaluation. Based on this analysis, we carefully determine our stop loss and target levels.
I personally apply one of my specialized stop-loss and target strategies, designed to place the stop loss at a logical market level where price is less likely to reach before moving toward the intended target — InshaAllah.
Trading always involves risk, but with discipline, patience, and proper strategy, we aim for consistent and responsible decision-making.
Feel free to share your thoughts, leave a comment, or contact me.
ETHUSDT: Holding the Channel – A Buying Opportunity!BINANCE:ETHUSDT maintains its bullish structure as the price holds above the channel's lower boundary and the EMA cluster around 1,900–1,910.
In my view, the current sideways movement indicates that selling pressure is being absorbed at the support zone rather than resulting in a clear breakdown.
I consider the 1,875–1,905 range a critical buying zone. If ETHUSDT successfully defends this area and closes a 2-hour (H2) candle above 1,920, buyers could extend the recovery toward the 1,975–2,000 resistance zone.
Buy Zone: 1,875–1,905
Confirmation: H2 close above 1,920
Targets: 1,975–2,000
Invalidation: H2 close below 1,865 and a break out of the uptrend channel
As long as the support zone holds, the current accumulation phase leans toward a continuation of the uptrend.
BTCUSDT: Neckline Breakdown Opens the Way Toward 61,5!BINANCE:BTCUSDT has completed a clear head-and-shoulders structure, with the right shoulder rejected near 65,500 before price broke decisively below the rising neckline. The market is also trading beneath both moving averages around 64,600, confirming that short-term momentum has shifted back to sellers.
A temporary recovery toward 63,900–64,300 would likely represent a retest of the broken neckline rather than a genuine reversal.
Bearish rejection from this area would provide the cleaner continuation signal, with 62,000 as the first objective and the main target located around 61,500–61,700.
The macro environment supports this bearish structure. The US dollar has reached a one-month high as markets assign a higher probability to tighter Federal Reserve policy, while Bitcoin and Ether have already weakened amid the more defensive market tone.
Invalidation: An H3 close back above 64,650, reclaiming the neckline and both moving averages, would invalidate the immediate bearish setup.
Do you expect BTC to retest the neckline before moving toward 61,500?
AUD H3: Buyers Are Strong at ChannelAUDUSD has returned to the lower boundary of its ascending channel, where the next directional move is likely to begin.
The broader structure remains constructive: price has continued to form higher lows since late June, and the current decline is reaching the same demand zone that previously triggered strong bullish reactions.
The key area is 0.6950–0.6975. This zone overlaps with the rising channel support and the latest structural base, while momentum is already approaching an exhausted condition. A bullish rejection or a strong H3 candle closing back above 0.6980 would confirm that buyers are defending the trend.
Once support holds, price can challenge the 0.7010–0.7030 resistance zone. A breakout and successful retest above this area would clear the path toward the upper channel boundary, with the main target located near 0.70852.
Bullish focus: Confirmation from 0.6950–0.6975
First objective: 0.7010–0.7030
Main target: 0.70852
Invalidation: An H3 close below 0.6945 and outside the ascending channel
NVDA H4: Deep Downward Risk!On H4, the price fell from the peak of about 235 USD, then only recovered to the area of 212–216 USD before continuing to be sold down.
The formation of a lower peak with RSI turning around the neutral zone shows that the upward momentum is fading. The $208–214 area currently acts as near resistance.
The main scenario is that NVDA continues to be held below 214–216 USD, then clearly breaks the 200 USD zone. At that time, selling pressure could pull the price back to 190 USD. Only when the 190 zone is penetrated with a clear H4 candle will the deep reduction target around 164.17 USD be truly activated.
BANDHANBANKNSE:BANDHANBNK
Note :
1. One should go long with a Stop Loss, below the Trendline or the Previous Swing Low.
2. Risk :Reward ratio should be minimum 1:2.
3. Plan your trade as per the Money Management and Risk Appetite.
Disclaimer :
>You are responsible for your profits and loss.
>The idea shared here is purely for Educational purpose.
>Follow back, for more ideas and their notifications on your email.
>Support and Like incase the idea works for you.
GBPJYP trend reversal soon?After a sustained up-move, GBPJPY seems to be taking a halt at the top of the rally & forming a head and shoulder formation, which is a bearish trend reversal pattern. These patterns are most effective especially when they are preceded by a good rally, which is really the situation in our case.
H&S Levels.
The neckline of the pattern is at 216.36 and the highest point on the Right shoulder is at 217.41, top most point on the pattern is at 218.01 and the distance between head & the neckline is essentially our target projection on the downward direction after the breakout.
Trade I am looking forward to:
we can wait for the breakout of 216.36 and then create a short entry with SL of 217.410 for the target of 214.7
summary: Wait for the breakout of the neckline for fresh sell entry.
Wait for the clean breakout before taking fresh entries.
For Educational Purposes only, Not an Investment Advice, Always use strict Risk management measures.
Regards CrazyTrades247.
Short time in BNB tooHello Traders!
Market is strong bearish and BNB is also showing very strong bearish patterns.
BNB is inside an expanding triangle. There is a chance that BNB will move up to touch the line but we are not waiting for that as market is strong bearish so we are Selling BNB From 573
Stoploss 600(-4.5%)
Target 535(+6.8%)
My goal is to be recognized as one of the highest win-rate traders in the TradingView community. :)
Trade Analysis Based on
> Fibonacci Tool (A1000x Way) – Custom Fibonacci approach for precise market analysis
> Candlestick Patterns – Strong price action confirmation through key candle formations
> A1000x Breakout Strategy – Identifying and trading high-probability breakout setups
> HH, HL & LH, LL Strategy – Market structure analysis for clear trend direction
> Swing Points – Tracking key highs and lows for accurate price movement insight
> A1000x Stoploss Strategy – Strategic stoploss placement for effective risk control
> A1000x Target Strategy – Structured target setting based on price action
We trade using carefully developed strategies and disciplined market analysis, always seeking the best possible accuracy while remembering that ultimate success comes only by the will of Allah.
In some trades, you may notice a relatively larger stop loss or a risk-to-reward ratio that may appear unusual at first glance. However, every trade is taken with proper planning and calculated analysis, not random entries.
Before entering any position, we perform detailed calculations and market evaluation. Based on this analysis, we carefully determine our stop loss and target levels.
I personally apply one of my specialized stop-loss and target strategies, designed to place the stop loss at a logical market level where price is less likely to reach before moving toward the intended target — InshaAllah.
Trading always involves risk, but with discipline, patience, and proper strategy, we aim for consistent and responsible decision-making.
Feel free to share your thoughts, leave a comment, or contact me.
BTCUSDT: Changing the BEATHello Traders!
First of all this looks unrealistic target with mega dump, But those who trade with A1000x knows very well we don't miss our targets.
If we watch the current pattern there is Triangle breakout and now market is forming a reversal pattern. Which means it is ready for a dump.
Now lets talk about 49,500 Target. Its not a new pattern, Its an old pattern. Even when market was at peak it was supposed to dump to 49,500. It made perfect bullish move and crossed 100K after 100K there was no way it can cross 150K or 200K without breaking 49,500.
(I didn't knew earlier because this strategy is not that old).
I am also learning a new pattern in which it will be confirmed that whether BTC will cross 22K or not. Because there is a tricky pattern at 22K and its possible that BTC will touch it but its not confirmed yet.
We are Selling BTC from 73,750
Stoploss 67,700(-6%)
Target 49,500 (+22.4%)
My goal is to be recognized as one of the highest win-rate traders in the TradingView community. :)
Trade Analysis Based on
> Fibonacci Tool (A1000x Way) – Custom Fibonacci approach for precise market analysis
> Candlestick Patterns – Strong price action confirmation through key candle formations
> A1000x Breakout Strategy – Identifying and trading high-probability breakout setups
> HH, HL & LH, LL Strategy – Market structure analysis for clear trend direction
> Swing Points – Tracking key highs and lows for accurate price movement insight
> A1000x Stoploss Strategy – Strategic stoploss placement for effective risk control
> A1000x Target Strategy – Structured target setting based on price action
We trade using carefully developed strategies and disciplined market analysis, always seeking the best possible accuracy while remembering that ultimate success comes only by the will of Allah.
In some trades, you may notice a relatively larger stop loss or a risk-to-reward ratio that may appear unusual at first glance. However, every trade is taken with proper planning and calculated analysis, not random entries.
Before entering any position, we perform detailed calculations and market evaluation. Based on this analysis, we carefully determine our stop loss and target levels.
I personally apply one of my specialized stop-loss and target strategies, designed to place the stop loss at a logical market level where price is less likely to reach before moving toward the intended target — InshaAllah.
Trading always involves risk, but with discipline, patience, and proper strategy, we aim for consistent and responsible decision-making.
Feel free to share your thoughts, leave a comment, or contact me.
Crash in MorphousdtHello Traders!
MORPHOUSE is at the peak and bulls are not able to push it further and market is forming bearish pattern. There will be a crash in Morphousdt.
We can see a rising triangle in MORPHOUSE and there will be a crash soon after breakout and there are multiple bearish patterns in Morphousdt.
We are selling Morphousdt from 2.1
Stoploss 2.2695(-7.9%)
Target 1.7612(+16.2%)
My goal is to be recognized as one of the highest win-rate traders in the TradingView community. :)
Trade Analysis Based on
> Fibonacci Tool (A1000x Way) – Custom Fibonacci approach for precise market analysis
> Candlestick Patterns – Strong price action confirmation through key candle formations
> A1000x Breakout Strategy – Identifying and trading high-probability breakout setups
> HH, HL & LH, LL Strategy – Market structure analysis for clear trend direction
> Swing Points – Tracking key highs and lows for accurate price movement insight
> A1000x Stoploss Strategy – Strategic stoploss placement for effective risk control
> A1000x Target Strategy – Structured target setting based on price action
We trade using carefully developed strategies and disciplined market analysis, always seeking the best possible accuracy while remembering that ultimate success comes only by the will of Allah.
In some trades, you may notice a relatively larger stop loss or a risk-to-reward ratio that may appear unusual at first glance. However, every trade is taken with proper planning and calculated analysis, not random entries.
Before entering any position, we perform detailed calculations and market evaluation. Based on this analysis, we carefully determine our stop loss and target levels.
I personally apply one of my specialized stop-loss and target strategies, designed to place the stop loss at a logical market level where price is less likely to reach before moving toward the intended target — InshaAllah.
Trading always involves risk, but with discipline, patience, and proper strategy, we aim for consistent and responsible decision-making.
Feel free to share your thoughts, leave a comment, or contact me.
Aigensyn is at the bottomHello Traders!
After a massive win in Aigensyn we are entering again. We are again buying it from 0.027.
In chart we can see there is a breakout of a pattern but after breaking, Aigensyn is forming a reversal pattern which means it is going to push the price back inside the pattern. There are many more bullish confirmations in this pair.
We are buying Aigensyn from 0.027
Stoploss 0.02542(-5.7%)
Target 0.03270(+21.2%)
My goal is to be recognized as one of the highest win-rate traders in the TradingView community. :)
Trade Analysis Based on
> Fibonacci Tool (A1000x Way) – Custom Fibonacci approach for precise market analysis
> Candlestick Patterns – Strong price action confirmation through key candle formations
> A1000x Breakout Strategy – Identifying and trading high-probability breakout setups
> HH, HL & LH, LL Strategy – Market structure analysis for clear trend direction
> Swing Points – Tracking key highs and lows for accurate price movement insight
> A1000x Stoploss Strategy – Strategic stoploss placement for effective risk control
> A1000x Target Strategy – Structured target setting based on price action
We trade using carefully developed strategies and disciplined market analysis, always seeking the best possible accuracy while remembering that ultimate success comes only by the will of Allah.
In some trades, you may notice a relatively larger stop loss or a risk-to-reward ratio that may appear unusual at first glance. However, every trade is taken with proper planning and calculated analysis, not random entries.
Before entering any position, we perform detailed calculations and market evaluation. Based on this analysis, we carefully determine our stop loss and target levels.
I personally apply one of my specialized stop-loss and target strategies, designed to place the stop loss at a logical market level where price is less likely to reach before moving toward the intended target — InshaAllah.
Trading always involves risk, but with discipline, patience, and proper strategy, we aim for consistent and responsible decision-making.
Feel free to share your thoughts, leave a comment, or contact me.
GBPUSD - Engulfing Pro By INTELA strategyShort Description:
Engulfing Pro by INTELA identifies bullish and bearish engulfing candlestick patterns and combines them with volume (RVOL) and support/resistance context to highlight high‑probability reversal setups. This backtest shows how integrating candlestick signals with market structure improves trade accuracy.
AAVE - Trend-Following Long Opportunity?AAVE remains overall bullish, continuing to trade within a well-defined rising blue wedge. 📈
Price is now approaching a high-confluence support area formed by the intersection of the lower bound of the rising wedge and the demand zone marked in blue.
📌 As long as this confluence holds, we will be looking for trend-following long setups, anticipating the continuation of the broader bullish trend.
As always, rather than buying blindly into support, we will wait for bullish confirmation before considering any long positions.
Will buyers defend this key confluence and trigger the next bullish impulse? 🤔
⚠️ Disclaimer: This is not financial advice. Always do your own research and manage risk properly.
📚 Stick to your trading plan regarding entries, risk, and management.
Good luck! 🍀
All Strategies Are Good; If Managed Properly!
~Richard Nasr
Big bullish move in BeraHello Traders!
This is a wonderful opportunity in Bear as this pump is more than a 100% move.
We can see a golden trendline on the chart. This is the main trendline for now, and BERA is moving around it.
Earlier, BERA formed a reversal pattern after breaking above the trendline, which pushed the price down. Now, it is forming another pattern that looks like a "W" shape. If this pattern plays out, it could push the price higher.
My target is 0.60, but the price could reach as high as 0.63. There is still a chance of a small move lower before the rally begins, but I expect BERA to reach 0.60 very soon.
My goal is to be recognized as one of the highest win-rate traders in the TradingView community. :)
Trade Analysis Based on
> Fibonacci Tool (A1000x Way) – Custom Fibonacci approach for precise market analysis
> Candlestick Patterns – Strong price action confirmation through key candle formations
> A1000x Breakout Strategy – Identifying and trading high-probability breakout setups
> HH, HL & LH, LL Strategy – Market structure analysis for clear trend direction
> Swing Points – Tracking key highs and lows for accurate price movement insight
> A1000x Stoploss Strategy – Strategic stoploss placement for effective risk control
> A1000x Target Strategy – Structured target setting based on price action
We trade using carefully developed strategies and disciplined market analysis, always seeking the best possible accuracy while remembering that ultimate success comes only by the will of Allah.
In some trades, you may notice a relatively larger stop loss or a risk-to-reward ratio that may appear unusual at first glance. However, every trade is taken with proper planning and calculated analysis, not random entries.
Before entering any position, we perform detailed calculations and market evaluation. Based on this analysis, we carefully determine our stop loss and target levels.
I personally apply one of my specialized stop-loss and target strategies, designed to place the stop loss at a logical market level where price is less likely to reach before moving toward the intended target — InshaAllah.
Trading always involves risk, but with discipline, patience, and proper strategy, we aim for consistent and responsible decision-making.
Feel free to share your thoughts, leave a comment, or contact me.
GER30 SHORT• Alignment with the H4 and Daily Trend
This setup is supported by the broader H4 and Daily directional bias. While the market has recently pushed higher, the larger trend structure still favors downside pressure, making this an attractive area to look for short opportunities rather than chasing further upside.
• Retest of a Key Rejection Zone
Price has returned to a significant level that has acted as resistance over the past two weeks. This area has repeatedly rejected bullish advances, and the current test may present another opportunity for sellers to step into the market.
• Bearish Divergence Across Multiple Timeframes
Several lower and medium timeframes are showing bearish divergence, where price continues to push higher while momentum indicators fail to confirm the move. This suggests that buying pressure may be weakening and that underlying market strength is beginning to fade.
• Deep Harmonic Pattern Completion on M30 and H1
A bearish Deep Crab harmonic pattern is completing on both the M30 and H1 timeframes, creating a potential reversal zone at current levels. Harmonic completions at resistance often signal exhaustion and can precede strong reversals when combined with other confluences.
• Trend Exhaustion After an Extended Move
The market has experienced a strong upward push into resistance, but momentum is beginning to flatten. Extended moves often require a retracement before continuation, especially when the price reaches a significant resistance zone.
• Strong Resistance Confluence
This level has proven itself as a major barrier over the past two weeks. The more times a market reacts from a level, the more important it becomes. Current price action suggests buyers are struggling to establish acceptance above this area.
• Potential Lower High Formation
If price rejects from this zone, it could establish a lower high within the broader bearish structure, reinforcing the possibility of further downside continuation in line with the H4 and Daily trend.
• Confluence of Resistance and Reversal Signals
When higher-timeframe trend alignment, resistance, divergence, harmonic completion, and momentum exhaustion all converge at the same level, the probability of a reaction increases significantly. This creates a high-confluence zone that warrants close monitoring.
Entry Zone: 24,635
Stop Loss: 24,800
1st Target: 24190
GBPUSD: Dual-Timeframe Triangle Play—Tactical 2X Bounce off MajoWe are breaking down a highly precise dual-timeframe study on the British Pound vs. US Dollar ( OANDA:GBPUSD - OANDA), mapping out an asymmetrical, short-term long opportunity within a dominant macro compression pattern.
### 1. The Macro Range & Daily Outlook (Ref: GBPUSD_2026-06-08_08-35-14.png)
On the Daily (1D) chart, the Cable is trading inside a massive historical rectangle structure bounded by **1.38700** at the ceiling and **1.31080** at the floor. This provides a clear high-level blueprint: buy the extreme support block and sell the premium resistance walls.
Within this range, price action has condensed into a large symmetrical triangle. Gold-standard technical indicators show the market currently interacting with a multi-month Ascending Trendline (LTA). If this regional cushion holds, the daily momentum is primed to rotate upward to test the horizontal resistance cluster at **1.35079**, with an extended structural macro target sitting up at **1.3580** near the descending upper trendline (LTB).
### 2. The Tactical H4/H1 Execution Matrix (Ref: GBPUSD_2026-06-08_08-34-33.png)
While the daily chart prepares its larger rotation, the short-term order flow on the 4-Hour (H4) chart has presented an ideal entry node for swing traders looking for a quick, high-probability execution:
* **The Setup:** The aggressive markdown has decelerated directly into the LTA support zone. Price is stabilizing around the **1.33410** area, offering a low-risk spot to position against near-term sellers.
* **Risk/Reward Parameters:** The long position tool establishes a tight, professional framework:
* **Entry Trigger:** Market entry around the current stabilization zone (**1.33410**–**1.33518**).
* **Stop Loss:** Firmly invalidating below the key structural line at **1.33153**.
* **Take Profit (2.0X Ratio):** Plotted right below the overhead EMA cluster at **1.34249**. This delivers a strict 2:1 mathematical matrix, optimized for a quick H1/H4 momentum play.
### Trade Management Playbook:
As price Approaches the 1.0X mark near the daily 200 EMA (**1.34042**), we will liquidate **50% of the position** to eliminate directional risk and trail the remainder to breakeven, allowing the final portion to run toward the upper **1.34249** target wall.
---
📊 **ChartPro Data** | By Rogerio
*Systematic Foreign Exchange Research, Price Action Confluences & Trade Geometry.*
⚠️ **Disclaimer:** For educational and informational purposes only. This technical chart study represents a personal trading model and does not constitute financial or investment advice.
AUDCAD Pullback Into Demand AUDCAD continues to show strength across the higher timeframes as the fundamental and technical picture remains firmly tilted in favor of the Australian Dollar.
The divergence between the RBA and the BoC remains one of the key drivers behind this move. While the RBA continues to maintain a relatively restrictive stance due to persistent inflation pressures and a resilient labor market, the BoC has shifted toward a more accommodative approach as economic growth slows. This widening policy gap continues to provide support for AUD against CAD. Institutional positioning also supports the bullish narrative. Recent COT data shows large funds increasing exposure to the Australian Dollar while maintaining a cautious outlook on the Canadian Dollar. This suggests that pullbacks are being viewed as opportunities rather than signs of trend exhaustion.
Technical Overview
Monthly structure has broken out of a long-term accumulation range
Weekly trend remains firmly bullish inside an ascending channel
Daily market structure continues to print higher highs and higher lows
Current pullback appears corrective after a strong impulsive move higher
H4 price is approaching a key support and resistance flip zone around 0.97750
Demand remains intact while price trades above the daily support shelf at 0.97100
Rather than chasing price near current highs, I prefer to let the market retrace into a proven area of demand where risk can be defined more effectively.
Trade Plan
Order Type: Buy (Wait for a rejection or formation of bullish candlestick pattern)
Entry: 0.97750
Stop Loss: 0.97100
TP1: 0.98650
TP2: 0.99550
Risk-to-Reward:
TP1: 1:1.38
TP2: 1:2.77
As long as price remains above the daily invalidation level, the broader bullish structure remains intact. A successful retest of the H4 support zone could provide the fuel needed for a continuation toward fresh highs.