AUD, NZD and CAD Technical Setups: Cross-Currency OpportunitiesAUD/USD is testing resistance, NZD/USD is showing signs of hesitation, and USD/CAD is fighting to hold 1.4000. We examine the technical setups across all three markets before turning to potential trading opportunities in AUD/NZD and NZD/CAD.
MS
Pivot Points
Roll the dice on earnings?GOOGL is in a downtrend: it’s down 22% from its May 18 high of $408.10. It’s also very oversold and sitting on support at $310–315. That’s a setup where a bounce is more likely than usual, but earnings come out Wednesday, Oct 28 after the close, and that report will likely decide which way it breaks. I’ve marked up your chart with both paths, the earnings window and all the levels. As you asked for VTI, the chart labels measure from the all-time high.
Where GOOGL stands
The trend is down.
Each
ETHUSDT Analyses-80, October 27, 2026
BINANCE:ETHUSDT
A Rebound Attempt Inside a Downtrend
Ethereum has been losing ground as sellers continue to defend lower swing highs. The recent decline has brought price into the 2,302 support area, where selling momentum is beginning to slow.
I have taken a long position near this support, looking for a recovery rather than a confirmed trend reversal. The first challenge is 2,328, while a stronger recovery could open the way toward 2,359.
My Active Trade
Buy Entry: 2,315
Stop Loss:
UKOIL has an upside liquidity hunt before the drop (1H)There is a large gap above the current price, and we expect oil to form a base around the current levels before moving higher to fill the gap and hunt liquidity to the upside. Once this liquidity grab is complete, the main downward move could begin.
The short-term trendline has already been lost, indicating that bullish momentum may be weakening. Additionally, oil has reacted to an important supply zone on the higher timeframes, and we also have a bearish Change of Character (CHoCH), suggesting
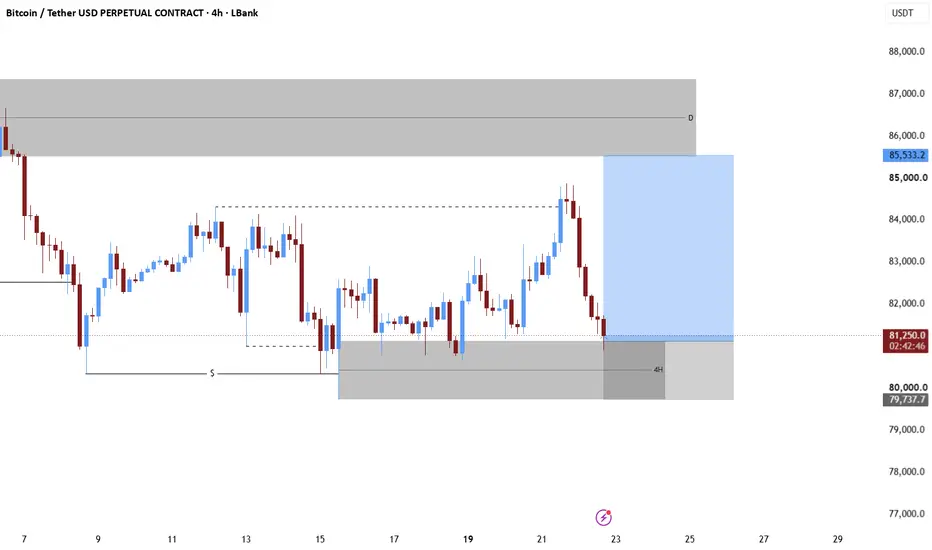
$BTC - Market Update (10/27)Something I’m watching going into FOMC tomorrow.
Binance spot has seen around $97M in net aggressive buying over the last 10 hours, with buyers dominating in 10 of the last 11 hourly periods. The previous 10 hours also showed strong net buying at around $91M, so this isn’t just a short burst of demand.
The interesting part is that CRYPTOCAP:BTC barely moved, slipping 0.04% to $80.25k, while perps leaned slightly toward selling.
Spot buyers are stepping in, but price isn’t really moving high
AUDJPY — Tracking the Bullish Delivery
Price mitigated the higher-timeframe blue zone, followed by bullish displacement that broke the mid-term external lower high and established a structural shift.
From there, sell-side liquidity was taken, creating the inducement that led price into the underlying mid-term order blocks. Lower-timeframe confirmation followed through a break of the external lower high and a sweep of its liquidity, marking the beginning of the bullish progression.
Aggressive displacement then developed after price
USDJPY — Reading the Rhythm Within the Dealing Range
A lot of information is developing within this mid-term dealing range.
Price mitigated the higher-timeframe blue zone, followed by strong bullish displacement that broke the mid-term institutional lower high. From there, price stepped higher and printed a new high before taking out inducement and engineering liquidity.
Last week, I established a buy point as price took that engineered liquidity. Price continued climbing and developed a bullish trend line, but the momentum that supported the i
CADJPY | Tracking the Bullish Delivery
Price mitigated the mid-term order block within the orange zone in previous weeks, followed by a lower-timeframe shift that broke the external lower high.
Since that confirmation, price has continued to climb, mitigating along the way as we track toward the mid-term highs.
The initial buy point was established earlier in the process. Rather than adding prematurely, I waited for bullish alignment and momentum to join the move.
With that alignment now present, the latest pullback provided anot
GBPUSD — Tracking the Footprints
Price remains in a bullish top-down structure.
After mitigating the higher-timeframe order block within the blue zone, price delivered a mid-term shift, breaking a significant institutional lower-high level. From there, price expanded upward and printed a new high.
Now, the focus shifts to the next phase of delivery.
I'm tracking a potential sell-side liquidity run, followed by a move into discounted territory where the lower auction areas and inducement sit.
** The primary area on my radar
USDJPY — Bullish IntentBULL
Price continues to confirm bullish intent through top-down analysis, with the higher-timeframe direction supporting the current flow.
Since confirmation, price has held strong, delivering minor stair-stepping pullbacks along the way. The structure isn’t always clean, but the bullish intent remains intact.
Trendlines are positioned underneath price, acting as guide rails as we track the continuation toward the midterm highs.
Now, I’m waiting for the correction to fully deliver before loo
$LIT: Potential HTF Long SetupSupply has been capping every relief rally, with price continuing to print lower highs and sellers maintaining control. The structure remains bearish, and I’m not looking to long into overhead supply.
I’d rather wait for price to revisit the $2.00–$2.30 HTF demand zone before looking for a long. Where I’ll be watching for a potential long setup back to $4 to $4.60 (swing point).
$ETH: Situation breakdown 10/26BYBIT:ETHUSDT.P
Buyers couldn't hold the support zone, price dropped lower, playing out the second scenario from the last breakdown.
Shortened US Sunday session clearly showed zero demand.
Yet, 🧩IMA analysis points to buyers still holding dominant positions.
Watching today's US session. If buyers show no activity, odds of a drop to the historical consolidation zone of $2200-$2220 go up.
Need to watch price reaction closely on lower timeframes: 4H and 1H.
Main support still sits at $2080-$2170
Crude Oil Gaps Lower - Top Incoming?The $5 gap lower was its strongest since August, and with prices near resistance after an extended run, perhaps it is time for crude oil to retrace. That said, intraday support levels are nearby, and I suspect bulls will try and fill that nice big gap over the near term.
MS
The 4,000 psychological level.Round Numbers.
Round umbers have always had a strong psychological impact that makes them act like magnets, just like when we went from 1999 to 2000, it was a milestone. We didn't go into AI, flying cars, drones just because of the number, the technology has been developed for years, the number is a milestone. Our milestone here is the 4,000 level.
The Gold Rush.
Gold went from $1,999 to $2,000 approximately three years ago, and since then it made a series of All Time Highs and entered into a
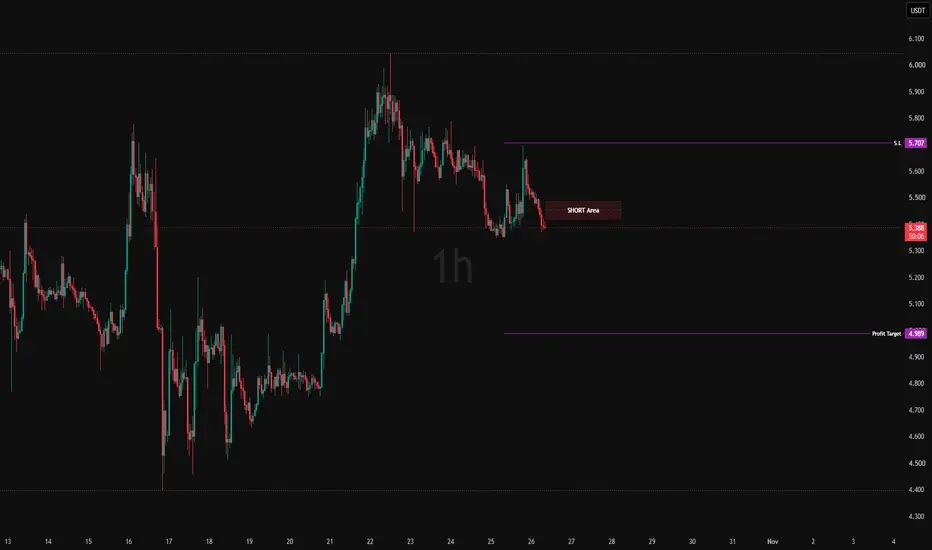
$PROM SHORT Setup SummaryBINANCE:PROMUSDT.P
TURQUOISE:PROM is showing weakness after getting rejected from the 5.90 area and forming a series of lower highs. Price has now moved back toward 5.40, and I'm watching for further downside continuation.
**Trade Levels**
- **SHORT Area:** 5.42–5.49
- **Stop-Loss:** 5.707
- **Profit Target:** 4.989
### Market Structure
TURQUOISE:PROM has lost momentum after its strong upward move and is now showing a corrective structure on the 1H timeframe. The recent recovery attempt
ANKR LONG SetupCRYPTO:ANKRUSD
ANKR has shown bullish momentum after recovering from the 0.00390 area and forming a series of higher highs and higher lows on the 1H chart.
Price has now pushed toward 0.00450 before facing some rejection. I'm watching whether this pullback holds within the marked LONG entry area.
**Trade Levels**
- **LONG Position:** 0.004372
- **Entry Area:** 0.00424–0.00436
- **Stop-Loss:** 0.004229
The idea is to see whether CRYPTOCAP:ANKR can hold the entry zone and continue its bulli
Gold, Mon 26 Oct: the pivot sits on the 4000 lineTHE WEEK STARTS · Monday 26 October
Gold (XAUUSD) · Daily levels
R3 4060
R2 4038
R1 4024
Pivot 4002
S1 3980
S2 3966
S3 3944
Where we left it
Friday's map called S1 the decision zone. Sellers broke it overnight and took price to S2 on the nose. The 15:00 data then flushed price to 3976. Buyers held there, and gold closed the week at 3996. Week 5: 6 plays, 4 reached, 1 breakeven, 1 stopped, +$47. October so far: +$305.
Where price sits
Gold opens the week at 3996, $6 under the pivot and right o
BNBUSDT Analyses-76, October 25, 2026
Welcome to my page! I share daily technical analyses of crypto and other charts here.
BINANCE:BNBUSDT
🔍 Market Structure Analysis:
BNB is showing a short-term bullish recovery on the 1H chart. Higher local lows and the reaction from the 730.19 support area support the bullish setup.
🎯 Entry & Exit Signal:
Buy Entry: 739.57
Stop Loss: 736.02
Targets: 746.67 R/R:2 - 748.01
Key Support & Resistance:
Key Resistance: 740.52 / 748.01
Key Support Area: 737.89 / 730.19 / 722.61
GOLD (XAUUSD): Support & Resistance Analysis for Next Week
Here is my latest structure analysis for Gold.
Resistance 1: 4067 - 4269 area
Resistance 2: 4195 - 4270 area
Resistance 3: 4375 - 4442 area
Support 1: 3942 - 3995 area
Support 2: 3885 - 3932 area
Support 3: 3768 - 3817 area
Consider these structures for pullback/breakout trading.
I expect a bullish move from Support 1.
❤️Please, support my work with like, thank you!❤️
I am part of Trade Nation's Influencer program and receive a monthly fee for using their TradingView charts in my analys
Liquidity Pools + Premium/Discount: The SMC MapHook
Most traders buy breakouts at the top and sell breakdowns at the bottom.
Smart money does the exact opposite. 🎯
It buys cheap, sells expensive, and uses liquidity to get filled. Here’s the full map.
Context: The Dealing Range
Take any swing low to swing high. Draw a line at 50%. That’s Equilibrium.
Above 50% = Premium (expensive, sell area)
Below 50% = Discount (cheap, buy area)
Same market, same range. The only thing that changes is where you enter.
1️⃣ Premium Zone (Expen
EURUSD: Support & Resistance Analysis for Next Week 🇪🇺🇺🇸
Here is my latest structure analysis and important supports & resistances
for EURUSD for next week.
Consider these structures for pullback/breakout trading.
❤️Please, support my work with like, thank you!❤️
I am part of Trade Nation's Influencer program and receive a monthly fee for using their TradingView charts in my analysis.