The previous index close is invisible on your NQ chartThursday, the Nasdaq-100 closed at 29,727.
This is the Friday session on NQ. Price traded straight through 29,727 — all the way down to around 29,675 — without so much as a pause. No reaction, no defence, nothing. Because on this chart, 29,727 isn't a level. It's just a number.
And yet Thursday's close is one of the most-watched reference prices in the market. It simply isn't where you think it is.
The reason: the cash index and the future are two instruments quoting the same market, and they don't trade at the same price. The gap between them is the basis — the cost of carrying the position to expiry: financing, minus the dividends you'd have collected by owning the hundred underlying stocks. The Nasdaq-100 is a price index, so those dividends aren't reinvested and they pull against the financing cost. What's left is the premium.
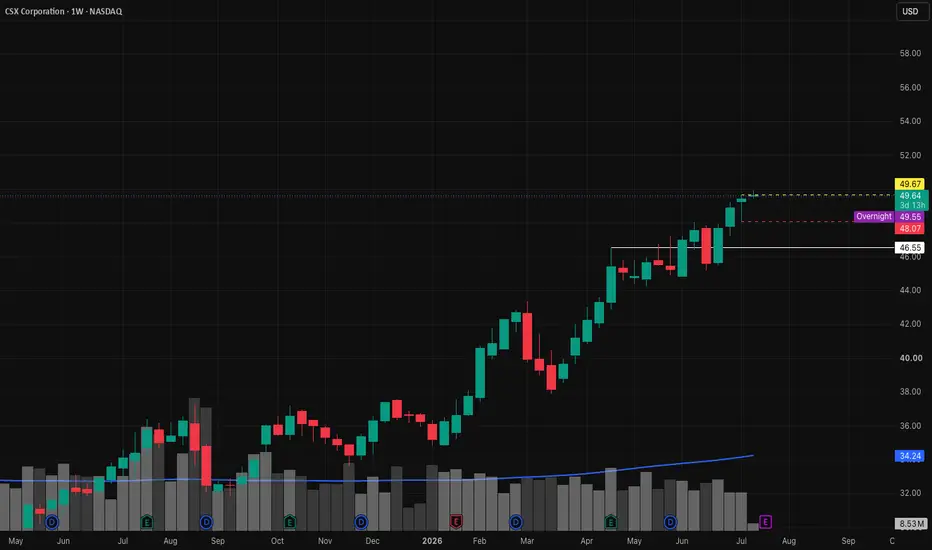
At the moment Thursday's close was set, the future was trading about 214 points above the index. So Thursday's close actually sits at 29,941 on this chart — marked here. That is where price stopped and turned on Friday morning (circled).
Same event. Two hundred points away from where you were looking.
Two things traders try, and why they don't hold up:
1. Keeping the index chart open beside the futures chart. You end up doing mental arithmetic at the exact moment price is at the level and your hands are on the keyboard.
2. Memorising the gap once. It drifts — it shrinks toward expiry and moves with rate and dividend expectations. Be a few points out and your level is a few points from where the market actually turns. On NQ that is the difference between a fill and a chase. Measure it, don't remember it.
And it isn't only the close. Previous session high and low, the pre-market range, the RTH open — all index events, all needing the same treatment before they mean anything on the chart you trade.
Worth doing before you trade it: put the level on your chart and just watch it for a week. Count the stalls, the reversals, the accelerations through it. You're not adding a signal — you're seeing one that was already there.  Education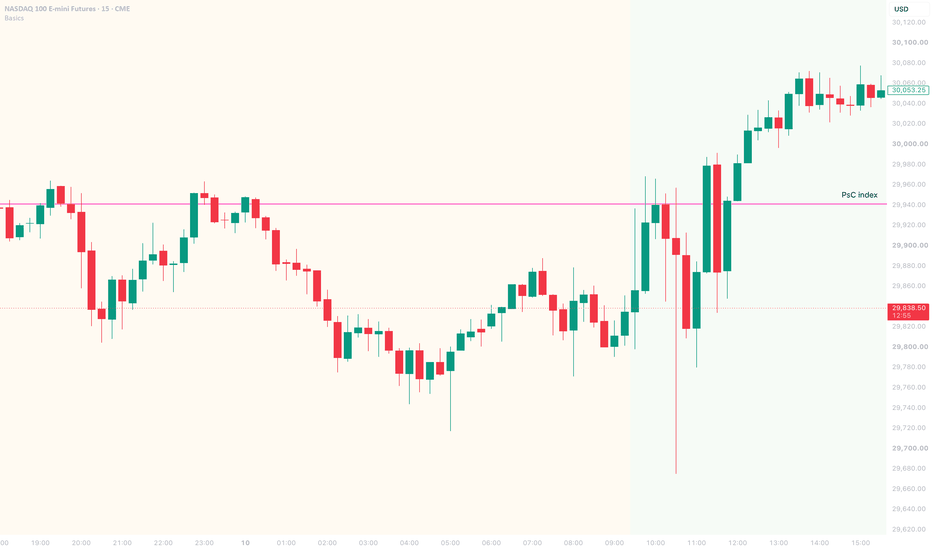
 Long
Long
 Long
Long
 Long
Long
 Long
Long
 Long
Long
 Long
Long
 Long
Long
XAUUSD — The Pump Needs a RetestGold just gave a strong reaction from the lower liquidity area.
Price moved quickly from the 3,998 zone and is now trading near 4,080 - 4,085.
At first look, this recovery looks strong.
But for me, the chart is not fully clean yet.
Why?
Because gold is still inside the larger descending channel, and price is now reaching an important FVG reaction area.
This is where many traders may start chasing the move.
But Tiara’s view is simple:
A strong candle shows momentum.
A retest shows quality.
The simple read
Gold is recovering after defending the lower liquidity zone.
The current upside move is pushing into the FVG area around 4,095 - 4,110.
If buyers can hold this area and continue building pressure, the next resistance is 4,127.
But if gold rejects from the FVG, price may pull back first.
The key retest zone is 4,025.
If 4,025 holds, the recovery can still stay alive.
If 4,025 breaks, gold may revisit the 3,998 liquidity buy zone.
Key price zones
Current price area: 4,080 - 4,085
FVG reaction zone: 4,095 - 4,110
Main resistance: 4,127
Key retest zone: 4,025
Liquidity buy zone: 3,998
Bullish structure improves above: 4,127
Trading plan
📈 Continuation scenario
If gold holds above the FVG zone:
Buyers may try to push price toward 4,127.
A stronger bullish idea only becomes cleaner if gold breaks and holds above 4,127.
I do not want to chase the move without confirmation.
📉 Retest scenario
If gold rejects from 4,095 - 4,110:
A pullback toward 4,025 may appear.
This would not automatically make the chart bearish.
It may simply be a healthy retest after the strong recovery.
A clear reaction from 4,025 could support another push higher.
📉 Deeper support scenario
If 4,025 fails:
Gold may move back toward 3,998.
This zone is still important because it was the liquidity buy area that started the recovery.
If buyers fail to defend 3,998, the descending channel remains in control.
Tiara’s View
Gold is showing strength, but strength after a fast move is not enough.
I want to see whether buyers can protect the retest.
For today, the clean plan is not to chase the candle.
The clean plan is to watch the reaction around the FVG and then the 4,025 zone.
Main view:
Gold is recovering, but still inside a descending channel.
4,095 - 4,110 is the first test.
4,127 is the resistance target.
4,025 is the key retest zone.
3,998 is the deeper liquidity support.
Reaction first.
Confirmation second.
Trade last.
No confirmation = no trade.
Do you think gold can continue toward 4,127, or does the market need to retest 4,025 first?  Short
Short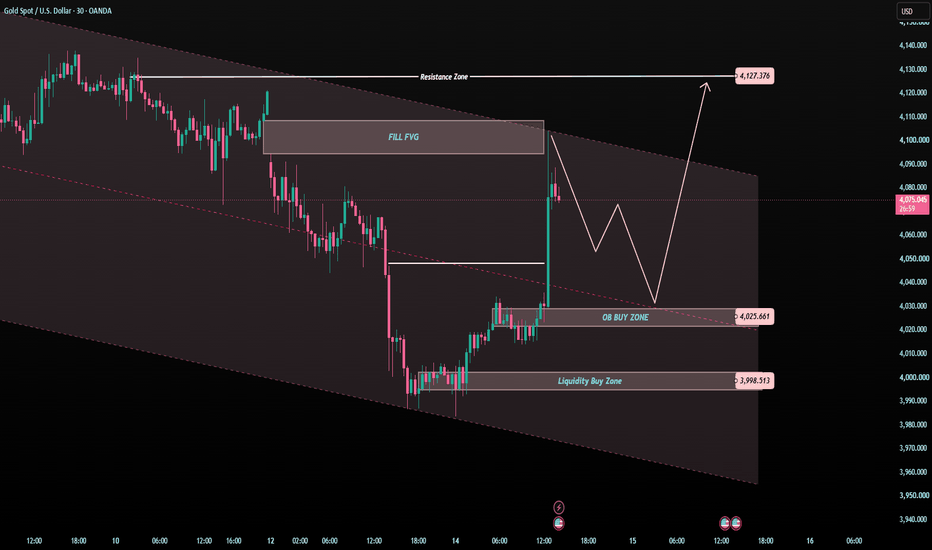
DXY: Consolidation, Liquidity Hunts, and the Next Macro MoveHi!
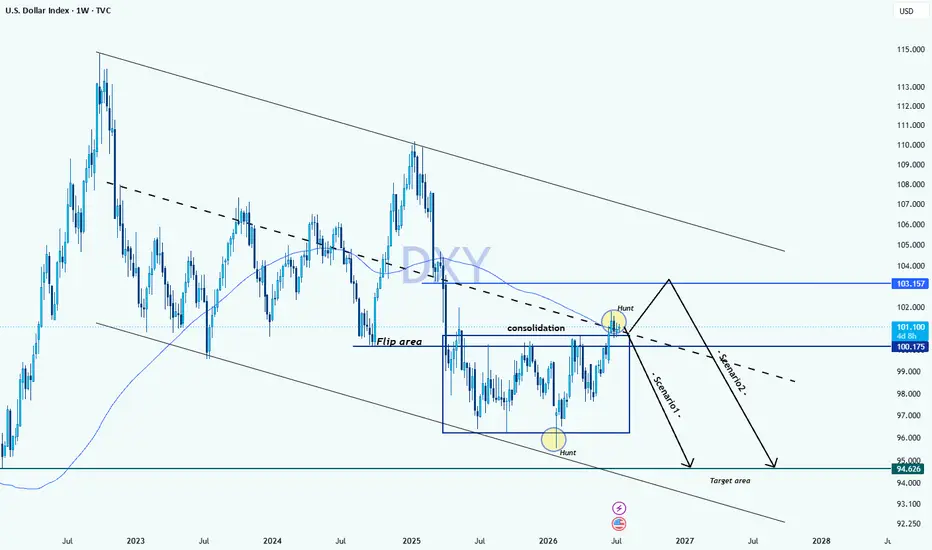
The US Dollar Index (DXY) is sitting at a critical macro inflection point on the weekly chart, currently trading around 101.109. After breaking down below a massive weekly support level (now acting as a Flip Area around 100.175), the index has entered a prolonged consolidation phase right in the middle of a major descending channel.
What makes the current price action highly interesting is the clear liquidity hunt on both sides of this range. We saw a clean sweep of the range lows near 96.00, followed by a recent aggressive push to hunt the buy-side liquidity above the range highs around 101.20.
With the liquidity cleared on both ends, DXY is gearing up for its next directional leg. Here are the two primary structural scenarios playing out.
Scenario 1: Direct Rejection & Drop (Immediate Bearish Continuation)
The Setup: The recent upward push is treated purely as a fakeout/liquidity hunt to grab stop-losses above the consolidation range.
Price Action: Price fails to sustain any weekly closes above the current level and immediately starts breaking back inside the range.
Target: A direct structural sell-off heading down toward the macro Target Area at 94.626, aligning perfectly with the lower boundary of the descending channel.
Scenario 2: Extended Pullback to Supply before Drop
The Setup: Instead of an immediate sell-off, DXY builds enough short-term momentum from the liquidity sweep to fuel a deeper corrective rally.
Price Action: Price extends upward to test the major overhead Supply & Demand (S&D) zone at 103.157, which lines up with previous structural breakdowns.
Target: After tapping this strong macro supply zone and mitigating resting orders, the index experiences a heavy rejection, ultimately dropping back down to fulfill the final 94.626 macro target.
I’m excited to announce that I’m now a Brand Ambassador for AvaTrade!  Short
Short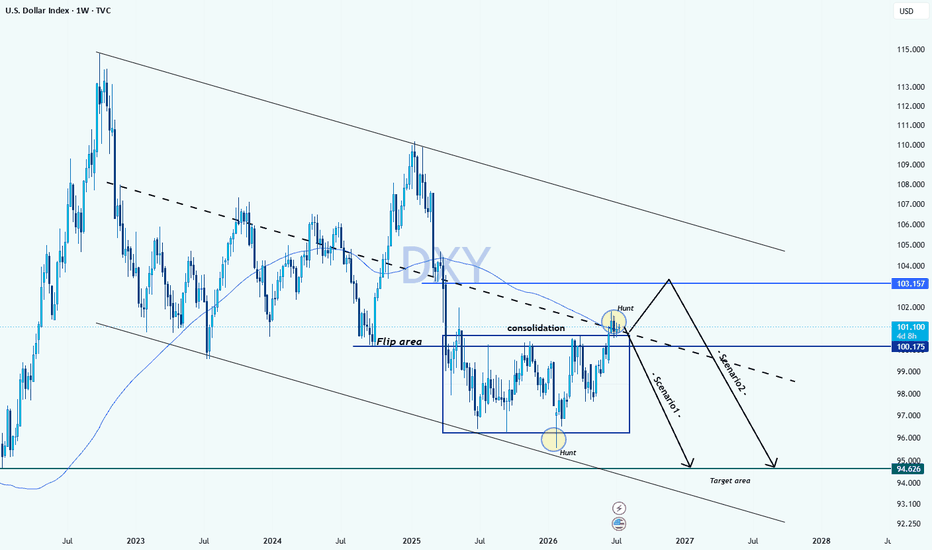
Nifty Analysis EOD – 14 July, 2026 – Tuesday🟢 Nifty Analysis EOD – 14 July, 2026 – Tuesday 🔴
Still Boxed In: Nifty Refuses to Break Free From the 8th July Cage
🗞 Nifty Summary
Nifty opened with a gap down of 115 points on fear sentiment driven by geopolitical news. Around 42 points below the open, it found a base near 24,050 and sharply recovered 106 points from the day low, testing the 24,160 resistance level — a zone that had earlier acted as support. Rejection came swiftly, and the index fell back with the same intensity, retesting the IBL.
From there, Nifty stayed range-bound within the IB — volatile, but going nowhere. IBL was tested multiple times and held, until around 2:45 PM when it appeared to break. That too turned out to be a fakeout. After hovering around the IBL for the rest of the session, the day closed at 24,035.15 — above the PDL, but without much conviction in either direction.
Today’s range was entirely inside the previous day’s range. The daily candle formed something close to a doji with just 133 points — roughly half the Gladiator average range. This is Nifty’s 4th consecutive session still inside the range of 8th July 2026.
🛡 5 Min Intraday Chart with Levels
📉 Daily Time Frame Chart with Intraday Levels
🕯 Daily Candle Breakdown
Open: 24,068.00
High: 24,157.10
Low: 24,023.70
Close: 24,052.05
Change: −158.95 (−0.66%)
🏗️ Structure Breakdown
Type: Bearish Doji — indecision candle with a slight bearish close
Range: ≈ 133 points — low volatility
Body: ≈ 16 points — near-equal open and close reflect a standoff between buyers and sellers
Upper Wick: ≈ 89 points — meaningful supply rejection at the upper end
Lower Wick: ≈ 28 points — modest demand absorption near the day low
🛡 5 Min Intraday Chart
⚔️ Gladiator Strategy Update
ATR: 254.37
IB Range: 106.55 → Medium
Market Structure: Balanced
Trade Highlights:
10:44 Long Trade: Trailing Target Hit (R:R 1:1.34)
11:37 Short Trade: Trailing Target Hit (R:R 1:2.14)
13:38 Short Trade: Trailing SL Hit
CE Hero Zero: Target Hit (R:R 1:4)
Trade Summary: The first two trades worked well — both trailing targets hit with decent R:R. The third short didn’t hold and stopped out at trailing SL. The CE Hero Zero trade closed at 1:4, but I regret not lifting full qty due to less conviction. Mixed signals from the market, but the system kept things in check.
🧱 Support & Resistance Levels
Resistance Zones: 24,160 | 24,250 | 24,300 | 24,360 ~ 24,380
Support Zones: 23,975 | 23,900 | 23,785 | 23,630
🧠 Final Thoughts
“Four sessions inside one range. The market is not lost — it is loading.”
Today’s session was a good reminder that not every gap-down needs a resolution the same day. The sharp 106-point recovery from the low looked promising, but 24,160 held as resistance and the index drifted back. IBL was tested multiple times — the fakeout at 2:45 PM was the clearest signal that neither side had enough edge to commit.
For tomorrow, 24,160 remains the key level to watch on the upside. If Nifty can push above and hold it, 24,250 and 24,300 come into play. On the downside, 23,975 is the first meaningful support — a break below that could open up 23,900.
This is now the 4th session inside the 8th July range. The longer this consolidation holds, the sharper the eventual move might be — in either direction. For now, patience seems like the better trade.
✏️ Disclaimer
This is my personal digital diary and represents my own analysis and point of view. It is not financial advice; please consult a professional advisor before making any trading decisions. Another Test of 7555 AheadHello, traders!🌴
In my previous post, I specifically highlighted the less obvious 7555 level. It has now proven to be a very important area❗️❗️❗️, and my upcoming analysis will continue to be based on how price reacts around it.
As I mentioned in the last update:
“I consider this level to be the key factor in determining the next move. If SPX breaks above 7555 and manages to hold that level, clearing the all-time high at 7625 should not be a major challenge. In that case, the path toward the next target at 7950 opens up. However, if price gets rejected at 7555 once again or forms another false breakout, there's a high probability we'll see a move back toward the 7450-7500 area, where the 100 EMA and 200 EMA on the 4H timeframe are currently located.”
So far, this 🐻 scenario has played out exactly as expected. We saw a rejection from 7555 followed by a pullback to 7500 ✅
The fact that the pullback is currently finding support at the 4H EMA 100 while also holding above the 1H EMA 100 and EMA 200 is clearly a bullish sign🛡️🛡️🛡️ For that reason, I expect another attempt to break through 7555 in the near future.
🐻🪓The bearish scenario remains unchanged. If those moving averages are broken with strong momentum, the next key support levels become:
Support levels:
• 7300 — Local horizontal support
• 7200 — Area of the 1D EMA 100
• 7000 — Previous all-time high
Peace, everyone🌄
⚠️ Disclaimer:
All information shared on this channel is for educational and informational purposes only and should not be considered investment advice. The author is not responsible for your trading decisions. Always manage your risk and make your own independent decisions.  Long
Long
 Long
Long
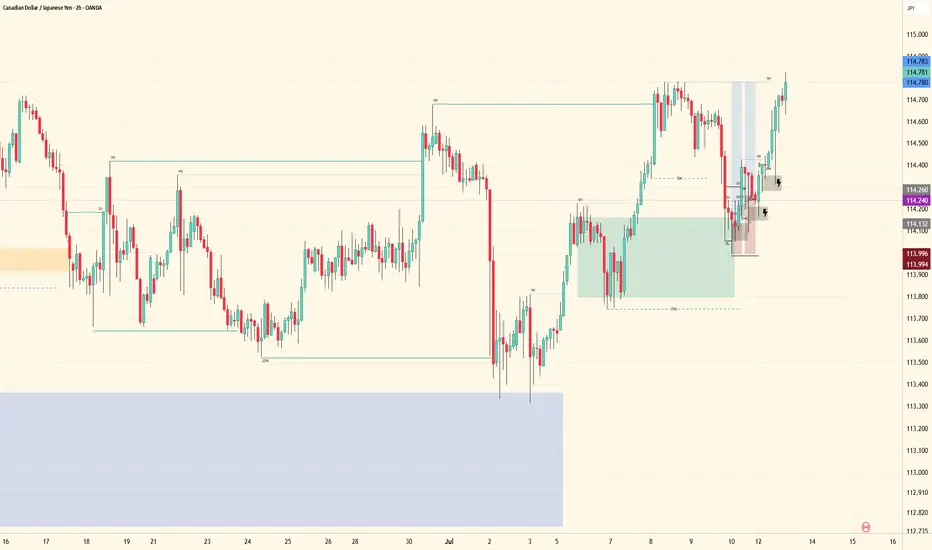
CAD Update- Trade JournalHigher-timeframe structure remains bullish. Through higher-timeframe mapping, the trend was confirmed, allowing me to continue positioning buys in line with the confirmed order flow.
Once price gave the mid-term shift and broke the lower high, bullish continuation became the expectation. Since then, price has delivered exactly as anticipated, reaching my take-profit objectives and securing profits.
If you look closely within the current range, you’ll notice the two most recent shallow black boxes. The original plan was to scale into the position with four entries, adding as price confirmed strength. The small lightning bolt icons mark where those additional positions were supposed to be executed.
Unfortunately, I was exhausted after several late nights studying the charts and missed those add-on opportunities. Even with the missed scale-ins, the overall analysis remained valid, price respected the mapped structure, and the targets were achieved.
Now it’s on to the next phase. A new range will form, new liquidity will develop, and new high-probability points of interest will present themselves. Until then, patience remains key.
The edge isn’t chasing price—it’s tracking structure and waiting for the next opportunity.
On to the next mapping. 📈
Remember: Patience is key
Tracking remains the edge
“It always was my sitting.” — Jesse Livermore
 Long
Long
 Long
Long
$SPCX Crash or Manipulation of the Century?BINANCE:SPCXUSDT.P
As I noted in the June 26 review: the IPO of the century turned into the manipulation of the century.
NASDAQ:SPCX dropped from $228 to $143 (−38%) after IPO. All support levels broken, no trading history below $135. On the chart — a picture that looks like a collapse.
But if you look deeper, through the Integrated Market Analysis (IMA) system, a different story emerges.
What the data says, in plain terms:
• 🐋 Whales aren't exiting: According to IMA, positions of the largest players have been stable since June 30. Despite the drop, they're not selling — meaning they either believe in a recovery, or are quietly accumulating.
• 👥 Retail and mid-tier traders are leaving: The number of mid-level top-trader accounts is shrinking. Small players are cutting losses and exiting — classic "washout" behavior.
• 🔄 Washout scenario: When weak hands exit and strong hands hold — it often precedes a sharp bounce. Not a guarantee, but a pattern worth watching.
My plan:
• 🟡 Watching the 📊 IVZ level at $147: a breakout above this level + rising whale position in IMA = first signal of a reversal
• 🟡 Breakout and hold above 📊 IVZ $153 with stable whale positioning = confirmation: large players have built their position
• 🟡 Important to note: in moments of obvious manipulation and limited trading history, the risk of false moves remains high
In situations like this, it's more important not to guess the bottom — but to wait for institutional capital to show its hand.
Analysis from me — execution from you 🚀
Platform guidelines restrict sharing proprietary indicators, so I display only the 📊 IVZ algorithm output — institutional interest zones.  Long
Long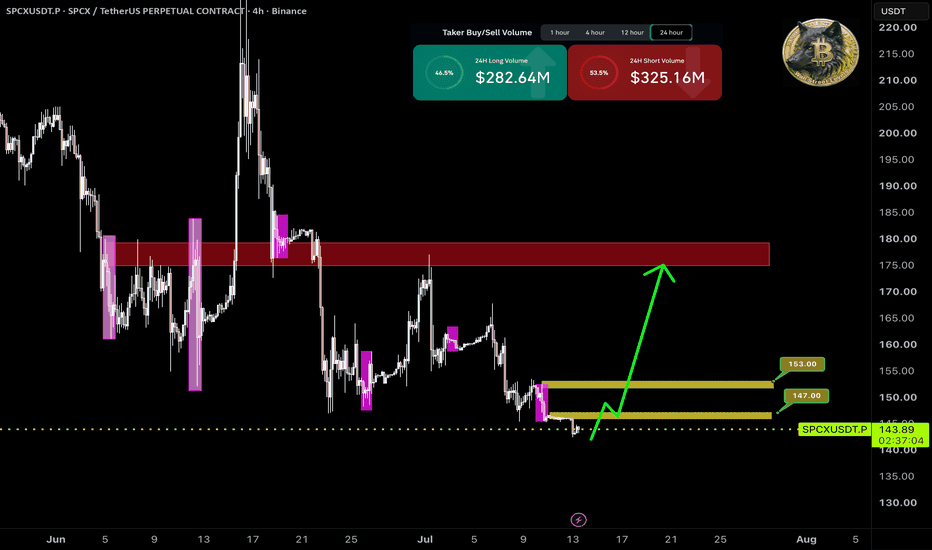
Nifty Analysis EOD – July 13, 2026 – Monday🟢 Nifty Analysis EOD – July 13, 2026 – Monday 🔴
Bear Trap: Bulls Recover and Test the 24,250 Fortress
🗞 Nifty Summary
Nifty gapped down 185 points on geopolitical tension, opening right at the 24,040 support. The first tick found its base at the exact 24,000 level, and from there the index gave a steady recovery of 158 points within the first hour.
After reaching 24,150, Nifty got trapped inside a narrow range of about 35 points between the PDL and 24,150 for almost an hour and 45 minutes. Around 12 PM, it finally exited this range and broke the CPR, PDC, PDH, and R1, pushing up to test 24,250 — which is almost the previous month’s high too.
By the end, the day closed at 24,208.60 on an intraday basis, 51 points below the day’s high. Adjusted closing came in at 24,211.
Today’s close is exactly at the previous session’s intraday close. Today’s range extended on both sides of the previous session, forming a daily engulfing candlestick pattern, which may point to highly volatile sessions in the coming days. The day opened at the previous day’s low and broke the previous day’s high, but couldn’t close above the PDH — so we can still categorise it as a kind of bear trap session too.
For tomorrow, the opening is the most important factor for the directional view. We are sitting very close to the 24,250 resistance. If Nifty gaps up above this level and holds it, then we can expect the bullish sentiment to continue. But if it opens inside the range, then we have to wait for a directional view, because there is a clear sign of selling pressure at this level. Tomorrow also has a weekly expiry, and call writers don’t let go easily — so be ready for a strong fight and some volatility.
🛡 5 Min Intraday Chart with Levels
📉 Daily Time Frame Chart with Intraday Levels
🕯 Daily Candle Breakdown
Open: 24,039.40
High: 24,259.80
Low: 24,000.20
Close: 24,211.00
Change: +4.10 (+0.02%)
🏗️ Structure Breakdown
Type: Bullish candle with a long lower wick — buyers took control after an early scare
Range: ≈ 260 points — high volatility
Body: ≈ 172 points — steady buying pressure once the base held
Upper Wick: ≈ 49 points — some rejection near the highs, sellers active around 24,250
Lower Wick: ≈ 39 points — demand showed up quickly at the 24,000 base
🛡 5 Min Intraday Chart
⚔️ Gladiator Strategy Update
ATR: 261.82
IB Range: 128.60 → Medium
Market Structure: ImBalanced
Trade Highlights:
09:32 Long Trade: Trailing Target Hit (R:R 1:3.28)
10:53 Short Trade: SL Hit
11:39 Short Trade: SL Hit
13:00 Short Trade: Trailing SL Hit
Trade Summary: The early long worked out well — trailing into a 1:3.28 was the trade of the day. The two shorts after that both hit SL, which in hindsight makes sense; I was fighting a market that had already decided to recover. The 1 PM short at least trailed out instead of a full stop. A reminder for me that shorting into a steady recovery rarely pays, and patience for the right side would have kept things cleaner.
🧱 Support & Resistance Levels
Resistance Zones: 24250 | 24300 | 24360~24380 | 24460
Support Zones: 24160 | 24080 ~ 24030 | 23900 | 23785
🧠 Final Thoughts
“The day was won at the base and paused at the wall — both edges left something unsaid.”
The one thing that stood out today was how quickly demand showed up at the 24,000 level. The gap down looked scary on the open, but the base held on the very first tick and never really got tested again — that early recovery told most of the story.
For tomorrow, everything hinges on 24,250. If we gap above it and hold, the bullish push could keep going toward 24,300 and beyond. But if we open back inside the range, that rejection near the highs today is a sign to stay patient — the selling pressure there is real, and the engulfing candle suggests both sides still have something to prove.
My focus tomorrow is simple: respect the open, and don’t force a direction the market hasn’t confirmed yet. With weekly expiry in play, it’s better to wait for the level to resolve than to guess ahead of it.
✏️ Disclaimer
This is my personal digital diary and represents my own analysis and point of view. It is not financial advice; please consult a professional advisor before making any trading decisions.  Education