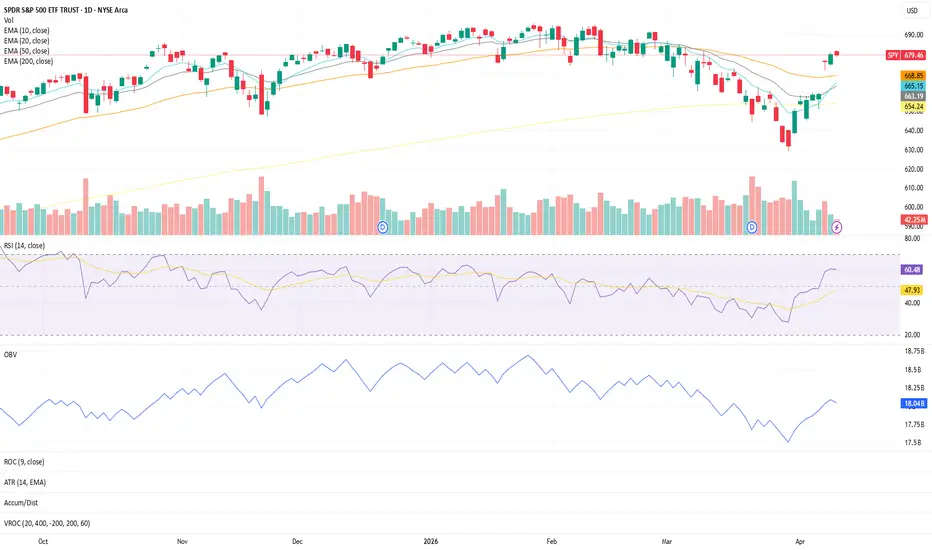
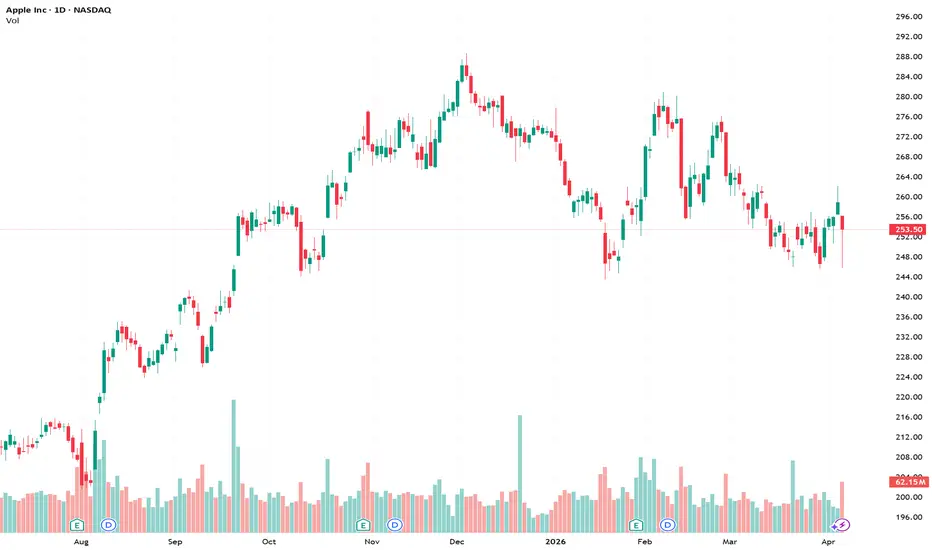
SPY Daily — Structure Holding StrongPrice continues to trade above the 10, 20, 50, and 200 EMAs, with short-term momentum building.
The 10 EMA and 20 EMA are both trending upward, showing continued short-term strength, while the 50 EMA remains flat but stable—acting as a base of support beneath price.
RSI is holding steady around 60, indicating controlled momentum without entering overbought conditions.
On the volume side, OBV has been trending higher since March 30th, suggesting underlying accumulation remains intact.
Overall, structure remains healthy with alignment across trend, momentum, and volume.
⭐️ Final Clarity Note ⭐️:
When price holds above key moving averages with steady RSI and rising OBV, it reflects participation—not just movement. Structure > Emotion.  Long
Long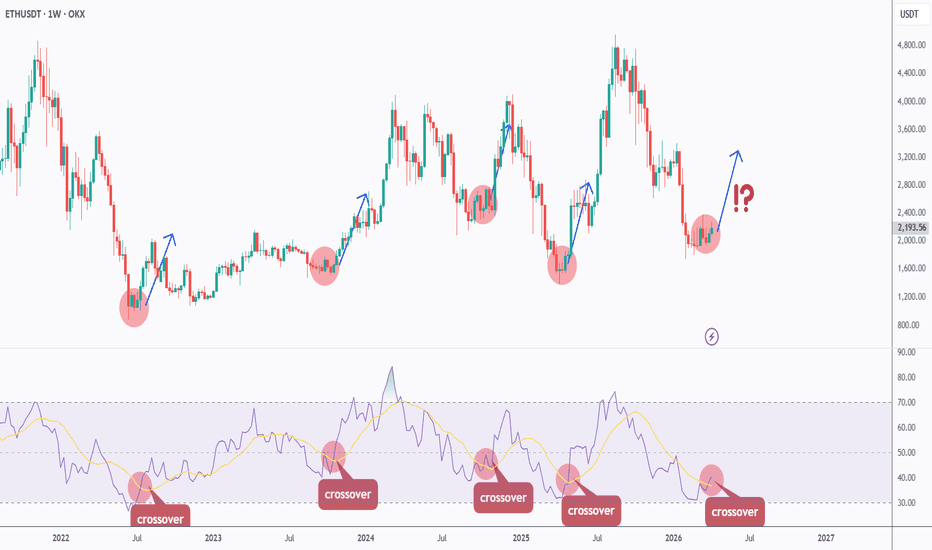
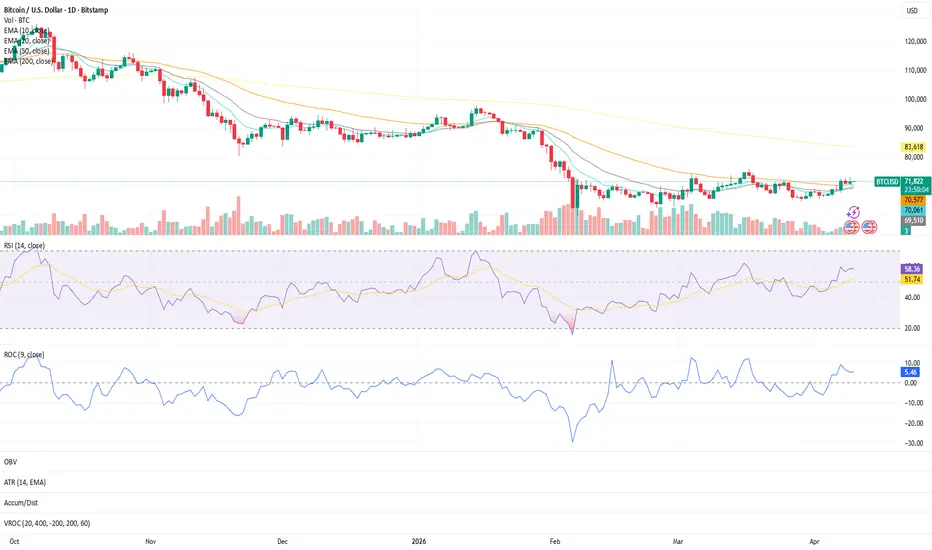
Bitcoin USD (Daily) — Structure UpdateStructure hasn’t flipped — but it’s no longer deteriorating.
Price remains below the 200 EMA, with the 10, 20, and 50 EMAs still positioned underneath it, keeping the higher timeframe trend unconfirmed.
Within that, behavior is beginning to shift.
The 10 EMA is starting to curl upward, signaling early short-term momentum. BTC has now logged two consecutive daily closes above the 50 EMA, marking a move from weakness into early stabilization.
Momentum aligns with the shift:
• RSI is holding in the high-50s with upward curvature
• ROC is positive (~5.20), slightly cooling but remaining stable
This reflects improving momentum while structure continues to rebuild beneath the 200 EMA.
The key level to monitor is the 50 EMA — holding above it supports continued stabilization, while losing it would signal the structure remains under pressure.
Summary: Structure is stabilizing, not confirmed. Momentum is improving, but the higher timeframe trend has not yet shifted.  Long
Long
Render: ready for the next leg? key levels and targets aheadRender, ready for the next leg or due a cooldown? Lately AI and GPU narratives are heating up again, and according to market chatter Render keeps popping up whenever traders talk “AI season 2.” Today price pulled back after a strong spike, but buyers stepped in fast, which tells me the dip is being hunted, not feared.
On the 4H chart price bounced off that 1.84 support block with solid reaction, while RSI cooled from overbought and curved back up above 60. Structure is still higher highs and higher lows, so for now I lean bullish, watching for continuation toward the recent wick highs around 2.20 and potentially the upper green zone. If AI headlines stay positive, I expect fresh FOMO buyers to join any clean breakout.
My base plan: as long as 1.84 holds, I treat dips into that zone as potential reloads with a target around 2.20 then 2.30+. If price nukes below 1.84 and closes under it on 4H, I step aside and look for a deeper sweep toward 1.77 or even the lower green demand. I might be wrong, but for now the trend is up and I’m trading with it, not against it. ✅  Education
Arbitrum: key targets and levels as demand zone holds strongArbitrum
Who’s watching this L2 while everyone chases memecoins? According to market chatter, Arbitrum keeps getting dev attention and ecosystem grants, but short term the token has been lagging majors. Today price dipped back into a key demand area while BTC volatility cooled, which is often where rotation plays quietly start.
On the 4H chart, ARB is sitting right on that green demand block around 0.90 where the volume profile shows a fat node of past activity. RSI has cooled off from overbought and is hovering midrange, which for me is a “reload, not panic” signal. I’m leaning long from this zone, looking for a bounce toward the upper red supply area near recent highs as sidelined buyers step back in.
My game plan: accumulate inside the green zone with invalidation below the lower demand band. Base case, we rotate up toward the local resistance cluster above, then reassess. If price breaks and holds below demand, I flip the script and look for a deeper sweep of liquidity before touching longs again. I might be wrong, but ignoring levels like this is how traders end up buying the top instead of the dip. TRUMP: ready to ride the election wave? key levels to watch!TRUMPUSDT
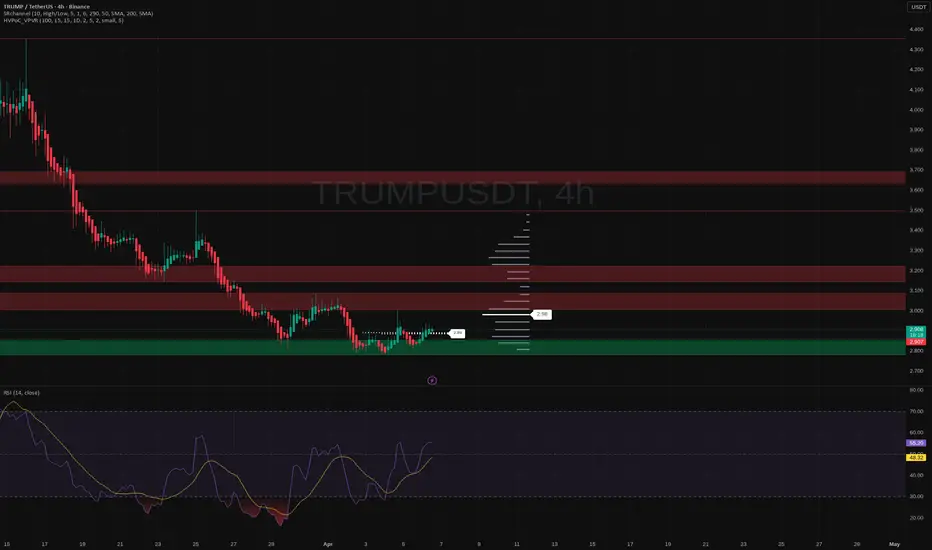
Who’s ready to trade the election meme coin instead of reading polls all day? According to market chatter, politics‑related tokens are heating up again as headlines cycle around upcoming debates and legal drama, and TRUMP has started to attract fresh volume on Binance after that long bleed‑out.
On the 4H chart we’re sitting in a big green demand block after a brutal downtrend, with RSI curling up from oversold and pushing above the midline. Volume profile shows a fat liquidity gap above current price, so if buyers manage to hold this base, I’m leaning toward a squeeze into the first red supply zone around the 3.05‑3.15 area. I might be wrong, but this has all the ingredients of a classic sentiment pop rather than a slow grind.
My plan: as long as price holds this green zone, I treat dips as potential scalps toward that 3+ range, taking profit into the red bands. ✅ If we lose the lower edge of demand and close below it on 4H, the idea is invalid and I step aside, looking for a deeper flush before trying again. I’m watching for a strong 4H candle with rising volume to confirm the move; no confirmation, no hero trades. POL: bounce potential or breakdown? key levels to observePOL – ready for one more bounce or about to fall through the floor? According to industry sources, rotation out of smaller alts has been picking up while onchain activity around POL stays modest, so price is basically drifting with overall market risk sentiment. Today we’re sitting right on that big orange demand block, so this is where bulls either wake up or surrender the range.
On the 4H chart, price is hugging the lower edge of the support zone around 0.089–0.09 while RSI is grinding near oversold, hinting at seller exhaustion rather than panic. Volume-by-price shows the main cluster slightly above current price, so any short-covering pop could quickly push us back into the 0.093–0.096 value area. With alt sentiment fragile, I still lean toward a short-term mean reversion long instead of chasing breakdown shorts here.
My base plan: as long as candles hold inside that orange box, I’m interested in a bounce toward 0.095 first, then possibly 0.10 where the next red supply band sits ✅. If we get a clean 4H close below the box, thesis is dead and I’d expect a slide to the next liquidity pocket below 0.088. I might be wrong, but for now I’m stalking reactive longs off this zone, not breakouts in no man’s land. Ondo: cooling off or just reloading? key levels to watchOndo – is the airdrop hype finally cooling off or just reloading? After the recent buzz around tokenization narratives, price has been drifting lower while the market waits for the next headline. According to industry sources, appetite for “real world asset” plays is still there, but flows have clearly rotated into newer shiny coins this week.
On the 4H chart, ONDO is grinding down toward that green demand block around 0.25, with RSI sitting in a bearish zone but close to oversold. I’m leaning short term bearish, then looking for a bounce: a sweep of the green zone and a reclaim above 0.26 could trigger a squeeze back into the mid red supply area near 0.27. If bulls can’t defend that green box, the door opens for a deeper dip into the lower demand band around 0.24.
My plan: I’m stalking a reactive long from the 0.25 demand, only if I see a clear wick rejection and RSI curling up. ✅ Upside targets for me are 0.27 first, then the upper red zone if momentum really kicks in. If price starts closing candles below 0.245, I step aside and let the knife fall lower – I might be wrong, but I’d rather miss a bounce than marry a losing bag. ENA: rebound or further decline? key levels to watch todayENA
Who’s brave enough to catch this falling knife? ENA has been getting hammered after the recent listing hype cooled off, while the broader crypto market is digesting mixed headlines about liquidity and risk appetite according to industry sources. Today’s drop flushed late longs, and you can see the market clearly hunting stops below the prior range.
On the 4H chart, price is sitting in a fresh demand pocket with RSI buried around oversold, trying to curl up. I’m leaning toward a short term relief bounce rather than chasing new shorts down here. First liquidity magnets for me are the inefficiency zones above: roughly the 0.083 area, then 0.086, and if momentum really wakes up, the 0.09 supply band where previous heavy selling came in.
My game plan: ✅ bullish scalp bias while this local low holds. If buyers defend the current base and we see a push back into 0.083, I’m interested in quick longs toward 0.086 and maybe 0.09. If price nukes straight through today’s low and closes below the demand zone, idea is invalidated and I step aside and wait for a deeper discount. I might be wrong, but fading exhausted panic on new listings has paid my bills more than once. Pi Network: could this be the bounce we’ve been waiting for?Pi Network. Tired of watching this bleed or hunting for that first real bounce? While the whole alt market is chopping on regulation headlines and ETF flows, Pi is quietly grinding at the lows, and according to industry sources the project is again popping up in community chatter around future listings. Volatility is crushed, which is usually when most traders look away right before something moves.
On the 4H chart, price is sitting right on that big orange demand shelf with a green “last line” support just below, while RSI is hovering near the oversold zone but trying to curl up. Volume by price shows a fat node above, meaning if bulls manage to reclaim that lower red zone, there’s a vacuum that can fuel a squeeze higher toward the upper resistance band. I’m leaning slightly long here, expecting a mean‑reversion pop rather than a full trend reversal.
My plan: ✅ watch for a 4H close back inside the orange band with RSI pushing above its recent swing high, then look for a move toward the mid red zone as the first target. If we lose the green support with strong volume, that bounce idea is dead and I treat any rally as a short‑the‑pop setup back into broken support. I might be wrong, but this is exactly the type of boring range where the next sharp move is born. OKB: bounce or breakdown? key levels to watch this weekOKB
Who’s watching this dip into the demand zone and thinking “is this where the bounce starts?” According to industry sources, OKX ecosystem news and steady exchange volumes keep this token on the radar, even while the broader market chops around. Today price is parked right inside a big green support block after a multi‑day bleed, so this is where bulls either wake up or get steamrolled.
On the 4H chart I see a ranging structure with repeated wicks into the same support and RSI grinding just under midline, not oversold but cooled off. I’m leaning long from this demand area, looking for a rotation back toward the mid‑range, helped by any positive liquidity or listing headlines that attract fresh buyers. If we get a strong 4H candle closing above the local mini‑range high, that’s my confirmation that sellers are finally running out of ammo.
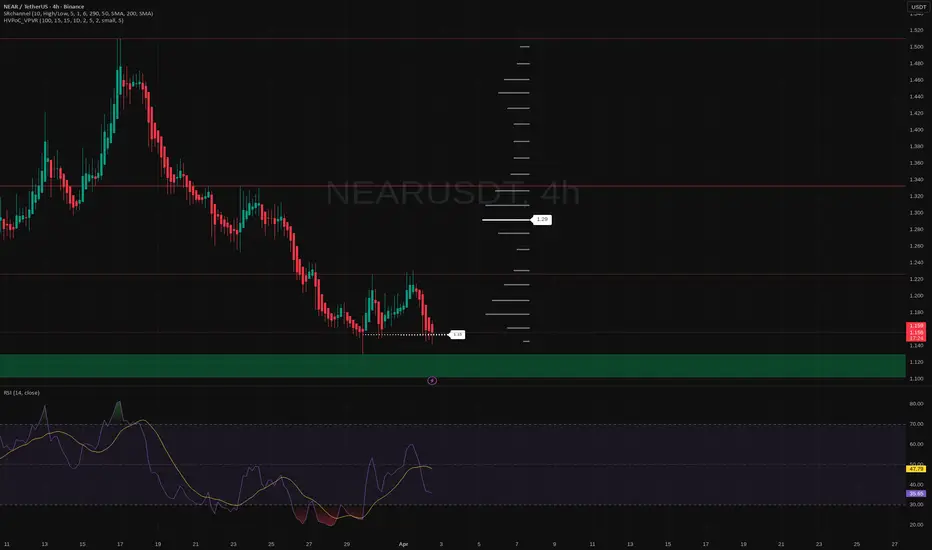
My base plan: accumulate in the green zone and target the 84–87 region first, with potential extension into the red supply blocks above if momentum kicks in. Invalid for me if price loses the lower edge of the demand area and closes below it decisively – then it opens a clean path to a deeper flush and I step aside. I might be wrong, but for now this looks like classic “buy the fear, sell the boredom” territory. NEAR: is this the bounce we've been waiting for? key levels to wNEAR Protocol – who’s watching this support zone with me? According to industry sources, interest around layer‑1s is slowly waking up again, and NEAR keeps popping up in dev activity stats, even while price has been quietly bleeding. Today price tapped back into that big green demand block that last time kicked off a decent bounce, so this level matters.
On the 4H chart, NEARUSDT is grinding along local support around 1.15 with RSI trying to curl up from near oversold. Volume has been heavier on dips into this zone, hinting at absorption rather than panic. If buyers defend this base, I’m leaning toward a relief move, with the first liquidity pocket sitting around 1.28‑1.30.
My plan: I like staggered longs inside the green zone with invalidation below roughly 1.10. Base case for me is a bounce toward 1.29, then reassess if momentum and volume confirm. ⚠️ If price closes cleanly below the zone, I step aside and let it drift toward the next supports lower – I might be wrong, but I don’t argue with a broken level. Ethereum weekly: RSI, STOCH & MACD, all bullishEthereum's weekly RSI produced a lower low in March-Feb 2026 vs March-April 2025. We know that ETHUSDT produced a very strong higher low. Here we have a hidden bullish divergence, this is a very strong signal.
At the same time, the RSI hit the lowest level since July 2022, the previous bear market bottom. This happened in early March.
Here is the chart:
There is a delay with the signals coming from the oscillators so it is good that the RSI is already rising.
The STOCH has been oversold since November 2025, printed a higher low and is ready to grow. It has very large bullish potential because of all the time it has been moving at the bottom.
The MACD reveals a bullish bias with a divergence between the histogram and the signal and MACD lines. The histogram has a higher low while the signal and MACD lines produced a lower low. A hidden bullish divergence is also present with ETHUSDT.
As you can see, all the oscillators are now bullish, the candles also.
ETHUSDT trades above all the weekly close since the 2-Feb. week, only one week closed higher in the past two months and that's the green week on the chart.
The monthly close is irrelevant now. Decision will come either from a continuation or rejection. Ether is moving up, if it continues, the bulls won. If bullish momentum is lost and there is a reversal, the bearish scenario needs to be considered. As long as ETH trades above $2,000 (or $1,900), there is no need to consider lower prices, we should focus only on the next target.
Namaste. Long 
Toncoin: ready for a bounce? key levels to watch aheadToncoin
Who’s watching this grind at the lows and wondering if it’s finally loading the spring? Recently, the sentiment around majors cooled off with traders rotating into meme and AI names, and Ton has been quietly bleeding while headlines swing between “overhyped” and “sleeping giant,” according to industry sources. That kind of boredom zone often hides the next sharp move.
On the 4H chart, price is parked just above the big green demand block, with multiple wicks rejecting deeper downside and RSI hovering near the oversold neighborhood. I’m leaning toward a bounce play here, aiming for a move back into the mid‑range, with the first liquidity pocket around 1.30‑1.33 where prior candles and volume stacked up. If buyers step in, we could see a classic mean‑reversion squeeze as late shorts scramble out.
My base plan: look for bullish 4H candles holding that green zone and I’ll favor longs toward 1.30‑1.33, then reassess for a possible push into the upper red supply band later. If this demand fails and we get a clean 4H close below the zone, the idea is invalid and I’ll step aside, watching for a deeper flush before touching it. I might be wrong, but this looks like one of those “boring now, obvious later” spots.