S&P 500: A Triangle Inside a Triangle Inside a TriangleMost market analysis looks at the next few days or weeks. This one starts with the crash of 1929.
When you step back far enough, the S&P 500 has spent the last 26 years building one of the largest patterns in its history. Look closer, and the same shape repeats inside itself, then repeats again. If my reading is correct, the market is like a spring being compressed in three layers at once, close to its final squeeze.
A Note on Credit
The long-term count on the 2.5-year chart (Chart 1) is entire
Triangle
BNB Breaks Below Triangle: Potential Reversal Zone in Focus
BNB has broken below its t riangle on the 30-minute chart, extending the decline toward the marked 728–729.50 reversal zone , derived from the previous supply projection.
I’m watching for a bullish pattern within this area, potentially following a liquidity sweep toward 727 and a reclaim of the zone. The illustrated recovery structure remains projected; buyers still need to confirm their presence.
A bullish reaction followed
SOLUSDT - Countertrend correction to 100.0BINANCE:SOLUSDT.P is testing the support of the local flat formed within the global trading range of 95.0–125.0. A long squeeze of the key liquidity zone could restore the bullish impulse.
Technically, Bitcoin continues to consolidate above the 50-day moving average and above 80K — the key support zone. Against the backdrop of Bitcoin, SOLANA looks quite promising.
The correction associated with the difficult fundamental backdrop continues. Within the local decline, SOLANA may test the liq
Silver Approaches a Potential Reversal Zone After Sharp SellingSilver Approaches a Potential Reversal Zone After Sharp Selling
Silver remains bearish on the 4-hour chart, with price consolidating inside a small triangle following a sharp decline . A breakdown could bring the marked 52.60–53.20 reversal zone into focus, using the previous supply projection as a reference.
I’m watching for a bullish engulfing candle , strong rejection, or another bullish pattern within this zone. A subsequent break above the triangle resistance would strengthen the p
Micron Might Be Getting HeavyMicron Technology hasn’t made a new high in months, and now it might be getting heavy.
The first pattern on today’s chart is the pair of converging lines since June. The memory-chip maker dropped below that triangle last week and has remained there since, which could be viewed as a breakdown.
Second, MU has been sitting at a weekly low from mid-September. However, it may be fading as support.
Third, prices have stalled under the 50-day and 100-day simple moving averages. That could reflect we
BTCUSDT - Consolidation above 80K and the 50-day moving average
BINANCE:BTCUSDT.P continues its consolidation phase above 80K — the medium-term level formed during the previous bearish cycle. This could become a fairly important prerequisite for another rally.
The BTC network hashrate has resumed growth, which indicates confidence among large financial institutions in BTC’s prospects. Inflows into BTC ETFs continue. However, the market is awaiting the results of the US vote.
Technically, on D1–W1, Bitcoin is consolidating above the key support level
GOLD - Bear Pressure. A Correction Before the Drop IC:XAUUSD technically bounces perfectly from the previously indicated resistance and breaks support at 4100, testing the intermediate target of 4066, thereby confirming the bearish market structure.
The dollar is in a correction but still maintains a bullish trend amid expectations of rising interest rates and the Fed’s hawkish stance. The oil shock remains the main driver. As long as Brent holds around $110, inflation expectations will not ease, meaning the Fed will maintain its hawkish b
Arbitrum News: Launch of Mentorship Program with RobinhoodRobinhood, aimed at supporting innovative teams on Arbitrum One and Robinhood Chain. This initiative allows teams to connect with investors and ecosystem partners, pitch at a Demo Day, and compete for a total of $100K in prizes. Such programs can significantly enhance funding opportunities and community engagement in the blockchain space.
Breaking It Down
In a notable move, Arbitrum is expanding its commitment to innovation with the launch of its Mentorship Program alongside Robinhood. This ini
XAUUSD Short: Stalls Beneath Supply as Attention Shifts to 4,070Hello traders! Here’s my technical outlook based on the current XAUUSD (3H) chart structure. XAUUSD previously declined under the Supply Line after breaking from higher levels and formed a clear range near the Demand Zone. Price then tested the Supply Zone near 4,230 several times, where sellers firmly rejected the upside.
Currently, XAUUSD is trading below the 4,230 Supply Zone while holding above the 4,070 Demand Zone. The repeated rejections from resistance and the overall descending structu
BTCUSDT: Rebounds From a Failed Breakdown as 84,300 Comes BackHello everyone, here is my breakdown of the current BTCUSDT setup.
Market Analysis
BTCUSDT previously traded inside a range and triangle structure before testing the Resistance Zone near 84,300. Price then pulled back toward the Support Zone with a fake breakout and rebounded, showing signs of buyers defending support.
Currently, BTCUSDT is trading below the 84,300 Resistance Zone while holding above the 80,700 Support Zone. The recent rebound from support suggests buyers may attempt another
Gold Faces a Reality Check After Another Rejection at 4,200$Hello traders! Here’s my technical outlook based on the current XAUUSD (1H) chart structure. XAUUSD previously started to decline under the Trend Line and formed a range near the Seller Zone. Price then tested the Resistance Level with breakouts and was rejected. Currently, XAUUSD is trading below the 4,200 Seller Zone while holding above the 4,100 Buyer Zone. The recent rejection and descending structure suggest a possible continuation lower toward support. As long as XAUUSD remains below the 4
Dollar Bears Eye a Break Below 101.60The US Dollar Index looks to be coiling in a descending triangle on the four-hourly chart, with the downtrend from the highs set earlier this week converging on horizontal support at 101.60.
Given the coiling price action and where the triangle has formed, it points to the potential for a downside break, putting 101.03, the low set on October 1, on the radar.
A break beneath 101.60 that sticks, preferably followed by a back test and rejection, could open the door for short positions with a tig
Gold 2H | One Triangle, Two Structural PossibilitiesReading time: ~3 minutes
Gold’s current structure has yet to reveal a clear direction. However, examining the geometry of the patterns and their positions within the larger wave count gives us two possible scenarios: one in which the correction may eventually support further upside, and another in which a corrective pause could precede another bearish leg.
Scenario 1 | A Larger Corrective Structure Within the Bullish Case
In the bullish count, pay attention to the earlier blue triangle positi
SOLUSDT - End of the correction. One step away from distributionBINANCE:SOLUSDT.P is breaking the resistance of the local consolidation range, which may signal the end of the correction within the bullish cycle.
After retesting the range support, Bitcoin is returning to its bullish trend again; this may support the overall market trend and may also confirm the end of the correction.
Focus on the 103.5–105.5 zone. Consolidation above this support will confirm that the correction has ended. The price may soon move into a distribution phase toward 112.8,
GOLD - A short squeeze could trigger a distribution IC:XAUUSD remains under pressure from the bearish trend. The attempt to buy back part of the decline was a phase of liquidity accumulation before the continuation of the drop. The fundamental backdrop remains weak for the metals market.
The market estimates the probability of a Fed rate hike in December at 94% (CME FedWatch). The dollar holds its gains thanks to recovering Treasury yields and high oil prices, putting pressure on gold; the dollar also received safe-haven inflows on Monday d
CHFJPY Bullish Breakout Above Symmetrical Triangle ResistanceExecutive Summary
CHFJPY is currently breaking out to the upside following a period of consolidation within a falling trendline / symmetrical wedge structure on the 4-hour timeframe. The pair has established a firm double-bottom foundation near the 188.00 support zone and continues to respect an ascending trendline off the October low. A sustained hold above the 190.00 level opens the pathway toward resistance targets near 191.27 and 192.00, representing an expected bullish upside expansion of
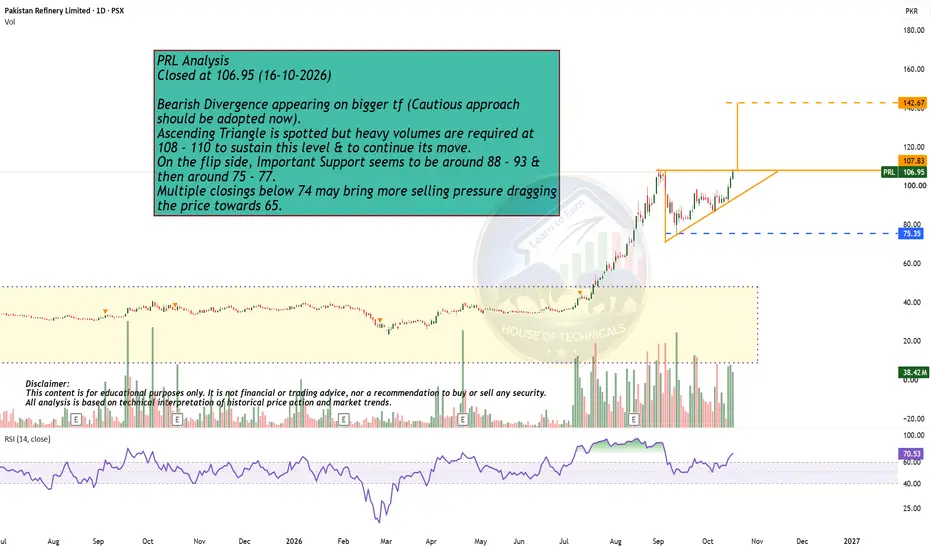
PRL LoversPRL Analysis
Closed at 106.95 (16-10-2026)
Bearish Divergence appearing on bigger tf (Cautious approach
should be adopted now).
Ascending Triangle is spotted but heavy volumes are required at
108 - 110 to sustain this level & to continue its move.
On the flip side, Important Support seems to be around 88 - 93 &
then around 75 - 77.
Multiple closings below 74 may bring more selling pressure dragging
the price towards 65.
Can Bitcoin Convert Its Latest Bounce Into a Test of 83,600?Hello traders! Here’s my technical outlook based on the current BTCUSDT (2H) chart structure. BTCUSDT previously turned around from the highs and formed a descending structure under the Trend Line. Price then entered a range, tested the Buyer Zone with fake breakouts, and bounced. Currently, BTCUSDT is trading below the 83,600 Seller Zone while holding above the 81,000 Buyer Zone and the ascending Support Line. The recent bounce from support suggests buyers are preparing for another move higher.
HYPEUSDT - Just one step away from the end of the correction...As part of a countertrend correction, BINANCE:HYPEUSDT.P is retesting a key liquidity zone. However, the bullish trend remains the primary scenario, and the end of the correction could trigger a continuation of the uptrend.
Bitcoin maintains a positive outlook amid its countertrend correction, which is also supporting bullish sentiment across the altcoin market.
A breakout above the wedge resistance and a close above the 79.400–80.00 zone could serve as a technical catalyst for further u
GOLD - A short squeeze could trigger a declineIC:XAUUSD on Friday attempted to strengthen within a strong downtrend supported by an unstable fundamental backdrop. However, the rise was stopped...
The correction in the market began after Warsh's remarks about uncertainty regarding his actions, which was interpreted as a signal for a pause rather than a rate hike. However, the dollar remains strong (bouncing from support), while aggressive oil growth and a weak fundamental backdrop are holding back gold. Escalation of the conflict in th
WTI OIL Triangle FibsI like triangle pattern because it allows to easier make interconnections via Fib Channels.
Basis: HH ➡ LH; LL➡HL
Two forces with opposite directions compress to a point and eventually price will break out. Those initial coordinates can be used to build the field of propagation that cover disturbances set by price action (fact of happening from geometric perspective)
This illustrates how price exists in a state of superposition across multiple potential outcomes.
A large triangle form