XRP XRP XRP— BULLS, ITS TIME TO WAKE UP? back in 2's very soon XRP has formed a triangle, giving us potential targets in both directions. 🎯 I’ve marked the bullish and bearish projections on the chart — now we wait to see which side wins.
🐂 BULL CASE
Historically, recent crypto bear phases have tended to run for roughly a year. If that rhythm holds, 5/6 October is an interesting date to watch. That also means the early movers of a new bull phase could start running before the wider market gets the memo. 👀
And XRP certainly has a few things going for it:
🔥 The triangle gives us a bullish target back into the $2s.
💰 ETF demand could provide additional buying power.
🐳 Last cycle, there appeared to be strong buying/support around the $2 area.
⚡ And XRP has a habit of doing very little... then suddenly doing A LOT!
Some call XRP a fundamental play.
I sometimes think it's more of a SPIKE-A-MENTAL! 😂🚀
I've used the speed of the recent move off the base to illustrate a best-case path towards the next target. Realistically, it could take considerably longer — but when XRP decides to move, it can move FAST.
Trump's involvement with crypto adds another interesting ingredient, while Brad Garlinghouse has generally proved very good at delivering the right message at the right time — and, sometimes more importantly, knowing when not to say too much. 😉
So to the XRP bulls still holding:
Relax. 😎
If this triangle resolves bullishly, I think there's a credible argument for materially higher prices over the next 30–60 days. 🚀🎯
🐻 BEAR CASE
Okay bears...
You've made enough — close those shorts and hedges now please! 😂
But there is still a very real alternative:
I'm wrong. 🤷♂️
Crypto gets one final violent flush lower before the next bull phase begins. If my October timing idea has any merit, there's still time for a nasty final shakeout before 5/6 October. 🩸🔪
And look closely at that last spike lower during the recent move up...
Glitch? 👀
Liquidity grab? 🐳
Or a little warning from the market that the bears aren't quite finished yet? 🐻
Either way, the triangle should eventually make the decision for us.
🟢🐂 BULLS vs 🐻🔴 BEARS
Triangle breaks UP → $2s back on the menu. 🚀
Triangle breaks DOWN → one last crypto wipeout could still be lurking. 💥
Let's see who blinks first. 👀🍿  Long
Long
BITCOIN - Consolidation following the NFP. There's a chance...BINANCE:BTCUSDT.P is consolidating within the 76,000–81,000 range. The key target at 83K has still not been reached, which is why it remains relevant. Yesterday’s NFP data triggered another round of liquidity collection, and the market continues to consolidate
Bitcoin continues to consolidate. Yesterday’s attempt to break through resistance failed amid the mixed NFP report. However, the market is holding the downside, with price consolidating above 79,500.
Technically, the medium-term outlook remains favorable. The flagship asset previously broke out of the global bearish trend. ETF inflows continue to increase, as does bullish sentiment. Within the current consolidation, I would highlight two key levels: 79,850 and 77,000
Resistance levels: 79850, 81300, 82850
Support levels: 79550, 77000
At the moment, price is consolidating above the intermediate 79,550 support zone, while a close above 79,850 could trigger a continuation of the local uptrend.
However, given yesterday’s news, the broader consolidation could continue, and the market maker may form a retest of the lower area of interest. The key focus is 77,000 — the second trigger. A long squeeze could also trigger an impulse toward 83K
Best regards,
R. Linda!  Long
Long
GOLD - Correction and retest of the 4460 resistance levelICMARKETS:XAUUSD continues its rebound after the false breakdown of the 4,300 support level. The fundamental backdrop remains mixed, but selling pressure is still present
The dollar is stagnating, potentially due to intervention from the Bank of Japan. The correction in the Dollar Index is giving gold room to recover. The key event is Friday’s NFP report. A weak report could support a further recovery in gold, while a strong report could bring selling pressure back. The 4,460 level remains the nearest resistance, with 4,300 acting as support.
Drivers:
Upside: weak NFP data on Friday, further dollar weakness, lower yields, technical rebound.
Downside: strong NFP data, hawkish Fed rhetoric, stronger dollar, renewed rise in oil prices
Resistance levels: 4,466, 4,480
Support levels: 4,300
The long squeeze of the 4,300 support zone has triggered a rebound, which has developed into a stronger move amid the dollar correction.
Ahead lies the 4,466–4,480 resistance zone. A short squeeze in this area could trigger a downside pullback, potentially pushing gold back into the range ahead of the NFP release.
The retest of this resistance zone and the market’s reaction to it will help determine the medium-term direction
Best regards,
R. Linda.  Short
Short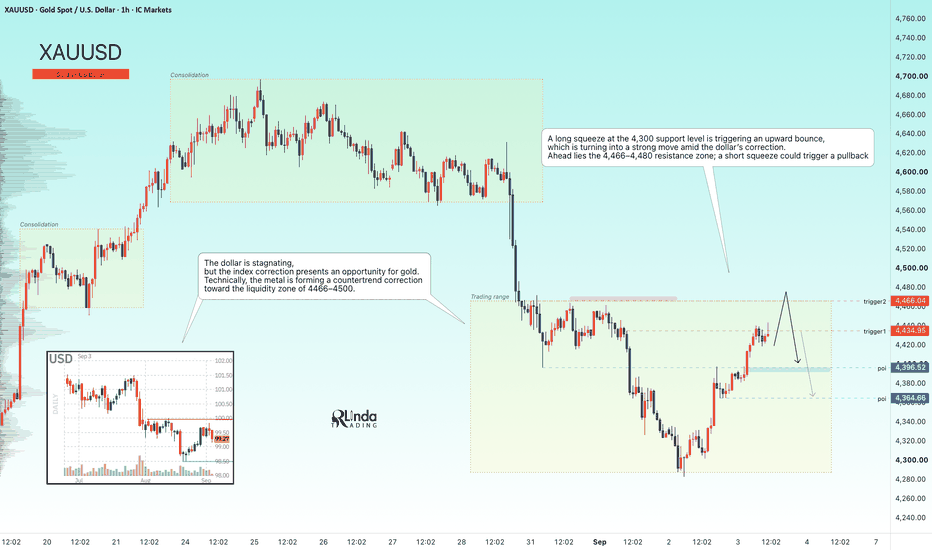
PancakeSwap Broke Its Pattern — Now It Needs to Prove ItA breakout tells you where the market wants to go. A pullback tells you whether it means it.
Before the chart, a quick word on the asset itself.
CRYPTO:CAKEUSD PancakeSwap is one of the highest-volume decentralized exchanges in the market, built primarily around CRYPTOCAP:BNB BNB Chain but now operating across multiple networks.
Its strength lies in throughput: extremely low transaction costs, deep retail liquidity, an aggressive fee-burn mechanism on CAKE, and a full ecosystem beyond simple swapping — perpetuals, liquidity provision, and prediction markets.
The weaknesses are just as honest.
The protocol remains heavily dependent on BNB Chain activity, a large share of its volume is retail and speculative rather than institutional, and emissions history has left CAKE sensitive to supply pressure despite the burn model.
In short: high activity, but cyclical demand.
That makes CRYPTOCAP:CAKE CAKE a chart that responds fast when DEX volumes wake up — and fades just as fast when they cool.
The Technical Structure
On the 4H chart, price completed a strong impulse leg and then contracted into a symmetrical triangle.
That compression resolved to the upside with a sharp expansion candle .
But notice what happened next.
Price did not follow through. It gave back most of the breakout candle and is now resting.
This is a pause, not a failure. Markets rarely move in one continuous push — they expand, exhale, and then decide.
The Setup
We are not chasing this.
The plan is to let price return to the Support Area (Pullback) around 1.72 – 1.78, which was the triangle's upper boundary before the break.
What we need there is confirmation, not hope:
A clear rejection wick from the zone
A bullish engulfing or reversal candle on the 4H close
Visible loss of downside momentum
If the market gives us that reaction, the setup becomes valid with a well-defined risk.
Pattern Target: 2.04 (100% measured move)
Mid-Term Target: 2.27 ( 161.8% extension)
Invalidation Level: 1.64
If price closes below 1.64, the entire triangle structure has failed and the idea is finished.
No adjusting, no averaging down. We step aside and wait for the next clean structure.
Right now, the correct position is observation.
Risk Warning:
This analysis is provided for educational purposes only and does not constitute financial advice. Cryptocurrency markets are highly volatile. Always use defined risk and proper position sizing.  Long
Long
JUPUSDT: Symmetrical Triangle Meets Major Trendline BreakoutUsing the 4H chart, we can see that LSE:JUP has been consolidating inside a symmetrical triangle since early May, almost four months now.
The price has spent the past week consolidating just below a formidable resistance zone between $0.2386 and $0.2525. For me, a decisive breakout above the top of this zone at $0.2525 would confirm the breakout and trigger my entry.
I’d only be interested in entering after a clean breakout above $0.2525. My stop-loss would be at $0.234, just below the entire resistance zone. A decisive move below this level would signal to me that the breakout has failed.
Using the HVF (Hunt Volatility Funnel) method to project the targets based on the height of the triangle, I get:
Target 1: $0.3225 — +27% | R/R: 3.78
Target 2: $0.40 — +58% | R/R: 7.97
The setup offers some very attractive risk/reward, especially if the breakout comes with strong volume and follow-through.
Before wrapping up, I want to zoom out to the daily chart, where we can see another factor that strengthens the bullish case here:
On the daily chart, we can see that the price recently broke above a trendline that has been respected since December 2024. The entire triangle structure that has been developing since May can be seen as a consolidation phase that ultimately set the stage for this trendline breakout and continuation to the upside.
This makes the recent move particularly interesting, as the triangle breakout is now being reinforced by a breakout above a much longer-term trendline.
 Long
Long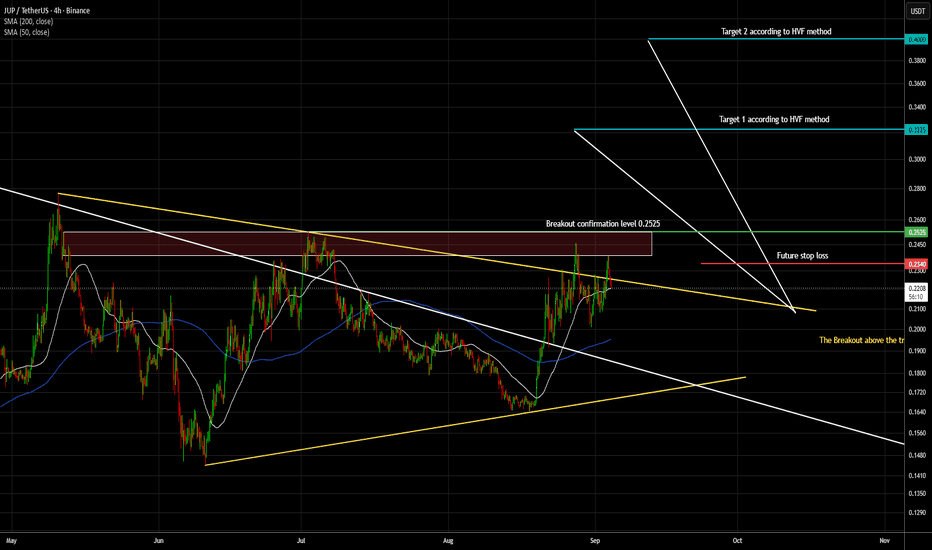
ETHUSDT - Consolidation ahead of a potential breakout and rallyBINANCE:ETHUSDT.P continues to consolidate after the strong rally, but at the moment, the market is once again testing resistance within yesterday’s rally...
Bitcoin is consolidating near the 83K resistance, which represents a technical retracement zone from the previous bearish cycle. A close above 83K could trigger a bullish impulse, providing additional support for the altcoin market.
From a broader perspective, Ethereum has not declined after the strong rally. A three-week consolidation is forming. At the same time, the retest of the 2,356 support ended with a bounce and a local rally, after which the market moved back into consolidation near resistance. This increases the probability of an upside breakout.
Today, all attention is focused on NFP. Weak data could strengthen the bullish trend, while hawkish signals could trigger a correction, in which case the market may continue consolidating.
Resistance levels: 2,550, 2,620, 2,790
Support levels: 2,450, 2,356
There are several possible scenarios. As part of a local pre-breakout consolidation, Ethereum could test 4,500 before moving higher. However, gradual compression toward resistance could trigger an upside breakout. A close above the level could become the technical catalyst for a move toward 2,620–2,790
Best regards,
R. Linda!  Long
Long
BITCOIN - Consolidation Following Strong GrowthBINANCE:BTCUSDT.P , after a strong rally, has entered a consolidation phase near the resistance formed by the technical retracement of the previous bear cycle. What happens next?
Bitcoin previously broke the structure of its bearish trend, but it has still not tested the 83,000 technical retracement zone, which also represents a liquidity pool. Therefore, we can assume that this target remains relevant within the current local bullish trend.
After the strong rally, price has been consolidating for two weeks without forming a significant pullback. This can also be viewed as a bullish indication and a potential setup for further upside.
Technically, the market remains in consolidation. Price is showing a relatively weak reaction to the conflict escalation and has not declined despite the strong rally. A long squeeze of the 76,800–76,300 zone could develop before the move higher toward the 83K target.
The market remains bullish
Resistance levels: 79,500, 81,200, 83,000
Support levels: 76,800, 76,400, 75,600
A false breakdown of support as part of a liquidity-hunting phase, followed by consolidation above the 76,400–76,853 zone, could become a technical catalyst for further upside
Best regards,
R. Linda. Long 
 Long
Long
 Long
Long
 Long
Long
 Long
Long
 Long
Long
Long 
Long 
ETHUSD: Ascending Triangle Breakout & Execution PlanOverview
1. Technical Analysis & Chart Structure
Ethereum (ETHUSD) on the 1-Day Bitstamp chart is demonstrating a clear Ascending Triangle consolidation pattern following a sharp impulse move off its summer lows.
Support Zone ($2,387 – $2,500): This horizontal boundary serves as the main support level. It aligns with previous resistance, creating a key area where buyers are stepping in.
Dynamic Trend (50 EMA): The 50-day Exponential Moving Average (the blue line) is curving upward, offering dynamic trend confirmation below the recent breakout.
Major Overhead Resistance ($2,923.6): A significant historical peak and volume-weighted resistance area where temporary consolidation or profit-taking is expected.
Macro Target Resistance ($3,325.0): The top of the larger macro range representing the ultimate bullish target upon a clean continuation.
2. Trade Execution Rules
When to Enter (Buy Conditions):
Conservative Retest Entry: Look for a entry around $2,450 – $2,500 if price retests the top of the triangle and prints a daily bullish confirmation candle (such as a pin bar or bullish engulfing candle).
Aggressive Momentum Entry: Enter on a strong daily candle close above $2,520 to capture immediate continuation towards $2,923.6.
When NOT to Enter (Avoid/Invalidation):
Inside Triangle Re-entry: Avoid buying if the daily candle closes back inside the triangle consolidation (below $2,387), as this signals a potential bull trap.
Low-Volume Breakouts: Do not enter if the price advances without volume expansion, indicating a lack of institutional backing.
Directly Into Resistance: Avoid opening new long positions immediately beneath $2,923.6 or $3,325.0, where risk-to-reward ratios deteriorate.
3. Fundamental Context & Risk Management
Fundamental Environment: The broader bias remains supported by recent institutional demand, steady ETH ETF spot inflows, and growing network activity across Layer-2 platforms.
Stop-Loss Placement: Placed below the critical confluence zone at $2,380 to invalidate the setup if the pattern fails.
Take-Profit Targets:
Target 1: $2,923.6 (Risk-to-Reward Ratio ~1:3.5)
Target 2: $3,325.0 (Risk-to-Reward Ratio ~1:6.8)
Position Sizing: Limit individual trade risk to 1–2% of total trading capital.
DISCLAIMER: This analysis is for educational and informational purposes only and does not constitute financial, investment, or trading advice. Always manage your risk carefully and conduct your own research before placing trades.
Long 
Short 
 Long
Long
BTCUSDT Short: Supply Zone Reaction Could Drive Price LowerHello traders! Here’s my technical outlook based on the current BTCUSDT (2H) chart structure. BTCUSDT previously broke higher from a range and tested the Supply Zone near 79,600, where it faced rejection from the Supply Line. Price then pulled back and is now trading below the Supply Zone while holding above the 77,000 Demand Zone.
Currently, the rejection from the Supply Zone and the descending Supply Line suggest that a short-term bearish continuation may develop toward the 77,000 Demand Zone.
As long as BTCUSDT remains below the 79,600 Supply Zone and fails to break above recent highs, the bearish scenario remains valid. A continuation lower could push price toward the 77,000 Demand Zone (TP1). However, a break above 79,600 would weaken the bearish outlook. Manage your risk! Short 
BTCUSDT: Triangle Support and Zone Point to Further UpsideHello everyone, here is my breakdown of the current BTCUSDT setup.
Market Analysis
BTCUSDT previously traded inside a range before breaking out strongly and shifting bullish. Price then advanced higher, tested the 81,000 Resistance Zone twice (TEST and RETEST), where sellers rejected the upside.
Currently, BTC is trading below the 81,000 Resistance Zone while holding above the Support Zone and the ascending Triangle Support Line. The recent pullback suggests a possible retest of support before another move higher.
My Scenario & Strategy
As long as BTCUSDT remains above the Support Zone and respects the Triangle Support Line, the bullish scenario remains valid. A successful rebound from support could push price toward the 81,000 Resistance Zone (TP1).
However, a breakdown and close below the Support Zone or Triangle Support Line would weaken the bullish outlook and increase the risk of further downside.
That’s the setup I’m tracking. Thank you for your attention, and always manage your risk. Long 
Options Blueprint [Int]: Trade a Bullish Bias Without ChasingBullish does not have to mean chasing price
A constructive chart can create a surprisingly difficult decision. When several technical signals point higher, the instinct may be to express that view with direct directional exposure.
But technical evidence is rarely unanimous.
WTI Crude Oil futures provide a useful case study. On the daily CL chart captured on September 2, price was around 90.62. Recent evidence has become constructive, but the broader chart contains signals pointing in both directions.
That raises a different question for an options trader:
Instead of asking how high price might go, can the position be structured so that the bullish thesis is allowed to be imperfect?
The chart is constructive, but not unanimous
Several technical elements support a bullish-to-sideways interpretation.
The market previously formed a falling wedge, generally interpreted as potentially bullish following an upside breakout. More recently, price compressed inside a triangle and then moved above that structure.
At the same time, the 13-, 21-, and 55-period simple moving averages shown on the chart are below the current market.
Those observations support the bullish side of the argument.
However, the chart also contains an earlier double top, traditionally considered a bearish formation. A substantial decline already followed that pattern, so it should not necessarily receive the same weight as the more recent triangle. Still, its presence illustrates an important point: technical patterns should not simply be counted as votes.
Recency, location and subsequent price behavior matter.
Crude oil can also react sharply to unexpected supply developments, macroeconomic surprises and event-driven volatility. The result is not an unequivocally bullish environment, but one in which recent evidence leans upward while meaningful uncertainty remains.
That is precisely where an options structure can change the problem.
Changing the question with a bull put spread
The illustrative structure shown in the chart uses September 17 options:
Sell the 86 put
Buy the 81 put
Net credit: approximately 1.10 points
With CL around 90.62 when the chart was captured, the short strike already sits below the market.
More importantly, the expiration breakeven is approximately 84.90.
That changes what the market needs to do.
A directly bullish futures position generally requires price appreciation to create a favorable result. With this credit spread, CL could rise, move sideways or decline moderately while still remaining above the expiration breakeven.
The question therefore becomes less about:
“How high can crude oil go?”
and more about:
“How much can the original bullish thesis be wrong before the structure is challenged?”
That distinction is the central lesson of this Options Blueprint.
The expiration geometry
The strikes are 5.00 points apart.
Receiving 1.10 points initially leaves 3.90 points of defined maximum terminal risk before commissions and fees.
For standard-sized WTI options, one full price point represents $1,000 per contract. The illustrative structure therefore translates to approximately:
Initial credit: $1,100
Maximum defined terminal risk: $3,900
Expiration breakeven: 84.90
The breakeven calculation is straightforward:
86.00 short strike − 1.10 credit = 84.90
At expiration, a settlement at or above 86 would leave both puts out of the money and preserve the full initial credit.
Between 84.90 and 86, part of that credit would remain.
Below 84.90, the expiration result becomes adverse, with maximum defined terminal risk reached below the 81 long strike.
Comparing the 1.10-point maximum credit with the 3.90-point maximum defined risk produces an illustrative reward-to-risk ratio of approximately 0.28:1.
That ratio should not be viewed in isolation. The structure intentionally exchanges limited maximum credit for a wider range of underlying prices that can remain compatible with the original thesis.
The target is a condition, not an upside forecast
This is where the bull put spread differs from a conventional directional setup.
The chart may contain considerably higher technical objectives, but the options structure does not require CL to reach them.
For this case study, the primary target condition is simply for the underlying to remain at or above the 86 short strike at expiration.
Continued upside would be compatible with the structure, but it is unnecessary.
The potential direction of crude oil and the objective of the spread are therefore two different things.
That is what it means to express a bullish bias without chasing price.
Where the thesis becomes vulnerable
Defined risk does not mean insignificant risk.
A meaningful move back through the recent triangle would weaken the technical reasoning supporting the position. Movement below the 86 short strike would place the spread in an increasingly sensitive area, while movement below the 84.90 breakeven would move the expiration profile to the adverse side of the original calculation.
For this illustrative case study, a decisive daily close below 84.90 can be treated as an invalidation trigger requiring reassessment rather than simply waiting for expiration.
The 81 long put defines the terminal downside boundary of the spread. It should not be confused with a technical stop.
Allowing a position to reach its maximum defined risk is not, by itself, a risk-management plan.
Why negative gamma matters
Calling a bull put spread simply “bullish” can hide an important part of its behavior.
At the TradingView Options Analytics snapshot shown on the chart, the spread had positive delta and negative gamma.
Positive delta means the position initially carries bullish directional exposure.
Negative gamma means that directional exposure changes unfavorably if the underlying falls. As crude oil moves toward the short strike, the spread can become increasingly sensitive to additional downside. If crude oil rises, its positive directional sensitivity generally declines.
In other words, the structure provides room below the current market, but that room is not free.
The snapshot also showed positive theta. With other variables unchanged, the passage of time therefore works in favor of the theoretical value of the credit spread.
Changes in implied volatility can still materially affect the position before expiration.
This is why an expiration diagram should never be mistaken for a complete description of pre-expiration risk.
CL, MCL and different contract scales
Standard WTI Crude Oil futures, ticker CL, represent 1,000 barrels. A $0.01 move represents $10 per contract.
Micro WTI Crude Oil futures, ticker MCL, represent 100 barrels. A $0.01 move represents $1 per contract.
MCL is therefore one-tenth the size of CL.
The same scaling concept exists in the options market. Standard WTI options represent 1,000 barrels, while Micro WTI options, ticker MCO, represent 100 barrels.
Micro WTI options are financially settled, while standard WTI options settle into the corresponding CL futures contract.
If an equivalent Micro spread were available at the same 1.10-point credit, its dollar scale would be approximately one-tenth of the standard-sized illustration:
Initial credit: approximately $110
Maximum defined terminal risk: approximately $390
Actual Micro option premiums should always be evaluated independently rather than assumed to match the standard-sized contract.
The analytical thesis can therefore remain similar while the dollar exposure changes substantially.
Margin is not maximum risk
Margin and maximum risk are different concepts.
CME Group's WTI product information showed estimated futures margins of $8,700 for CL and $870 for MCL as of September 2, 2026.
Those are futures margin estimates.
They are not the margin requirement for the illustrative options spread, and they are not measures of maximum loss.
Options and portfolio margin requirements depend on the positions involved and applicable SPAN calculations, and margin requirements can change as market conditions change.
For the spread illustrated here, the $3,900 maximum terminal risk in the standard-sized example comes from the five-point distance between the strikes minus the 1.10-point initial credit.
It does not come from a futures margin figure.
Keeping margin and maximum risk separate is essential when evaluating futures options structures.
The broader lesson
Technical analysis does not need to produce certainty before it becomes useful.
In this case, a bullish falling wedge, a more recent triangle breakout and moving averages positioned below price provide constructive evidence.
An earlier bearish double top provides counter-evidence.
None of those observations determines what happens next.
Instead of trying to eliminate uncertainty, the options structure can be designed around it.
The bull put spread expresses a bullish-to-sideways bias while shifting the crucial level from the current market around 90.62 to an expiration breakeven near 84.90.
Continued upside is compatible with the thesis but unnecessary.
Moderate imperfection in the directional view is built into the structure.
That is the transferable lesson:
Sometimes the more useful question is not where the market is going, but how much room the position gives the analysis to be wrong.
Data Consideration
When charting futures, the data provided could be delayed. Traders working with the ticker symbols discussed in this idea may prefer to use CME Group real-time data plan on TradingView: www.tradingview.com - This consideration is particularly important for shorter-term traders, whereas it may be less critical for those focused on longer-term trading strategies.
General Disclaimer
The trade ideas presented herein are solely for illustrative purposes forming a part of a case study intended to demonstrate key principles in risk management within the context of the specific market scenarios discussed. These ideas are not to be interpreted as investment recommendations or financial advice. They do not endorse or promote any specific trading strategies, financial products, or services. The information provided is based on data believed to be reliable; however, its accuracy or completeness cannot be guaranteed. Trading in financial markets involves risks, including the potential loss of principal. Each individual should conduct their own research and consult with professional financial advisors before making any investment decisions. The author or publisher of this content bears no responsibility for any actions taken based on the information provided or for any resultant financial or other losses.  Education


