RSI Divergence Entry Engine [trade_w_samet]🎯 RSI Divergence Entry Engine
RSI Divergence Entry Engine is a pivot-confirmed RSI divergence, optional trend-filtering, ATR-based trade-mapping, historical visualization, alert, and statistics indicator designed to help traders study how regular bullish and bearish RSI divergences can be converted into a structured chart workflow.
The script is built around one central idea:
A confirmed RSI divergence should be treated as analytical context first, and as a tracked trade setup only when the active direction filter and trade-state rules allow it.
The engine identifies regular RSI divergence between confirmed RSI pivots and corresponding price pivots.
When a divergence is confirmed, the script can:
• Display the divergence inside the RSI panel
• Fill the region between the RSI path and its divergence reference line
• Draw a three-layer neon divergence line directly between the corresponding price pivots on the main chart
• Evaluate the active trend-filter mode
• Open one tracked bullish or bearish setup when the signal is eligible
• Calculate an ATR-based Stop Loss
• Calculate TP1, TP2, and TP3
• Extend risk/reward boxes while the trade remains active
• Preserve completed trade boxes and historical TP price labels
• Track TP3 wins, Stop Losses, Win Rate, NET R, Average R, and Profit Factor
• Display a full desktop dashboard or a compact mobile dashboard
• Send separate TradingView alert conditions
• Support one combined “Any alert() function call” workflow
• Apply Dark Mode, Light Mode, or Mobile Theme styling
The indicator includes:
• Fixed RSI 14 calculation using closing prices
• Pivot-based regular bullish divergence detection
• Pivot-based regular bearish divergence detection
• Adjustable Pivot Lookback
• Adjustable Confirmation Bars
• A fixed internal pivot-distance window
• Confirmed-bar divergence acceptance
• RSI-panel bullish and bearish divergence lines
• RSI-panel divergence-area fills
• Main-chart three-layer neon divergence lines
• Adjustable main-chart BULLISH / SELL label size
• Fixed compact RSI-panel labels
• Dark Mode
• Light Mode
• Mobile Theme
• EMA 200 Trend Filter
• Supertrend filter using ATR 10 and factor 3.0
• Higher-timeframe EMA 200 Trend Filter
• Adjustable higher timeframe
• ATR-based Stop Loss
• Adjustable ATR period
• Adjustable ATR Stop Loss multiplier
• Adjustable TP3 target from 1R to 7R
• Automatically calculated TP1 and TP2
• One active tracked trade at a time
• Conservative same-candle TP3 / SL handling
• Permanent historical TP / SL boxes
• Historical TP1, TP2, and TP3 price labels
• Dynamic active-trade price labels
• TP3 TARGET HIT labels
• Stop Loss result labels
• Full desktop statistics dashboard
• Two-row Mobile Theme dashboard
• Static alertcondition() support
• Dynamic alert() support
• “Any alert() function call” compatibility
• Bold-italic visual text
• Pure-white Dark Mode label text
• Hidden status-line input values
• Main-chart overlay visuals from a separate RSI pane
• Loaded-history trade statistics
The purpose of the script is to provide a transparent visual framework for reviewing confirmed RSI divergence, directional context, mapped risk, target structure, and bar-based historical outcomes.
It is not financial advice.
It is not an automated trading system.
It does not execute broker orders.
It does not calculate position size.
It does not guarantee that a divergence will produce a reversal.
It does not guarantee that the displayed Win Rate, NET R, or Profit Factor will continue in future market conditions.
It does not include spread, commission, slippage, latency, financing, or partial fills.
It does not reproduce the exact intrabar path inside historical candles.
━━━━━━━━━━━━━━━━━━━━━━
📌 OVERVIEW
━━━━━━━━━━━━━━━━━━━━━━
At a high level, RSI Divergence Entry Engine does the following:
• Calculates RSI using a fixed 14-period length and closing prices.
• Searches the RSI series for confirmed pivot lows and pivot highs.
• Compares each confirmed RSI pivot with the previous eligible pivot of the same type.
• Compares the corresponding price low or high with the prior price pivot.
• Identifies regular bullish divergence when RSI forms a higher low while price forms a lower low.
• Identifies regular bearish divergence when RSI forms a lower high while price forms a higher high.
• Requires the distance between the two confirmed pivots to remain inside the fixed internal range window.
• Waits for the required right-side confirmation bars before accepting a pivot.
• Displays confirmed divergence inside the RSI panel.
• Draws the same confirmed price-pivot relationship on the main chart with a neon line.
• Evaluates the selected trend-filter mode.
• Rejects a tracked entry when the trend filter does not allow that direction.
• Rejects a tracked entry when an opposite divergence is simultaneously present.
• Rejects a tracked entry while another trade is active.
• Opens a tracked trade at the close of the divergence-confirmation candle.
• Calculates Stop Loss distance from ATR.
• Places TP1 and TP2 at proportional distances inside the final TP3 target.
• Tracks only TP3 as the winning exit.
• Tracks Stop Loss as a -1R loss.
• Extends the active profit and loss boxes until the trade closes.
• Preserves completed boxes as historical trade visuals.
• Preserves historical TP1, TP2, and TP3 price labels.
• Updates the dashboard with bar-based historical statistics.
• Provides separate static alerts and combined dynamic alerts.
The script does not use machine-learning prediction.
It does not claim that RSI divergence predicts the future with certainty.
Its dashboard is not TradingView Strategy Tester.
Its statistics are calculated internally from the script’s own bar-touch rules.
━━━━━━━━━━━━━━━━━━━━━━
🧠 CORE IDEA
━━━━━━━━━━━━━━━━━━━━━━
RSI divergence describes disagreement between price direction and RSI pivot direction.
A regular bullish divergence occurs when:
• price forms a lower low
• RSI forms a higher low
A regular bearish divergence occurs when:
• price forms a higher high
• RSI forms a lower high
The divergence can indicate that momentum is not confirming the newest price extreme.
However, divergence alone does not answer:
• whether the broader trend supports the reversal
• whether price is above or below a long-term directional reference
• whether Supertrend agrees with the signal
• whether the selected higher timeframe agrees with the signal
• where a volatility-adjusted Stop Loss should be mapped
• where intermediate and final targets should be displayed
• whether another tracked trade is already active
• whether historical bar touches reached TP3 or Stop Loss first
• how the signal behaves across Dark, Light, or Mobile layouts
The script therefore combines the divergence calculation with an optional trend filter and a fixed trade-tracking model.
The complete workflow is:
RSI pivot confirmation
→ price-pivot comparison
→ regular divergence confirmation
→ RSI-panel visualization
→ main-chart neon price-divergence line
→ optional trend-filter validation
→ one-active-trade check
→ entry at confirmation-candle close
→ ATR-based Stop Loss
→ TP1 / TP2 / TP3 mapping
→ historical bar-touch tracking
→ TP3 or SL result
→ dashboard statistics
→ static and dynamic alerts
The modules are not intended to operate as unrelated indicators.
Each module supports the same process: identifying a confirmed divergence, deciding whether it is eligible for tracking, mapping the trade structure, and recording the result under explicit rules.
━━━━━━━━━━━━━━━━━━━━━━
🧩 WHY THIS SCRIPT IS NOT A SIMPLE RSI DIVERGENCE MARKER
━━━━━━━━━━━━━━━━━━━━━━
A basic RSI divergence script can stop after drawing a line between two oscillator pivots.
RSI Divergence Entry Engine continues beyond that step.
A confirmed divergence can move through the following stages:
RSI pivot appears
→ right-side confirmation bars complete
→ previous eligible RSI pivot is located
→ pivot distance is validated
→ corresponding price pivots are compared
→ bullish or bearish divergence is confirmed
→ RSI divergence region is displayed
→ main-chart neon price-divergence line is displayed
→ active trend filter is evaluated
→ opposite-direction conflict is rejected
→ existing active-trade state is checked
→ ATR risk distance is calculated
→ entry, SL, TP1, TP2, and TP3 are stored
→ trade boxes extend through time
→ TP3 or SL is detected
→ completed trade is added to statistics
→ historical TP prices remain visible
The RSI module identifies the momentum disagreement.
The trend-filter module defines whether the tracked entry is directionally permitted.
The ATR module adapts the Stop Loss distance to current volatility.
The target module translates the chosen TP3 R multiple into three visual target levels.
The trade-state module prevents overlapping tracked positions.
The statistics module summarizes the outcomes produced by those exact rules.
The alert module communicates divergence, entry, TP3, and Stop Loss events.
This coordinated process makes the publication an entry-engine framework rather than only a divergence drawing tool.
━━━━━━━━━━━━━━━━━━━━━━
⚙️ HOW THE SCRIPT WORKS
━━━━━━━━━━━━━━━━━━━━━━
The indicator operates from a separate RSI pane while using force-overlay visuals for selected elements on the main chart.
The internal RSI configuration is:
• RSI length: 14
• Source: close
• Regular bullish divergence: enabled
• Regular bearish divergence: enabled
• Hidden bullish divergence: internally disabled
• Hidden bearish divergence: internally disabled
• Minimum pivot separation: 5 bars
• Maximum pivot separation: 60 bars
The user controls:
• Pivot Lookback
• Confirmation Bars
• Main-chart signal-label size
• ATR Period
• Stop Loss Distance in ATR
• TP3 Target in R
• Trend Filter
• Higher-Timeframe Trend Timeframe
• Theme Mode
First, the script calculates RSI:
osc = ta.rsi(close, 14)
The script then detects confirmed RSI pivots:
pivotLowValue = ta.pivotlow(osc, lbL, lbR)
pivotHighValue = ta.pivothigh(osc, lbL, lbR)
A pivot is not known on the pivot candle itself.
It becomes confirmed only after the selected Confirmation Bars have closed to its right.
The script then retrieves the previous confirmed pivot value, price value, and pivot bar.
Regular bullish divergence requires:
• current RSI pivot low above the previous RSI pivot low
• current price low below the previous price low
• valid pivot distance
• confirmed current chart bar
Regular bearish divergence requires:
• current RSI pivot high below the previous RSI pivot high
• current price high above the previous price high
• valid pivot distance
• confirmed current chart bar
The confirmed divergence is then displayed in two places:
• RSI pane
• Main price chart
The trend filter is applied only to the tracked trade entry.
This means a confirmed divergence can remain visible even when:
• the selected trend filter rejects the direction
• another trade is already active
• bullish and bearish conditions conflict on the same calculation
This separation is intentional.
The divergence visual represents analytical context.
The main-chart BULLISH or SELL trade label represents an entry that the tracking engine actually accepted.
━━━━━━━━━━━━━━━━━━━━━━
📉 RSI CALCULATION
━━━━━━━━━━━━━━━━━━━━━━
The Relative Strength Index is calculated from closing prices using a fixed length of 14.
The RSI line is displayed in blue.
The RSI pane includes:
• 70 Overbought line
• 50 Middle line
• 30 Oversold line
Dark Mode uses:
• black RSI-panel background
• red Overbought line
• white dotted Middle line
• green Oversold line
Light Mode uses:
• white RSI-panel background
• dark Middle line
• red Overbought line
• green Oversold line
The 70 and 30 lines provide visual context.
They are not mandatory divergence conditions.
A bullish divergence can be detected outside the Oversold region.
A bearish divergence can be detected outside the Overbought region.
The script does not require RSI to cross 30 or 70 before accepting a divergence.
━━━━━━━━━━━━━━━━━━━━━━
🔍 PIVOT DETECTION MODEL
━━━━━━━━━━━━━━━━━━━━━━
Pivot Lookback controls the number of candles examined on the left side of a potential RSI pivot.
The default value is 5.
Higher values generally produce larger and less frequent swing points.
Lower values generally produce smaller and more frequent swing points.
Confirmation Bars controls the number of completed candles required on the right side of the potential pivot.
The default value is 1.
A higher Confirmation Bars value provides more right-side confirmation but increases delay.
A lower value confirms earlier but can identify smaller structures.
The script also requires the previous pivot to be between 5 and 60 bars away.
These minimum and maximum distance values are fixed internally to keep the public settings panel compact.
The pivot model is symmetrical:
• pivot lows are used for bullish divergence
• pivot highs are used for bearish divergence
━━━━━━━━━━━━━━━━━━━━━━
🟢 REGULAR BULLISH DIVERGENCE
━━━━━━━━━━━━━━━━━━━━━━
A regular bullish divergence is confirmed when:
• a new RSI pivot low is confirmed
• the previous eligible RSI pivot low exists
• the current RSI pivot low is higher than the previous RSI pivot low
• the current corresponding price low is lower than the previous price low
• the pivot distance is between the fixed internal limits
• the current calculation bar is confirmed
Conceptually:
Price:
lower low
RSI:
higher low
The RSI pane displays:
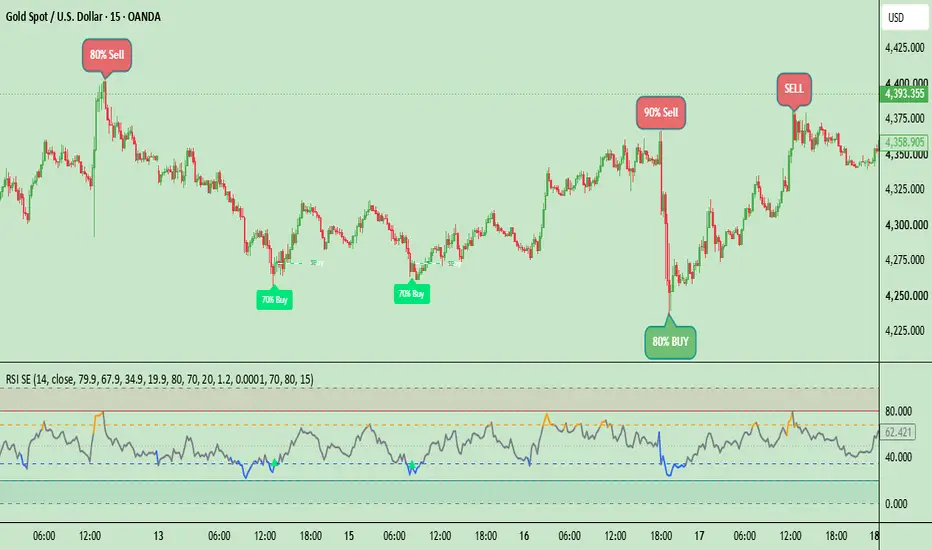
• a green divergence line between the two RSI pivot values
• a translucent green fill between the real RSI path and the straight divergence reference
• a BULLISH label at the confirmed pivot location
The main chart displays:
• a three-layer green neon line between the corresponding price lows
A tracked bullish trade opens only when:
• the bullish divergence is not opposed by a bearish divergence on the same calculation
• the selected trend filter allows bullish entries
• no tracked trade is currently active
• another trade did not close on the same candle
• ATR is available and greater than zero
The tracked entry price is the close of the confirmation candle.
It is not the historical pivot-low price.
━━━━━━━━━━━━━━━━━━━━━━
🔴 REGULAR BEARISH DIVERGENCE
━━━━━━━━━━━━━━━━━━━━━━
A regular bearish divergence is confirmed when:
• a new RSI pivot high is confirmed
• the previous eligible RSI pivot high exists
• the current RSI pivot high is lower than the previous RSI pivot high
• the current corresponding price high is higher than the previous price high
• the pivot distance is between the fixed internal limits
• the current calculation bar is confirmed
Conceptually:
Price:
higher high
RSI:
lower high
The RSI pane displays:
• a red divergence line between the two RSI pivot values
• a translucent red fill between the real RSI path and the straight divergence reference
• a SELL label at the confirmed pivot location
The main chart displays:
• a three-layer red neon line between the corresponding price highs
A tracked bearish trade opens only when:
• the bearish divergence is not opposed by a bullish divergence on the same calculation
• the selected trend filter allows bearish entries
• no tracked trade is currently active
• another trade did not close on the same candle
• ATR is available and greater than zero
The tracked entry price is the close of the confirmation candle.
It is not the historical pivot-high price.
━━━━━━━━━━━━━━━━━━━━━━
⏳ PIVOT CONFIRMATION AND SIGNAL TIMING
━━━━━━━━━━━━━━━━━━━━━━
This section is important.
The script uses ta.pivotlow() and ta.pivothigh().
Pivot functions require candles to the right of the pivot before confirmation.
For example, when Confirmation Bars is 1:
• the potential pivot occurs
• one additional candle closes
• the pivot becomes confirmed
• the divergence condition can then be calculated
The RSI-panel divergence line and RSI divergence label are drawn at the original pivot-bar location after confirmation.
The main-chart neon divergence line also connects the original price-pivot bars after the divergence is confirmed.
This creates a historical visual relationship between the two pivots.
It does not mean the divergence was available in realtime on the original pivot candle.
The tracked trade entry is not placed back on the pivot.
The tracked entry occurs at the close of the later candle where the divergence confirmation becomes available.
Therefore, users must distinguish between:
Pivot Visualization
Shows where the confirmed historical pivots occurred.
Trade Entry Label
Shows the candle where the script actually accepted and opened the tracked setup.
Changing Confirmation Bars changes the confirmation delay.
Increasing Confirmation Bars can materially change signal timing and historical divergence output.
━━━━━━━━━━━━━━━━━━━━━━
✨ MAIN-CHART NEON DIVERGENCE VISUALS
━━━━━━━━━━━━━━━━━━━━━━
Confirmed RSI divergences are also displayed directly on the main price chart.
Bullish divergence:
• connects the two corresponding price lows
• uses green
• uses a three-layer neon appearance
Bearish divergence:
• connects the two corresponding price highs
• uses red
• uses a three-layer neon appearance
The neon effect is created from:
• a wide transparent outer glow
• a medium inner glow
• a bright two-pixel core line
The neon line is a historical divergence visual.
It is not an entry line.
It is not a Stop Loss.
It is not a support or resistance guarantee.
The line is created only after the RSI pivot and divergence have been confirmed.
Older line objects are removed when the configured internal object limit is exceeded.
Deleting an older visual object does not change the underlying signal calculation.
━━━━━━━━━━━━━━━━━━━━━━
🎨 RSI DIVERGENCE AREA SYSTEM
━━━━━━━━━━━━━━━━━━━━━━
Inside the RSI pane, the script creates a filled polygon between:
• the actual RSI path from the first pivot to the second pivot
• the straight divergence line connecting those pivot endpoints
Bullish divergence uses a translucent green fill.
Bearish divergence uses a translucent red fill.
The purpose is to make the momentum disagreement easier to recognize than a thin line alone.
The fill does not measure probability.
A larger visual area does not automatically mean a stronger or more profitable divergence.
The fill depends on:
• RSI movement between the pivots
• distance between the pivots
• selected Pivot Lookback
• selected Confirmation Bars
• chart symbol
• timeframe
• loaded historical data
━━━━━━━━━━━━━━━━━━━━━━
🧭 TREND FILTER SYSTEM
━━━━━━━━━━━━━━━━━━━━━━
The trend filter determines whether a confirmed divergence is eligible to open a tracked trade.
Available modes are:
• Off
• EMA Trend
• Supertrend
• HTF Trend
The filter does not hide the confirmed divergence visuals.
It only changes whether the trade engine accepts the bullish or bearish entry.
This allows users to study:
• all confirmed divergence structures
• only the subset that passed the selected directional filter
The active trend reference is drawn on the main chart when a filter mode is selected.
The reference is green when the active filter state is bullish.
The reference is red when the active filter state is bearish.
━━━━━━━━━━━━━━━━━━━━━━
📈 EMA TREND FILTER
━━━━━━━━━━━━━━━━━━━━━━
EMA Trend uses a fixed chart-timeframe EMA 200.
Bullish entries are allowed when:
• chart close is above EMA 200
Bearish entries are allowed when:
• chart close is below EMA 200
When price equals the EMA exactly, neither directional condition is satisfied.
The EMA filter is intended to align bullish divergence tracking with price above a long-term average and bearish divergence tracking with price below it.
It does not guarantee that price will continue in the filtered direction.
A divergence rejected by the EMA filter can still remain visible as a divergence visual.
━━━━━━━━━━━━━━━━━━━━━━
📊 SUPERTREND FILTER
━━━━━━━━━━━━━━━━━━━━━━
Supertrend mode uses fixed internal parameters:
• ATR length: 10
• factor: 3.0
Bullish entries are allowed when the Supertrend state is bullish.
Bearish entries are allowed when the Supertrend state is bearish.
The Supertrend reference is displayed on the main chart.
The fixed parameters keep the public settings menu simple and make behavior consistent across users.
The Supertrend filter can react differently across symbols and timeframes because ATR and price structure differ.
A bullish Supertrend state does not guarantee a successful bullish divergence trade.
A bearish Supertrend state does not guarantee a successful bearish divergence trade.
━━━━━━━━━━━━━━━━━━━━━━
⏱️ HIGHER-TIMEFRAME TREND FILTER
━━━━━━━━━━━━━━━━━━━━━━
HTF Trend compares the selected higher-timeframe close with its EMA 200.
Bullish entries are allowed when:
• higher-timeframe close is above higher-timeframe EMA 200
Bearish entries are allowed when:
• higher-timeframe close is below higher-timeframe EMA 200
The default higher timeframe is 240 minutes.
The request uses:
• gaps_off
• lookahead_off
The script does not intentionally request future higher-timeframe data.
However, the currently forming higher-timeframe candle can continue changing until that higher-timeframe candle closes.
This means the realtime HTF filter state can change while the active higher-timeframe candle is still developing.
Users who require fully closed higher-timeframe confirmation should account for this timing characteristic when interpreting realtime signals.
Changing the HTF Trend Timeframe recalculates historical eligibility.
━━━━━━━━━━━━━━━━━━━━━━
🎯 ENTRY MODEL
━━━━━━━━━━━━━━━━━━━━━━
The indicator uses the close of the divergence-confirmation candle as the tracked entry reference.
A bullish trade is opened when:
• valid bullish divergence is confirmed
• no bearish divergence conflict exists
• bullish trend permission is true
• no trade is active
• no trade closed on the same candle
• ATR is valid
A bearish trade uses the mirrored conditions.
The entry is stored at close.
The script then calculates:
• ATR-based risk distance
• Stop Loss
• TP1
• TP2
• TP3
Only signals that actually open a tracked trade receive the main-chart BULLISH or SELL entry label.
A divergence visual without an entry label can therefore indicate:
• trend-filter rejection
• existing active trade
• same-candle direction conflict
• same-candle previous trade closure
• unavailable ATR
━━━━━━━━━━━━━━━━━━━━━━
🛑 ATR STOP LOSS MODEL
━━━━━━━━━━━━━━━━━━━━━━
Risk distance is calculated as:
ATR × Stop Loss Distance.
Default settings:
• ATR Period: 14
• Stop Loss Distance: 2.0 ATR
Bullish trade:
Stop Loss = entry − risk distance
Bearish trade:
Stop Loss = entry + risk distance
ATR adapts the raw price distance to current market volatility.
The script does not examine:
• market structure below the bullish signal
• market structure above the bearish signal
• spread
• instrument tick value
• account size
• position size
• broker margin
• contract specifications
The ATR Stop Loss is a visual and statistical model.
It is not a broker order.
━━━━━━━━━━━━━━━━━━━━━━
🏆 TP1 / TP2 / TP3 MODEL
━━━━━━━━━━━━━━━━━━━━━━
The user selects the final TP3 target from 1R to 7R.
The default is 2R.
TP1 and TP2 are placed automatically inside the final target distance.
TP1:
one-third of the TP3 distance
TP2:
two-thirds of the TP3 distance
For a 3R TP3 setting:
• TP1 = 1R
• TP2 = 2R
• TP3 = 3R
For a 2R TP3 setting:
• TP1 ≈ 0.67R
• TP2 ≈ 1.33R
• TP3 = 2R
TP1 and TP2 are visual guide levels.
The current statistics engine does not close partial positions at TP1 or TP2.
It does not move Stop Loss to break even after TP1 or TP2.
It does not add partial R profit when TP1 or TP2 is touched.
Only TP3 is counted as a winning trade.
A Stop Loss is counted as -1R.
━━━━━━━━━━━━━━━━━━━━━━
🚦 ONE ACTIVE TRADE AT A TIME
━━━━━━━━━━━━━━━━━━━━━━
The trade engine maintains one active tracked position.
While a trade is active:
• new bullish divergence entries are not opened
• new bearish divergence entries are not opened
• divergence visuals can still appear
• historical divergence lines can still be drawn
This prevents overlapping tracked positions from affecting the statistics model.
A new trade is also prevented from opening on the same candle that the previous trade closes.
The next eligible divergence must occur on a later candle.
This design keeps each tracked result independent under the script’s internal accounting rules.
━━━━━━━━━━━━━━━━━━━━━━
⚠️ TP3 / SL SAME-CANDLE HANDLING
━━━━━━━━━━━━━━━━━━━━━━
Historical OHLC candles do not reveal the exact sequence of every intrabar price movement.
A candle can contain both:
• the TP3 price
• the Stop Loss price
When both are touched inside the same candle, the script cannot know from OHLC data which level occurred first.
The engine uses a conservative rule:
Stop Loss receives priority.
The trade is recorded as a loss.
TP3 and Stop Loss checks begin on the candle after entry.
The entry candle cannot immediately close the tracked trade.
This avoids assuming an unknown movement sequence inside the entry candle.
The conservative priority rule can produce different outcomes from lower-timeframe or tick-based execution reconstruction.
━━━━━━━━━━━━━━━━━━━━━━
📦 TRADE BOX VISUAL SYSTEM
━━━━━━━━━━━━━━━━━━━━━━
Each tracked trade creates two main-chart boxes:
Profit Box
Extends from entry to TP3.
Stop Box
Extends from entry to Stop Loss.
Bullish and bearish trades use the same green profit-area and red risk-area color logic.
While the trade remains active, the boxes extend to the current bar.
When the trade closes, the boxes stop at the exit candle and remain visible historically.
The boxes help visualize:
• entry timing
• risk distance
• final target distance
• trade duration
• exit candle
The boxes are chart drawings.
They are not broker orders.
Older boxes are deleted when the internal historical object limit is exceeded.
━━━━━━━━━━━━━━━━━━━━━━
🏷️ ACTIVE AND HISTORICAL PRICE LABELS
━━━━━━━━━━━━━━━━━━━━━━
During an active tracked trade, the right side of the chart displays dynamic labels for:
• ENTRY
• SL
• TP1
• TP2
• TP3
Each label includes the current stored price.
The labels move to the newest bar while the trade remains active.
On the exit candle, the final prices remain visible for that calculation.
When the trade closes, permanent historical labels are created for:
• TP1
• TP2
• TP3
These historical labels remain attached to the completed trade’s right edge.
The purpose is to preserve the target-price structure after the active dynamic labels disappear.
Historical TP labels do not indicate that TP1 or TP2 was actually touched.
They display the planned target prices for the completed tracked trade.
The final result is determined only by TP3 or Stop Loss.
━━━━━━━━━━━━━━━━━━━━━━
✅ RESULT LABELS
━━━━━━━━━━━━━━━━━━━━━━
When TP3 is reached, the script prints:
TARGET HIT
The trade is counted as a win equal to the selected TP3 R value.
When Stop Loss is reached, the script prints:
SL
The trade is counted as a -1R loss.
Result labels are displayed at the corresponding exit price.
All visible chart labels use bold-italic typography.
Dark Mode label text uses pure white.
Light Mode uses dark text where required for contrast.
━━━━━━━━━━━━━━━━━━━━━━
🎨 THEME SYSTEM
━━━━━━━━━━━━━━━━━━━━━━
The indicator includes three theme modes:
• Dark Mode
• Light Mode
• Mobile Theme
Dark Mode
Designed for dark TradingView layouts.
It uses:
• black RSI-panel background
• dark dashboard surface
• white dashboard text
• pure-white chart-label text
• red brand accents
• green bullish visuals
• red bearish visuals
Light Mode
Designed for light TradingView layouts.
It uses:
• white RSI-panel background
• white dashboard surface
• dark dashboard text
• dark chart-label text where appropriate
• red brand accents
• adjusted divergence transparency
Mobile Theme
Designed for smaller screens.
It uses:
• compact main-chart labels
• smaller RSI labels
• tiny price labels
• a two-row dashboard
• Win Rate
• NET R
Mobile Theme does not display the full desktop statistics table.
Theme selection changes presentation.
It does not change the underlying divergence, trend-filter, or trade calculations.
━━━━━━━━━━━━━━━━━━━━━━
📟 DASHBOARD
━━━━━━━━━━━━━━━━━━━━━━
Dark Mode and Light Mode display the full bottom-right dashboard.
The header displays:
• RSI DIVERGENCE
• selected TP3 R value
• active Trend Filter
The full dashboard includes:
Status
Possible values:
• NO ACTIVE TRADE
• ACTIVE BUY
• ACTIVE SELL
Closed Trades
Number of completed tracked trades.
TP3 Wins
Number of trades that reached TP3 before Stop Loss under the script’s bar-touch rules.
Losses
Number of trades recorded at Stop Loss.
Win Rate
TP3 Wins divided by Closed Trades.
NET R
Gross Profit R minus Gross Loss R.
Gross Profit
Sum of winning TP3 R values.
Gross Loss
Number of losing trades expressed as R because every Stop Loss equals -1R.
Average / Trade
NET R divided by Closed Trades.
Profit Factor
Gross Profit R divided by Gross Loss R.
Mobile Theme displays only:
• Win Rate
• NET R
The dashboard is placed on the main chart even though the indicator calculates in a separate RSI pane.
━━━━━━━━━━━━━━━━━━━━━━
📊 STATISTICS METHODOLOGY
━━━━━━━━━━━━━━━━━━━━━━
The statistics are produced by the script’s internal bar-based trade tracker.
They are not imported from a broker.
They are not verified account results.
They are not TradingView Strategy Tester results.
Win Rate:
wins / closed trades
Gross Profit R:
wins × selected TP3 R
Gross Loss R:
losses × 1R
NET R:
Gross Profit R − Gross Loss R
Average R:
NET R / closed trades
Profit Factor:
Gross Profit R / Gross Loss R
When there are profitable trades but no recorded losses, the script displays 999 as a finite placeholder instead of mathematical infinity.
The statistics do not include:
• TP1 partial profits
• TP2 partial profits
• break-even exits
• trailing stops
• spread
• commission
• slippage
• swap
• latency
• order rejection
• partial fills
• position sizing
• account equity
• compounding
• taxes
Statistics depend on:
• loaded chart history
• selected symbol
• timeframe
• data provider
• Pivot Lookback
• Confirmation Bars
• Trend Filter
• HTF Trend Timeframe
• ATR Period
• Stop Loss multiplier
• TP3 target
• historical-data revisions
Changing any of these inputs can change historical results.
━━━━━━━━━━━━━━━━━━━━━━
🚨 ALERT SYSTEM
━━━━━━━━━━━━━━━━━━━━━━
The script includes static TradingView alert conditions for:
• Regular Bullish Divergence
• Hidden Bullish Divergence
• Regular Bearish Divergence
• Hidden Bearish Divergence
• BUY Entry
• SELL Entry
• TP3 Hit
• Stop Loss Hit
Regular bullish and bearish divergence are enabled in the current public configuration.
Hidden bullish and hidden bearish divergence logic is internally disabled.
The hidden alert choices can therefore appear in TradingView’s alert-condition list, but no hidden divergence event is produced while the internal hidden-divergence switches remain disabled.
The script also includes dynamic alert() calls for:
• BUY entry
• SELL entry
• TP3 hit
• Stop Loss hit
Dynamic BUY and SELL messages can include:
• tradewsamet identifier
• chart ticker
• chart timeframe
• entry price
• TP1 price
• TP2 price
• TP3 price
• Stop Loss price
• final R target
• active Trend Filter
This allows one TradingView alert using:
Any alert() function call
to receive all dynamic entry and result events.
━━━━━━━━━━━━━━━━━━━━━━
🔔 HOW TO USE ALERTS
━━━━━━━━━━━━━━━━━━━━━━
For a specific static event:
1. Add RSI Divergence Entry Engine to the chart.
2. Open TradingView’s Create Alert window.
3. Select the indicator as the condition.
4. Choose the required event.
5. Select the notification method.
6. Use an appropriate frequency.
7. Test the alert before relying on it.
For one combined dynamic workflow:
1. Add the indicator to the chart.
2. Open Create Alert.
3. Select RSI Divergence Entry Engine .
4. Select Any alert() function call.
5. Configure the delivery method.
6. Test BUY, SELL, TP3, and SL message handling.
When the script, settings, symbol, or timeframe changes materially, recreate existing alerts.
A TradingView alert can continue using the script snapshot stored when the alert was created.
Alerts are monitoring tools.
They do not execute, modify, or close broker orders.
━━━━━━━━━━━━━━━━━━━━━━
🧪 HOW TO USE THE INDICATOR
━━━━━━━━━━━━━━━━━━━━━━
A practical workflow:
1. Add RSI Divergence Entry Engine to a standard candlestick chart.
2. Select Dark Mode, Light Mode, or Mobile Theme.
3. Begin with Pivot Lookback set to 5.
4. Begin with Confirmation Bars set to 1.
5. Observe the RSI-panel divergence structures.
6. Observe the matching neon price-pivot lines on the main chart.
7. Remember that the pivot visual becomes available only after right-side confirmation.
8. Distinguish the neon divergence line from the later tracked entry label.
9. Begin with Trend Filter set to Off when studying raw divergence frequency.
10. Test EMA Trend for chart-timeframe directional alignment.
11. Test Supertrend for volatility-based directional alignment.
12. Test HTF Trend for higher-timeframe EMA context.
13. Verify the selected HTF timeframe.
14. Review the main-chart trend reference.
15. Observe whether a BULLISH or SELL entry label is accepted.
16. Review ENTRY, SL, TP1, TP2, and TP3 prices.
17. Observe the profit and risk boxes.
18. Remember that TP1 and TP2 are visual only.
19. Review the final TARGET HIT or SL result.
20. Review dashboard Win Rate and NET R.
21. Compare Dark/Light full dashboard with Mobile Theme.
22. Use alerts for monitoring rather than blind execution.
23. Review broader market structure independently.
24. Review spread, liquidity, volatility, and news conditions.
25. Define personal account risk and position size.
26. Test the exact symbol, timeframe, and data feed personally used.
The indicator is designed for structured study and monitoring.
It should not be treated as an automatic decision-maker.
━━━━━━━━━━━━━━━━━━━━━━
⚙️ SETTINGS REFERENCE
━━━━━━━━━━━━━━━━━━━━━━
🎨 Theme
Theme Mode
Dark Mode
Uses the full dark visual profile.
Light Mode
Uses the full light visual profile.
Mobile Theme
Uses compact labels and a two-row dashboard.
━━━━━━━━━━━━━━━━━━━━━━
🎯 Signal Settings
Pivot Lookback
Controls the left-side pivot search width.
Default:
5
Higher values generally create larger and less frequent pivot structures.
Confirmation Bars
Controls the number of right-side completed candles required to confirm the RSI pivot.
Default:
1
Increasing the value increases confirmation delay.
Chart Signal Label Size
Controls the main-chart BULLISH and SELL entry-label size.
Available values:
• Tiny
• Small
• Normal
• Large
• Huge
Mobile Theme overrides the selected size with a compact layout.
━━━━━━━━━━━━━━━━━━━━━━
🧭 Trend Filter
Trend Filter
Available modes:
• Off
• EMA Trend
• Supertrend
• HTF Trend
Off
Allows tracked bullish and bearish entries without directional trend filtering.
EMA Trend
Uses chart close relative to EMA 200.
Supertrend
Uses ATR 10 and factor 3.0.
HTF Trend
Uses selected higher-timeframe close relative to higher-timeframe EMA 200.
HTF Trend Timeframe
Selects the higher timeframe used by HTF Trend.
Default:
240 minutes
This setting has no effect when HTF Trend is not selected.
━━━━━━━━━━━━━━━━━━━━━━
🛡️ Trade Management
ATR Period
Controls the ATR used for risk-distance calculations.
Default:
14
Stop Loss Distance (ATR)
Multiplies ATR to calculate the Stop Loss distance.
Default:
2.0
TP3 Target (R)
Selects the final target from 1R to 7R.
Default:
2R
TP1 and TP2 are calculated automatically from the TP3 distance.
All public input values are hidden from TradingView’s status line to reduce chart-header clutter.
━━━━━━━━━━━━━━━━━━━━━━
🧠 WHAT MAKES THIS SCRIPT ORIGINAL
━━━━━━━━━━━━━━━━━━━━━━
RSI, divergence, EMA, Supertrend, ATR, risk/reward targets, and trade statistics are established technical-analysis concepts.
These concepts are not unique by themselves.
The originality of RSI Divergence Entry Engine lies in the coordinated workflow applied to them:
fixed RSI calculation
→ confirmed oscillator pivots
→ price / RSI regular divergence comparison
→ pivot-distance validation
→ RSI-path divergence filling
→ main-chart three-layer neon pivot lines
→ optional chart or higher-timeframe trend filtering
→ one-active-trade state
→ confirmation-candle entry
→ ATR-normalized Stop Loss
→ proportional TP1 / TP2 placement
→ adjustable TP3 R target
→ conservative OHLC exit handling
→ permanent risk/reward history
→ historical target-price labels
→ theme-aware chart output
→ mobile-specific dashboard
→ internal R-based statistics
→ static and dynamic alert workflows
Distinctive implementation features include:
• separating divergence context from accepted tracked entries
• displaying the same confirmed divergence in the RSI pane and on the main chart
• filling the RSI path-to-divergence region
• using a three-layer neon price-divergence line
• preserving trade boxes after closure
• preserving TP1, TP2, and TP3 planned prices historically
• allowing multiple direction-filter models inside one entry workflow
• maintaining one tracked trade at a time
• applying conservative Stop Loss priority when TP3 and SL share a candle
• offering theme-specific dashboard behavior
• reducing the Mobile Theme dashboard to Win Rate and NET R
• supporting static conditions and combined dynamic alert() messages
• keeping public settings compact while documenting fixed internal values
The script is not a collection of unrelated indicators placed on one chart.
Every component supports the same objective: converting a confirmed RSI divergence into a transparent, filterable, volatility-mapped, historically reviewable entry framework.
━━━━━━━━━━━━━━━━━━━━━━
⚠️ IMPORTANT PRACTICAL NOTES
━━━━━━━━━━━━━━━━━━━━━━
Signal frequency depends on:
• symbol
• timeframe
• data provider
• Pivot Lookback
• Confirmation Bars
• fixed 5–60 bar pivot-distance window
• Trend Filter
• HTF Trend Timeframe
• existing active-trade state
• ATR availability
• available historical data
Higher Pivot Lookback values can reduce frequency.
Higher Confirmation Bars values increase delay.
EMA Trend can reject counter-position signals relative to EMA 200.
Supertrend can change direction after price movement.
HTF Trend can remain sensitive to the currently developing higher-timeframe candle.
Only one tracked trade can be active.
A divergence can therefore be visible without becoming a tracked trade.
TP1 and TP2 are not partial exits.
Historical TP1, TP2, and TP3 labels display planned prices, not proof that every level was touched.
Dashboard statistics use loaded chart history only.
Different brokers or exchanges can produce different:
• highs
• lows
• closes
• RSI pivots
• ATR values
• divergence signals
• trend-filter states
• TP3 / SL outcomes
• dashboard statistics
Changing the chart’s available history can change the first eligible pivot pair and all later trade-state sequencing.
━━━━━━━━━━━━━━━━━━━━━━
⚠️ LIMITATIONS AND SHORTCOMINGS
━━━━━━━━━━━━━━━━━━━━━━
This script has important limitations:
It does not guarantee profitable trades.
It does not predict future price movement.
It does not execute orders.
It does not place broker Stop Loss orders.
It does not place broker Take Profit orders.
It does not calculate position size.
It does not calculate account risk.
It does not include spread.
It does not include commission.
It does not include slippage.
It does not include latency.
It does not include swap or financing.
It does not model partial fills.
It does not model order rejection.
It does not model contract specifications.
It does not model tick-by-tick execution.
It uses historical OHLC bars.
It cannot always determine whether TP3 or SL occurred first inside one candle.
It resolves same-candle TP3 / SL ambiguity in favor of Stop Loss.
It does not record TP1 or TP2 as partial profit.
It does not move Stop Loss to break even.
It does not trail Stop Loss.
It maintains one active tracked trade.
It can ignore otherwise valid new entries while a trade is active.
It uses pivot confirmation.
Pivot visuals are not available on the original pivot candle in realtime.
RSI pivot visuals are placed at the historical pivot location after confirmation.
Main-chart neon lines are created after divergence confirmation.
The HTF filter can change while the current higher-timeframe candle remains open.
A confirmed divergence can fail.
A trend-aligned divergence can fail.
A larger divergence area does not guarantee a stronger result.
A neon divergence line is not guaranteed support or resistance.
A TARGET HIT label is not broker-verified execution.
Dashboard statistics are not audited performance.
Profit Factor displays 999 when wins exist without recorded losses.
Changing settings recalculates historical conditions.
Changing symbol, timeframe, provider, or available history can change output.
Alert delivery depends on TradingView and user configuration.
Alerts do not guarantee broker execution.
For these reasons, the indicator should be used as an educational decision-support and chart-review tool, not as a standalone automated strategy.
━━━━━━━━━━━━━━━━━━━━━━
👤 WHO THIS SCRIPT MAY BE USEFUL FOR
━━━━━━━━━━━━━━━━━━━━━━
This script may be useful for traders who:
• understand basic RSI divergence
• want regular bullish and bearish divergence visuals
• prefer pivot-confirmed structures
• want divergence displayed in both RSI and price
• want a clear neon main-chart divergence line
• want optional trend filtering
• use EMA 200
• use Supertrend
• use higher-timeframe direction
• want ATR-based risk mapping
• want adjustable R targets
• want historical risk/reward boxes
• want historical planned TP prices
• want one-active-trade statistics
• want Dark, Light, and Mobile themes
• want static alerts
• want one combined dynamic alert
• understand that chart statistics are not verified trading results
It may be less suitable for users who:
• want signals on the unconfirmed pivot candle
• want no pivot delay
• want hidden divergence enabled publicly
• want every divergence to open a trade
• want multiple overlapping tracked trades
• want partial TP accounting
• want automatic break-even management
• want trailing stops
• want tick-level backtesting
• want verified Strategy Tester results
• want broker execution
• want guaranteed reversal signals
• expect a high Win Rate to continue unchanged
• expect the HTF filter to remain fixed before the higher-timeframe candle closes
━━━━━━━━━━━━━━━━━━━━━━
🧭 BEST PRACTICE SUGGESTIONS
━━━━━━━━━━━━━━━━━━━━━━
For studying raw divergence behavior:
• use Trend Filter Off
• begin with Pivot Lookback 5
• begin with Confirmation Bars 1
• observe divergence visuals before evaluating trades
• distinguish pivot location from confirmation timing
For trend-aligned divergence:
• test EMA Trend
• test Supertrend
• compare signal frequency
• review whether the filter removes useful countertrend setups
For broader directional context:
• test HTF Trend
• use a higher timeframe meaningfully above the chart timeframe
• remember that the active HTF candle can change before closing
For trade mapping:
• begin with ATR 14
• begin with Stop Loss Distance 2.0 ATR
• begin with TP3 2R
• remember that TP1 and TP2 are visual only
• review same-candle TP3 / SL cases conservatively
For chart clarity:
• use Dark Mode on dark chart layouts
• use Light Mode on light chart layouts
• use Mobile Theme on small screens
• adjust the main-chart entry-label size
• use neon divergence lines as context, not automatic entries
Always:
• wait for divergence confirmation
• review broader price structure
• review liquidity and volatility
• review session conditions
• review news risk
• define personal account risk
• define personal position size
• test the exact symbol and timeframe
• verify alerts before relying on them
• remember that every divergence can fail
━━━━━━━━━━━━━━━━━━━━━━
🔓 PUBLICATION NOTE
━━━━━━━━━━━━━━━━━━━━━━
RSI Divergence Entry Engine is published as an educational RSI-divergence, directional-filtering, ATR trade-mapping, historical-visualization, and alert tool.
The purpose of this description is to explain:
• how RSI is calculated
• how RSI pivot lows and highs are confirmed
• how Pivot Lookback affects structure selection
• how Confirmation Bars affect delay
• how the fixed pivot-distance window works
• how regular bullish divergence is identified
• how regular bearish divergence is identified
• how divergence is displayed inside the RSI pane
• how the RSI divergence area is filled
• how corresponding price pivots are displayed with neon lines
• when the pivot visuals become available
• why pivot visuals appear at historical pivot locations
• why tracked entries are placed on confirmation-candle close
• how the trend filter affects entries without hiding divergence context
• how EMA Trend works
• how Supertrend works
• how HTF Trend works
• how currently forming higher-timeframe candles affect realtime context
• how ATR risk distance is calculated
• how Stop Loss is placed
• how TP1, TP2, and TP3 are calculated
• why TP1 and TP2 are visual only
• why only TP3 counts as a win
• how one-active-trade handling works
• how same-candle TP3 / SL ambiguity is resolved
• how historical trade boxes are retained
• what historical TP labels represent
• how Dark Mode, Light Mode, and Mobile Theme differ
• what the dashboard displays
• how Win Rate, NET R, Average R, and Profit Factor are calculated
• why the statistics are not broker-verified
• what static alert conditions are available
• how “Any alert() function call” works
• what the script does not simulate
• why the combined modules form one coordinated workflow
The script is designed to support structured review.
It does not promise profitable results.
It does not remove market risk.
It does not replace independent analysis.
It does not replace personal risk management.
━━━━━━━━━━━━━━━━━━━━━━
🕒 REPAINTING, BACKPLOTTING, AND TIMING DISCLOSURE
━━━━━━━━━━━━━━━━━━━━━━
RSI Divergence Entry Engine uses pivot functions.
Pivot confirmation requires future candles relative to the original pivot location.
The number of required right-side candles is controlled by Confirmation Bars.
The script does not know that a pivot exists on the original pivot candle.
After the right-side candles close:
• the pivot becomes confirmed
• the divergence can be calculated
• the RSI divergence line is displayed at the historical pivot locations
• the RSI divergence label is displayed at the confirmed pivot location
• the main-chart neon line connects the corresponding historical price pivots
This historical placement is a visual back-reference to the confirmed pivot structure.
It must not be interpreted as a realtime signal that was available on the original pivot candle.
The tracked trade entry is not backdated.
The tracked trade opens at the close of the later confirmation candle when all entry rules are valid.
The main-chart BULLISH or SELL entry label appears on that confirmation candle.
Trade outcome checks begin on the following candle.
The HTF Trend request uses lookahead_off.
It does not intentionally access future higher-timeframe values.
However, the current higher-timeframe candle can continue developing in realtime until it closes.
Historical results can change when:
• Pivot Lookback changes
• Confirmation Bars changes
• Trend Filter changes
• HTF Trend Timeframe changes
• ATR settings change
• TP3 target changes
• chart symbol changes
• timeframe changes
• exchange or broker feed changes
• historical data is revised
• available chart history changes
Confirmed chart-bar calculations reduce unfinished current-chart-candle changes.
They do not remove pivot confirmation delay, historical pivot placement, HTF live-candle variation, data-feed differences, or market risk.
━━━━━━━━━━━━━━━━━━━━━━
🛡️ DISCLAIMER
━━━━━━━━━━━━━━━━━━━━━━
RSI Divergence Entry Engine is provided for educational and informational purposes only.
It does not constitute financial, investment, trading, legal, accounting, or tax advice.
No indicator can guarantee future results.
Markets are uncertain.
Momentum changes.
Volatility changes.
Trend changes.
Liquidity changes.
Historical chart behavior does not ensure future performance.
Every user is responsible for their own:
• analysis
• validation
• symbol selection
• timeframe selection
• trend-filter selection
• execution planning
• Stop Loss placement
• target planning
• position sizing
• risk management
• alert configuration
• trading decisions
• broker execution
• legal obligations
• tax obligations
The RSI pivots, divergence lines, divergence fills, neon price-pivot lines, trend references, BULLISH labels, SELL labels, ENTRY labels, Stop Loss levels, TP1 levels, TP2 levels, TP3 levels, trade boxes, historical target labels, TARGET HIT labels, SL labels, dashboard statistics, Win Rate, NET R, Average R, Profit Factor, and alerts are visual analysis tools only.
A bullish divergence is not a guaranteed reversal.
A bearish divergence is not a guaranteed reversal.
An EMA-aligned signal is not guaranteed to succeed.
A Supertrend-aligned signal is not guaranteed to succeed.
A higher-timeframe aligned signal is not guaranteed to succeed.
A TARGET HIT label is not proof of an actual broker fill.
An SL label is not proof of an actual broker fill.
The dashboard is not verified account performance.
The statistics are not audited.
The script does not include spread, commission, slippage, latency, financing, partial fills, order rejection, position sizing, account equity, or broker-specific execution behavior.
Use the script as a structured RSI-divergence review, directional-filtering, trade-mapping, and monitoring framework—not as a promise of profitability or a substitute for independent judgment.
Chỉ báo