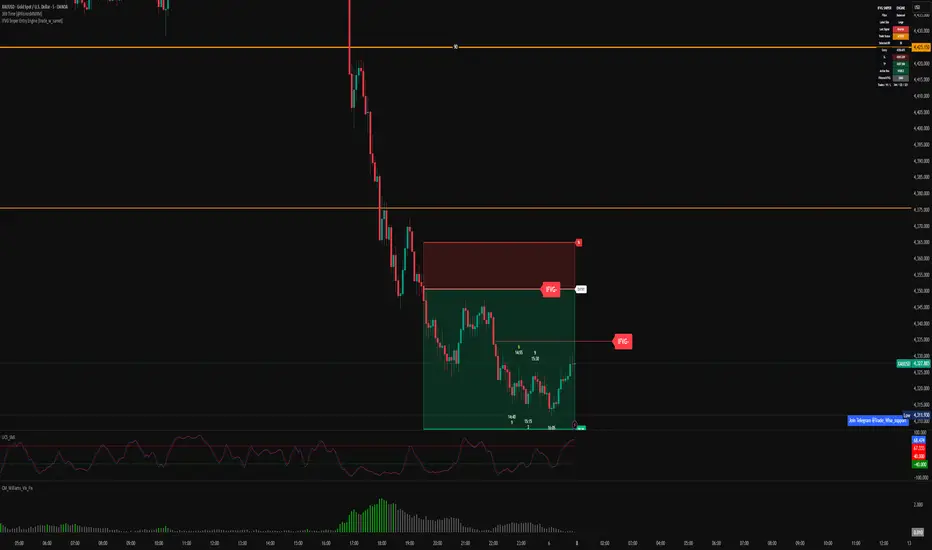
AHR999 Full Indicator利用AHR999指标进行四年周期底部的判断 1. 包含当前 AHR999 计算 2. 自定义6个目标 AHR999 值对应的价格线(默认0.45,0.4,0.35,0.3.0.327,0.25) 3. 右侧标签显示 AHR999 值 作者 小红书博主: 连涨20天Chỉ báocủa Rise2012
FVG_by_rashed_almsnoori FVG قناص الفجوات هو مؤشر تحليل فجوة القيمة العادلة للاستثمار نظيف ومركّز ومنظم، مصمم لمساعدة المتداولين على دراسة ظروف IFVG المُصفاة مباشرةً على الرسم البياني للسعر. is a clean, focused, and structured Inversion Fair Value Gap analysis indicator designed to help traders study filtered IFVG conditions directly on the price chart.Chỉ báocủa Rashed_almansoori99Cập nhật 71
MA Z-score## MA Z-Score The MA Z-Score is a momentum and trend-strength indicator that measures how far a moving average deviates from its statistical mean using a Z-score calculation. Instead of analyzing raw price action directly, this script normalizes the selected moving average and helps traders identify trend acceleration, overextended conditions, and momentum shifts more clearly across different markets and timeframes. ### Features * Multiple Moving Average types: * EMA * SMA * DEMA * HMA * VWMA * Z-score normalization of the selected MA * Configurable lookback period * Adjustable bullish and bearish thresholds * Dynamic trend coloring * Optional bar coloring * Custom visual reference levels * Built-in alert conditions for long and short signals ### How It Works The script first calculates a moving average based on the selected type and length. It then computes: * The mean of the MA using an EMA * The standard deviation over the chosen lookback period * The Z-score using: This creates a normalized oscillator showing how extreme the current MA value is relative to its recent behavior. ### Signal Logic * Long Condition: * Triggered when the Z-score rises above the bullish threshold. * Short Condition: * Triggered when the Z-score falls below the bearish threshold. The oscillator changes color depending on trend direction: * Green = bullish momentum * Pink = bearish momentum Optional candle coloring allows price bars to reflect the current trend state directly on the chart. ### Best Use Cases This indicator can be used for: * Trend confirmation * Momentum analysis * Detecting strong expansions * Identifying potential reversals * Filtering trades with statistical context * Multi-timeframe trend alignment ### Tips * Lower thresholds create more signals but increase noise. * Higher thresholds filter weak momentum and focus on stronger trends. * HMA and DEMA react faster to price movement. * VWMA can be useful for volume-sensitive markets. ### Alerts The script includes built-in TradingView alerts: * MA Z-score Long * MA Z-score Short These alerts can be connected to notifications, bots, or automated workflows. ### Important This indicator is not designed as a standalone trading system. It works best when combined with: * Market structure * Support & resistance * Volume analysis * Higher timeframe bias * Risk management Chỉ báocủa Louis_MietznerCập nhật 5
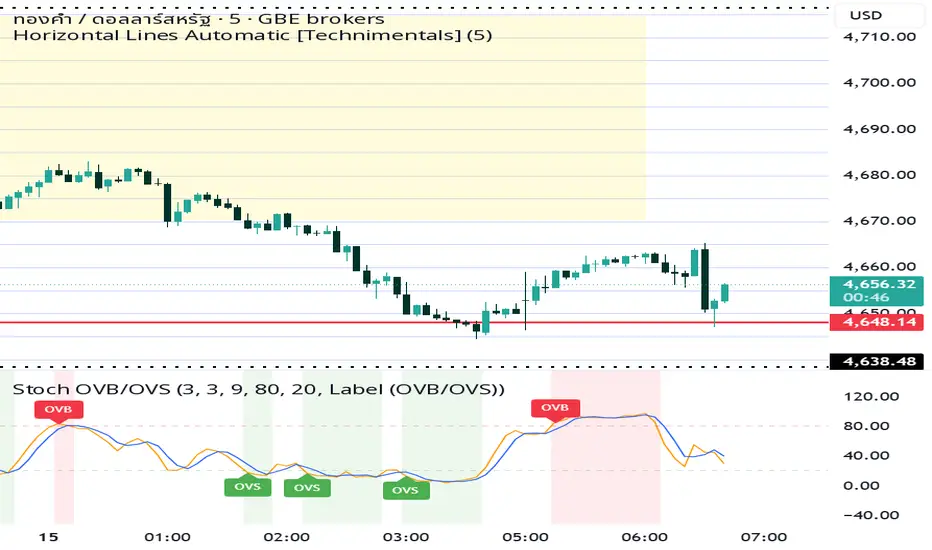
Stochastic with label OVS/OVB Stochastic Oscillator A Stochastic Oscillator indicator with OVB (Overbought) and OVS (Oversold) signal labels displayed beneath the price chart. The indicator uses two momentum lines — a blue %K line and an orange %D signal line — fluctuating between the 20 and 80 levels to identify market momentum and potential reversal zones. Red “OVB” labels appear when the oscillator enters the overbought region above 80, signaling possible bearish exhaustion, while green “OVS” labels appear below 20, indicating potential bullish reversal opportunities. The indicator is designed to help traders detect momentum shifts, trend weakness, and short-term entry or exit signals in fast-moving markets such as XAU/USD.Chỉ báocủa choping14
Relative Strength Index with labelRelative Strength Index with label An RSI (Relative Strength Index) indicator panel displaying overbought (OVB) and oversold (OVS) signals on chart. The RSI uses two moving lines — a purple RSI line and a yellow signal line — oscillating between the 30 and 70 threshold levels. Green markers labeled “OVS” highlight oversold conditions where the RSI dips below the lower threshold, suggesting potential bullish reversals. The indicator helps traders identify momentum shifts and possible entry or exit points based on market strength and exhaustion zones. Chỉ báocủa choping5
CREA Composite MA v3Here's a clean description you can use as the indicator's published description on TradingView: CREA Composite MA v3 — Multi-Layer Confluence Indicator CREA Composite MA is a momentum and trend confluence engine disguised as a moving average. Rather than plotting a single indicator, it combines seven sub-indicators into one normalised 0–100 composite score, then runs that score through three layers of confirmation before generating a signal. The seven components: EMA Bias (EMA10/20 stack and price position) MFI (Money Flow Index) ADX with +DI/−DI directional spread Volatility (inverse ATR%, environment-adjusted) Delta (candle body direction and size) Volume (Z-score, directionally weighted) Momentum (Rate of Change, normalised) Each component is independently normalised to 0–100. Scores above 50 are bullish, below 50 are bearish. All weights are fully adjustable. Three confirmation layers: Layer 1 — Component agreement: counts how many of the 7 sub-indicators individually agree with the direction. A composite score of 65 built on 6/7 components is treated differently from one built on 2 components spiking hard. Layer 2 — HTF filter: rebuilds the full composite on a user-selected higher timeframe (default 15m) and gates signals accordingly. Bull signals are suppressed when the HTF composite is bearish, and vice versa. The HTF line is plotted directly on the pane so both timeframes are visible simultaneously. Layer 3 — Score velocity: measures the 3-bar rate of change of the composite itself. A rising score carries more weight than a flat one at the same level. Two-tier signal system: EARLY (yellow) — fires on signal line crossover when ≥4/7 components agree and HTF is aligned. Appears before the threshold is reached, giving advance warning of a potential confirmed signal. CONFIRMED (green/red) — fires on threshold cross when ≥5/7 components agree and HTF is aligned. Labelled with confidence tier (HIGH / MED / LOW) and agreement count (e.g. BULL HIGH 6/7). BLOCKED (gray) — threshold was crossed but confirmation gates rejected it. Useful for auditing filter performance. Confidence tiers: HIGH — 6–7 components agree + velocity moving in signal direction MED — 5+ components agree LOW — 4+ components agree HUD table (bottom-right) shows all seven component scores in real time, color-coded by strength, alongside the composite score, HTF score and bias, confidence tier, and velocity direction. 7 alert conditions included: Early Bull/Bear, Confirmed Bull/Bear, Blocked Bull/Bear, and HIGH Confidence. All lengths, weights, thresholds, and filter settings are fully configurable via the settings panel.Chỉ báocủa ionutz666bzz12
CREA Composite MA v2Composite - Testing Still under review and continuously adding features to itChỉ báocủa ionutz666bzz2
SQZ Pro JS [MTF + ADX + Divergencias + Giros]El ecosistema definitivo del Squeeze Momentum. Basado en la estrategia clásica del Squeeze, este indicador ha sido reconstruido desde cero para traders exigentes que buscan precisión matemática y gráficos extremadamente limpios. Hemos eliminado el "ruido" y las señales falsas para centrarnos en lo que realmente importa: la fuerza de la tendencia, la alineación de temporalidades y las divergencias estructurales. 🎯 CARACTERÍSTICAS PRINCIPALES: 1. Motor de Divergencias PRO (Lógica de Olas) Olvídate de las divergencias falsas causadas por pequeños baches en el precio. Este indicador utiliza un rastreador de "Olas" (Wave Tracker) que identifica el pico absoluto de la fuerza compradora/vendedora y lo compara estrictamente con la ola anterior. Regla de Cero Estricta: Las divergencias alcistas solo se calculan en la zona roja (valles) y las bajistas en la zona verde (picos). Trazado limpio "de palo a palo". 2. Panel Dinámico Multi-Timeframe (MTF) Un monitor lateral que te permite escanear el mercado desde 5 Minutos hasta Mensual. La tabla es inteligente: su tamaño se adapta dinámicamente según las temporalidades que actives. Para cada temporalidad, el panel analiza simultáneamente: La dirección del Squeeze. La fuerza de la tendencia (Filtro ADX y cruces DI+/DI- integrados matemáticamente). Eventos en tiempo real (Giros de color y cruces de la línea cero). 3. Señales Verticales de Precisión (Sin ensuciar el gráfico) El indicador traza líneas verticales directamente en tu gráfico solo en la temporalidad en la que te encuentras, marcando los momentos críticos: Giro Buy / Sell: Cuando el momentum cambia de dirección perdiendo fuerza. Cruce 0 UP / DN: Cuando el momentum cruza la línea cero confirmando el cambio de bando. Totalmente personalizables: Elige el grosor, color y estilo (línea sólida, punteada o discontinua) para adaptar el gráfico a tu estilo visual. 4. Estética "Clean Chart" (Cero distracciones) Diseñado para no estorbar. El Momentum se muestra en formato de columnas limpias (Verde oscuro para fuerza creciente, Rojo para fuerza decreciente). Elementos secundarios como el ADX, las líneas DI o los puntos del Squeeze (dots) vienen ocultos de fábrica para mantener el gráfico puro, aunque su matemática sigue trabajando en segundo plano para la tabla MTF. Las etiquetas molestas de la escala de precios han sido desactivadas por defecto. 💡 CÓMO UTILIZARLO: El Panel (El Bosque): Utiliza la tabla MTF para confirmar que las temporalidades mayores (ej. Diario y 4H) están alineadas en la misma dirección (Fuerza + ADX). El Histograma (El Árbol): Busca entradas en tu temporalidad operativa cuando el histograma confirme un "Giro" a favor de la tendencia mayor, o cuando detecte una Divergencia Pro confirmada. ⚙️ CONFIGURACIÓN DE FÁBRICA: El indicador viene pre-configurado para operar "Out of the box" con colores intuitivos y sensibilidad profesional, pero ofrece control absoluto en sus ajustes para activar temporalidades menores (5m, 15m, 30m), mostrar las líneas del ADX o ajustar los periodos del canal de Keltner y las Bandas de Bollinger. (Descargo de responsabilidad: Este indicador es una herramienta de análisis técnico y no constituye asesoramiento financiero. Úsalo en confluencia con tu propia gestión de riesgo).Chỉ báocủa FxJorgeSanchezCập nhật 20
RatSignal Flow - Composite Momentum Scanner Short Description: Multi-layer momentum oscillator: Fisher Transform + WaveTrend + signal detection. Free from ratsignal.com — premium indicators coming soon. Find more details: ratsignal.com Full Description: 🐀 RatSignal Flow — Composite Momentum Scanner Professional multi-layer oscillator combining three independent momentum engines into one panel. Built by the RatSignal team — the same core signals powering our live 24/7 trading bots on crypto markets. Recommended timeframe: 15 minutes (works on all timeframes, optimized for 15m–4H). ━━━━━━━━━━━━━━━━━━━━━━━━━━━━ COMPONENTS ▸ Fisher Transform (cyan/orange line with neon glow) Ehlers' Fisher Transform scaled to oscillator range. Statistically detects price reversals earlier than RSI or Stochastic. Toggle glow effect on/off in settings. ▸ WaveTrend Oscillator (blue/orange dual line) Momentum system with dynamic fill between WT1 and WT2. Captures trend shifts with high sensitivity. Neon glow included. ▸ RSI+MFI Histogram (green/red bars) Volume-weighted momentum histogram. Green = buying pressure, Red = selling pressure. ▸ WaveTrend Cross Dots Large circles appear at WT1/WT2 crossover points for quick visual scanning. ━━━━━━━━━━━━━━━━━━━━━━━━━━━━ SIGNALS 🟢 Green Dot — Bullish EMA cross (EMA11 above EMA34) 🟡 Yellow X — Oversold reversal candidate (multi-factor: WaveTrend + RSI + MFI confluence) 🔴 Red X — Bearish EMA warning (EMA5 below EMA11) 🔵 Blue Triangle — Short-term momentum shift 🐀 Green Rat — LONG entry signal (zone-filtered composite — only fires from oversold) 🐀 Red Rat — SHORT entry signal (zone-filtered composite — only fires from overbought) Rat signals are strict and zone-filtered: LONG only triggers when momentum recovers from oversold territory, SHORT only from overbought. This dramatically reduces noise compared to standard crossover signals. ━━━━━━━━━━━━━━━━━━━━━━━━━━━━ HOW TO USE 1. Watch for 🐀 Rat signals as primary entry triggers 2. Confirm direction with WaveTrend position (above/below zero line) 3. Check Fisher Transform color for trend bias (cyan = bullish, orange = bearish) 4. Use the rsiMFI histogram for volume confirmation 5. Green/Yellow/Red markers add extra confluence layers 6. Overbought (60) and Oversold (-60) zones highlight when momentum is extended Works on all crypto pairs — BTC, ETH, SOL, and beyond. ━━━━━━━━━━━━━━━━━━━━━━━━━━━━ FREE — FOR NOW This indicator is 100% free. We're releasing it as a preview of the RatSignal suite. Premium indicators with advanced pattern detection, AI-powered signal filtering, and multi-timeframe confluence analysis are coming to ratsignal.com in the next few months. Follow @ratsignalcrypto here on TradingView and visit ratsignal.com to get early access. ━━━━━━━━━━━━━━━━━━━━━━━━━━━━ ⚠️ This is not financial advice. Past performance does not guarantee future results. Always use proper risk management.Chỉ báocủa ratsignalcryptoCập nhật 37
Trend Momentum Confirmation EngineTrend Momentum Confirmation Engine Trend Momentum Confirmation Engine is a multi-factor technical indicator designed to detect potential market direction by combining several widely used technical analysis methods into a unified confirmation framework. The indicator integrates three different analytical components: • Supertrend – used to determine the prevailing market trend. • Awesome Oscillator (AO) – used to measure momentum shifts and detect early changes in market dynamics. • ADX with DI filters – used to measure the strength of the trend and confirm directional bias. Instead of relying on a single signal source, the script evaluates market conditions using multiple independent modules. Signals are produced when the enabled modules confirm the same directional bias within a defined number of bars. This design helps reduce noise and false signals that can occur when indicators are used individually. Core Logic The indicator operates through three independent modules. Trend Module (Supertrend) The Trend module uses the Supertrend algorithm based on the Average True Range (ATR). It identifies changes in the primary trend direction and provides a structural market bias. Momentum Module (Awesome Oscillator) The momentum module uses the Awesome Oscillator to detect changes in market momentum. Signals are generated when: • the oscillator crosses the zero line • or when a three-bar reversal structure toward the zero line is detected. Trend Strength Module (ADX) The ADX module measures the strength of the current market trend. Directional filters based on DI+ and DI− can optionally be used to ensure that signals align with the dominant directional pressure. Multi-Module Confirmation The script allows traders to enable or disable individual modules. Signals are generated based on the following logic: • If one module is enabled, signals follow that module. • If two modules are enabled, both must confirm direction within the defined confirmation window. • If three modules are enabled, all three must confirm the same directional bias. The confirmation does not need to occur on the same bar. Signals can appear within the configurable confirmation window, allowing slight delays between indicators. Visual Output The indicator provides visual feedback through: • Background highlighting representing the current directional bias • Optional trend guide lines derived from the Supertrend level • Directional arrows marking confirmed signals These visual elements reflect the combined output of the enabled modules. Open-Source Components and Credits This script uses concepts and calculation methods derived from publicly known technical indicators including: • Supertrend • Awesome Oscillator (Bill Williams) • Average Directional Index (ADX) Portions of the implementation are based on open-source Pine Script examples and public indicator concepts available in the TradingView community and documentation. All reused concepts are used as building blocks within a new combined confirmation framework. Usage The indicator can be applied to any market or timeframe. It may be useful for traders who want to evaluate market direction using a combination of trend, momentum, and trend strength. Typical use cases include: • trend continuation setups • filtering momentum signals • reducing false signals in ranging markets. Disclaimer This script is provided for educational and informational purposes only. It does not constitute financial or investment advice. Traders should always perform their own analysis and risk management.Chỉ báocủa andriimelnykovenftw105
Pro RSI + Stoch + ATR Dashboard (MASTER) by AliMulti-Timeframe Momentum + Volatility Alignment System Trend Filtered MASTER Signals Designed for Structured, Discipline-Based Trading Pro RSI + Stoch + ATR Dashboard (MASTER) by Ali Full Mathematical Logic & Professional Usage Guide This indicator is a multi-timeframe momentum and volatility dashboard designed to combine: RSI (Trend & Strength) Stochastic (Timing & Trigger) ATR & ATR% (Volatility & Risk Control) Alignment Scoring (Market Structure Confirmation) MASTER Signal Logic (Filtered Trade Execution) The goal is simple: Reduce overtrading. Eliminate counter-trend entries. Trade only when momentum alignment confirms structure. 1️⃣ Core Indicators & Mathematical Foundation 🔹 RSI (Relative Strength Index) RSI measures the ratio between average gains and average losses over a defined period. Formula: RSI = 100 − RS = Average Gain / Average Loss Default Length: 14 Key Level: RSI ≥ 50 → bullish momentum bias RSI < 50 → bearish momentum bias In this system, RSI 50 is used as: Trend filter Alignment scoring basis 🔹 Stochastic (K & D) Stochastic measures where price closes relative to its recent range. K line = smoothed momentum line D line = signal line (smoothed K) Default: Length = 14 K smoothing = 3 D smoothing = 3 Trigger logic: K crossing above D → bullish short-term trigger K crossing below D → bearish short-term trigger ⚠ Stochastic alone does NOT generate signals. It only acts as a timing mechanism inside MASTER logic. 🔹 ATR (Average True Range) ATR measures market volatility. True Range (TR) = max(High−Low, |High−PrevClose|, |Low−PrevClose|) ATR = Moving average of TR over N periods Default Length: 14 ATR% = (ATR / Close) × 100 Why ATR% matters: Higher ATR% → wider stops required Lower ATR% → tighter structure, breakout potential 2️⃣ Multi-Timeframe Structure (MTF Logic) The dashboard evaluates 4 timeframes simultaneously: 15m → Entry & Timing 1H → Short-term bias 4H → Structural trend 1D → Market regime Each timeframe displays: RSI Stoch K/D ATR Status This allows structured decision making instead of single-timeframe guessing. 3️⃣ MASTER Logic (Trend + Alignment + Trigger) A MASTER signal is generated ONLY when all three layers align: 🔹 1) Trend Filter (RSI 50 on selected TF) User selects Trend TF (1H / 4H / 1D) If RSI ≥ 50 → LONG ONLY If RSI < 50 → SHORT ONLY This prevents counter-trend trading. tr.tradingview.com 🔹 2) Alignment Score (MTF Confirmation) Alignment counts how many timeframes have RSI ≥ 50. bullCount = sum of bullish RSI conditions (0–4) Score% = (bullCount / 4) × 100 Example: 4/4 (100%) → Full bullish alignment 2/4 (50%) → Mixed / chop conditions 0/4 (0%) → Full bearish regime This prevents trading in unstable market environments. tr.tradingview.com 🔹 3) Trigger (15m Stoch Cross) Entry confirmation uses: 15m K crossing above D → bullish trigger 15m K crossing below D → bearish trigger 4️⃣ MASTER BUY / SELL Conditions MASTER BUY: Trend = LONG ONLY bullCount ≥ Min Bull TF setting 15m Stoch bullish cross MASTER SELL: Trend = SHORT ONLY bullCount ≤ Max Bull TF setting 15m Stoch bearish cross This ensures: Trend + Structure + Timing = One controlled signal. 5️⃣ Reading the Dashboard Table Columns: TIME → timeframe RSI → momentum strength K / D → stochastic timing ATR → volatility STATUS → simplified momentum state STATUS is informational only. It does NOT replace MASTER logic. 6️⃣ Center Info Label Explained Displays: TREND → Active direction filter ALIGN → MTF momentum strength ATR% → Volatility intensity across TFs Professional usage: ALIGN ≥ 75% → Strong trend continuation ALIGN ≤ 50% → Chop / mean reversion zone High ATR% → Adjust risk and position size Low ATR% → Breakout probability increases 7️⃣ Recommended Settings by Trader Type 🔹 General / Balanced: Trend TF: 4H Min Bull BUY: 3 Max Bull SELL: 1 🔹 Intraday: Trend TF: 1H or 4H Min Bull BUY: 2–3 Max Bull SELL: 1–2 🔹 Scalper: Trend TF: 1H Min Bull BUY: 2 Max Bull SELL: 2 🔹 Swing: Trend TF: 1D Min Bull BUY: 3 Max Bull SELL: 1 8️⃣ Professional Trade Workflow Check TREND first Confirm ALIGN strength Wait for 15m trigger Enter with structure-based stop Adjust position size using ATR% This indicator is a structured decision framework, not a random signal generator. Built for traders who value structure over impulse. ⚠ Risk Disclaimer This tool enhances structure and discipline. It does not predict markets. Best performance occurs in aligned trending environments.Chỉ báocủa dokuyucuali00614
Nico Trend Change Indicator + 2 TP TargetsThe Trend Change Indicator (TCI) is a trend-following momentum tool designed to identify clear trade entries and exits based on the relationship between two moving averages and volatility-adjusted margins. Here is a breakdown of how the indicator works and how to interpret its components: 1. The Core Ribbon (Momentum & Trend) The heart of the indicator is the "Ribbon," formed by a Fast and a Slow-moving average. Green Ribbon (Bullish): This occurs when the Fast length is significantly above the Slow length, indicating strong upward momentum. This serves as your Long Entry signal. Red Ribbon (Bearish): This occurs when the Fast length is significantly below the Slow length, indicating strong downward momentum. This serves as your Put / Short Entry signal. White Ribbon (Neutral/Chop): When the difference between the two averages is smaller than the volatility-based margin (determined by the ATR), the ribbon turns white. This is a No Trade Zone or a Take Profit (TP) Zone. 2. Volatility Filtering (ATR Margin) Unlike a standard moving average crossover, the TCI uses an ATR (Average True Range) Margin. The trend only changes to Bullish or Bearish if the gap between the Fast and Slow lines is larger than a specific percentage of the market's current volatility. This helps filter out "fakeouts" or "noise" during sideways markets where moving averages might cross frequently without a real trend starting. 3. Support/Resistance & Forecast Dots SMA Line: The thick white line is a long-term Simple Moving Average (defaulting to 140 periods). It acts as the primary "baseline." If the price is above this line, the overall bias is bullish; below it, the bias is bearish. Forecast Dots: The white dots appearing ahead of the price are SMA Forecasts. They project where the SMA will likely be in the future based on current price action, helping you visualize potential dynamic support or resistance levels before the price reaches them. 4. Higher Timeframe (HTF) Analysis The indicator includes a built-in "Security" function that looks at a higher timeframe (like the 4H or 12H) regardless of what chart you are currently viewing. The dashboard table uses this to show you if the "Big Trend" (HTF) matches the "Current Trend" (Chart TF). Trading in the direction of both timeframes (e.g., both are Green) typically increases the probability of a successful trade. Summary of Trade Signals Chỉ báocủa TripleQMatrix22256
Bullish Divergent Bar DCA Strategy [Skyrexio]Overview Bullish Divergent Bar DCA Strategy is a long-only, multi-layer Dollar-Cost Averaging (DCA) strategy that builds positions around bullish divergent bars formed below the Williams Alligator. It detects potential local bottoms and then scales into the move using up to four pyramiding entries, each with its own size and price threshold. The strategy optionally incorporates Market Facilitation Index (MFI) and Awesome Oscillator (AO) momentum to strengthen reversal confirmation and uses ATR-based take profit on the averaged entry price. Unique Features Layered DCA entries with equity-based sizing . It supports up to four DCA layers, where each additional layer is opened only after a configurable percentage drawdown from the first entry and position size is computed as a fraction of current equity via a geometric weighting scheme. Optional AO and MFI confirmation . Users can require Awesome Oscillator momentum divergence, MFI/volume “squat” bars, or both to confirm that the reversal bar is accompanied by capitulation and weakening downside momentum. ATR-based dynamic take profit . Take profit is defined as a multiple of ATR added to the current average entry price, automatically adjusting exits to prevailing volatility. Built-in DCA visualization . The script can plot the initial entry level and all DCA thresholds to make the averaging structure and risk visually transparent on the chart. Methodology The core entry logic starts from a bullish divergent bar definition: the bar must close above its midpoint (close > hl2) and be the lowest low within the user-defined lookback window, flagging a local swing low. On top of this, the bar must form entirely below all three Alligator lines, ensuring that the pattern appears after a sustained downside move rather than inside noise. If enabled, AO adds a momentum filter by requiring the Awesome Oscillator difference to be negative (descending bar on AO histogram), signaling fading downside momentum at the potential bottom. If the MFI filter is enabled, the bar (or one of the last two bars) must be a “squat” bar where spread narrows while volume increases, approximating effort vs. result exhaustion. Once a valid bullish reversal bar is detected and the time is within the configured trading window, the strategy opens the first DCA layer using a stop entry at the bar’s high (confirmation level), only entering if price actually breaks the bar high. Additional layers (second, third, and fourth entries) are only allowed if price trades below percentage thresholds from the first entry price and a new valid bullish reversal bar forms, thereby averaging down into deep pullbacks while still requiring fresh reversal evidence. While any DCA position is open, the strategy continuously recalculates the take profit as the current volume-weighted average entry price plus ATR multiplied by a user-defined factor. All individual entries share the same take profit level through separate strategy exit calls, so the entire stacked position exits together once price has moved sufficiently above the averaged entry. Strategy settings In the inputs window, users can configure the following strategy settings: sourceUuid / secretToken: Identifiers used to format JSON alerts for automated execution through webhooks. Trade Start Date/Time: Beginning of the backtest/live-trading window. Trade Stop Date/Time: End of the backtest/live-trading window. Show DCA Levels (default = false): Toggles plotting of the initial entry level and all three DCA thresholds on the chart. Enable MFI (default = false): Enables the MFI-style volume/spread filter. Enable AO (default = false): Enables Awesome Oscillator confirmation. Number Of Bar For Lowest Bar (default = 7): Lookback window used to identify the lowest low bar for the bullish reversal bar condition. Layer 2 Threshold Percent (default = 4.0): Percentage drop from the first layer price that must be reached to allow the second DCA entry. Layer 3 Threshold Percent (default = 10.0): Percentage drop from the first layer price required to unlock the third DCA layer. Layer 4 Threshold Percent (default = 22.0): Percentage drop from the first layer price required to unlock the fourth DCA layer. Position Size Multiplier (default = 2.0): Multiplier used in the geometric weighting scheme to determine how much equity is allocated to each additional DCA layer. Number Of ATR For Take Profit (default = 2.0): ATR multiple added to the current average entry price to calculate the shared take profit for all open layers. Users can refine these parameters during backtesting to fit the volatility profile and structure of the specific asset and timeframe. Justification of Methodology Before understanding why this particular combination of indicator has been chosen let's briefly explain what is Williams Alligator, MFI and AO. let’s start with the Williams Alligator. Developed by Bill Williams, the Alligator is a technical indicator that identifies trends and potential market reversals. It consists of three smoothed moving averages: Jaw (Blue Line): The slowest of the three, based on a 13-period smoothed moving average shifted 8 bars ahead. Teeth (Red Line): The medium-speed line, derived from an 8-period smoothed moving average shifted 5 bars forward. Lips (Green Line): The fastest line, calculated using a 5-period smoothed moving average shifted 3 bars forward. When the lines diverge and align in order, the "Alligator" is "awake," signaling a strong trend. When the lines overlap or intertwine, the "Alligator" is "asleep," indicating a range-bound or sideways market. This indicator helps traders determine when to enter or avoid trades. The Awesome Oscillator (AO), developed by Bill Williams, is a momentum indicator designed to measure market momentum by contrasting recent price movements with a longer-term historical perspective. It helps traders detect potential trend reversals and assess the strength of ongoing trends. The formula for AO is as follows: AO = SMA5(Median Price) − SMA34(Median Price) where: Median Price = (High + Low) / 2 SMA5 = 5-period Simple Moving Average of the Median Price SMA 34 = 34-period Simple Moving Average of the Median Price The Market Facilitation Index (MFI) is a technical indicator that measures the price movement per unit of volume, helping traders gauge the efficiency of price movement in relation to trading volume. Here's how you can calculate it: MFI = (High−Low)/Volume MFI can be used in combination with volume, so we can divide 4 states. Bill Williams introduced these to help traders interpret the interaction between volume and price movement. Here’s a quick summary: Green Window (Increased MFI & Increased Volume): Indicates strong momentum with both price and volume increasing. Often a sign of trend continuation, as both buying and selling interest are rising. Fake Window (Increased MFI & Decreased Volume): Shows that price is moving but with lower volume, suggesting weak support for the trend. This can signal a potential end of the current trend. Squat Window (Decreased MFI & Increased Volume): Shows high volume but little price movement, indicating a tug-of-war between buyers and sellers. This often precedes a breakout as the pressure builds. Fade Window (Decreased MFI & Decreased Volume): Indicates a lack of interest from both buyers and sellers, leading to lower momentum. This typically happens in range-bound markets and may signal consolidation before a new move. For our purposes we are interested in squat bars. This is the sign that volume cannot move the price easily. This type of bar increases the probability of trend reversal. In this indicator we added to enable the MFI filter of reversal bars. If potential divergent bar or two preceding bars have squat state this bar can be interpret as a reversal one. The strategy intentionally focuses on bullish divergent bars forming at local lows and below the Alligator to catch potential exhaustion points in downtrends where risk/reward becomes asymmetric. The Alligator (Jaw, Teeth, Lips) acts as a dynamic structure filter: requiring price to be below all three lines before reversal helps avoid chasing minor pullbacks inside an ongoing uptrend and instead concentrates entries on deeper corrections where mean reversion potential is higher. The custom bullish divergent bar rule (close above midpoint and being the lowest low over N bars) approximates a local capitulation candle, which often precedes short squeezes or at least strong reactions. By combining this with AO and MFI-style filters, the strategy further increases the likelihood that the pattern coincides with downside momentum(as a confirmation that current trend is downward, AO difference < 0) and effort vs. result anomalies (squat bars), which is common signatures of trend exhaustion. The DCA structure is designed to deploy capital progressively rather than all at once: the first entry is triggered only if price confirms the reversal by breaking above the bar’s high, while subsequent layers require both a deeper discount relative to the initial entry and a new bullish reversal signal. Percentage thresholds from the first entry ensure that each additional allocation is made at meaningfully better prices, improving the blended entry level and reducing the break-even distance. Finally, using ATR as the basis for take profit aligns exits with current volatility. A fixed-percentage target can be too tight in volatile regimes or too loose in quiet markets, whereas ATR-based targets scale with average bar range. Applying ATR to the evolving average entry price of all open layers keeps the risk/reward framework consistent across different volatility regimes and DCA configurations. Backtest Results Operating window: Date range of backtests is 2025.01.01 - 2026.01.01. It is chosen to let the strategy to close all opened positions. Commission and Slippage: Includes a standard Binance commission of 0.1% and accounts for possible slippage over 5 ticks. Initial capital: 10000 USDT Maximum Single Position Loss: -6.56% Maximum Single Profit: +4.92% Net Profit: +934.08 USDT (+9.34%) Total Trades: 121 (82.64% win rate) Profit Factor: 2.948 Maximum Accumulated Loss: 624.72 USDT (-6.15%) Average Profit per Trade: 7.72 USDT (+0.37%) Average Trade Duration: 60 hours These results are obtained with realistic parameters representing trading conditions observed at major exchanges such as Binance and with realistic trading portfolio usage parameters. You should run your own backtests on the target asset and timeframe (for example, BTC/USDT on intraday charts) and adjust threshold percentages, layer sizing, and ATR take profit factor to match your risk tolerance and market conditions. How to Use Add the script to favorites for easy access. Apply to the desired timeframe and chart. Configure settings using the dropdown choice list in the built-in menu. Set up alerts to automate strategy positions through web hook with the text: {{strategy.order.alert_message}} Disclaimer: Educational and informational tool reflecting Skyrex commitment to informed trading. Past performance does not guarantee future results. Test strategies in a simulated environment before live implementationChiến lượccủa Skyrexio167
Real RSI/threshold = input.float(80, title = "rsi above") // condition = rsi60 > threshold // barcolor(condition ? color.purple : na) // bgcolor(condition ? color.new(color.purple, 80) : na, force_overlay = true)Chỉ báocủa KokJiarakul11
AI Oversold Swing - Screener//@version=5 indicator("AI Oversold Swing - Screener", overlay=false) // ───────────────────────── // USER INPUTS // ───────────────────────── maxPrice = input.float(75.0, "Max Price ($)") rsiLen = input.int(14, "RSI Length") rsiOversold = input.float(35.0, "RSI Oversold Level") bbLen = input.int(20, "BB Length") bbMult = input.float(2.0, "BB StdDev") supportLen = input.int(20, "Support Lookback (days)") nearSupportPct = input.float(1.5, "Near Support %") undercutPct = input.float(0.5, "Allowed Undercut %") atrLen = input.int(14, "ATR Length") maxATRfromSup = input.float(1.0, "Max ATR From Support") minDollarVol = input.float(75000000.0, "Min Dollar Volume", step=1000000) requireTrigger = input.bool(false, "Require Reversal Trigger") // ───────────────────────── // DAILY DATA (screener uses indicator outputs) // ───────────────────────── dClose = request.security(syminfo.tickerid, "D", close) dLow = request.security(syminfo.tickerid, "D", low) dVol = request.security(syminfo.tickerid, "D", volume) dPrevC = request.security(syminfo.tickerid, "D", close ) // ───────────────────────── // INDICATORS // ───────────────────────── rsi = ta.rsi(dClose, rsiLen) basis = ta.sma(dClose, bbLen) dev = bbMult * ta.stdev(dClose, bbLen) bbLow = basis - dev atr = request.security(syminfo.tickerid, "D", ta.atr(atrLen)) support = ta.lowest(dLow, supportLen) distPct = support > 0 ? (dClose - support) / support * 100.0 : na distATR = atr > 0 ? (dClose - support) / atr : na dollarVol = dClose * dVol // ───────────────────────── // CONDITIONS // ───────────────────────── priceOK = dClose > 0 and dClose <= maxPrice liqOK = dollarVol >= minDollarVol oversold = (rsi <= rsiOversold) and (dClose <= bbLow) nearSup = support > 0 and dClose <= support * (1 + nearSupportPct / 100.0) and dClose >= support * (1 - undercutPct / 100.0) and distATR <= maxATRfromSup setup = priceOK and liqOK and oversold and nearSup // Optional reversal confirmation rsiReversal = ta.crossover(rsi, rsiOversold) greenCandle = dClose > dPrevC trigger = rsiReversal or greenCandle signal = requireTrigger ? (setup and trigger) : setup // ───────────────────────── // SCREENER OUTPUTS // ───────────────────────── plot(signal ? 1 : 0, title="Signal (1 = YES)") plot(rsi, title="RSI (Daily)") plot(distPct, title="Dist to Support % (Daily)") plot(distATR, title="Dist to Support ATR (Daily)") plot(dollarVol, title="Dollar Volume (Daily)") Chỉ báocủa reconranger22714
FluidFlow OscillatorFluidFlow Oscillator: Study Material for Traders Overview The FluidFlow Oscillator is a custom technical indicator designed to measure price momentum and market flow dynamics by simulating fluid motion concepts such as velocity, viscosity, and turbulence. It helps traders identify potential buy and sell signals along with trend strength, momentum direction, and volatility conditions. This study explains the underlying calculation concepts, signal logic, visual cues, and how to interpret the professional dashboard table that summarizes key indicator readings. ________________________________________ How the FluidFlow Oscillator Works Core Mechanisms 1. Price Flow Velocity o Measures the rate of change of price over a specified flow length (default 40 bars). o Calculated as a percentage change of closing price: roc=close−closelen_flowcloselen_flow×100\text{roc} = \frac{\text{close} - \text{close}_{len\_flow}}{\text{close}_{len\_flow}} \times 100roc=closelen_flowclose−closelen_flow×100 o Smoothed by an EMA (Exponential Moving Average) to reduce noise, generating a "flow velocity" value. 2. Viscosity Factor o Analogous to fluid viscosity, it adjusts the flow velocity based on recent price volatility. o Volatility is computed as the standard deviation of close prices over the flow length. o The viscosity acts as a damping factor to slow down the flow velocity in highly volatile conditions. o This results in a "flow with viscosity" value, that smooths out the velocity considering market turbulence. 3. Turbulence Burst o Captures sudden changes or bursts in the flow by measuring changes between successive viscosity-adjusted flows. o The turbulence value is a smoothed absolute change in flow. o A burst boost factor is added to the oscillator to incorporate this rapid change component, amplifying signals during sudden shifts. 4. Oscillator Calculation o The raw oscillator value is the sum of flow with viscosity plus burst boost, scaled by 10. o Clamped between -100 and +100 to limit extremes. o Finally, smoothed again by EMA for cleaner visualization. ________________________________________ Signal Logic The oscillator works with complementary components to produce actionable signals: • Signal Line: An EMA-smoothed version of the oscillator for generating crossover-based signals. • Momentum: The rate of change of the oscillator itself, smoothed by EMA. • Trend: Uses fast (21-period EMA) and slow (50-period EMA) moving averages of price to identify market trend direction (uptrend, downtrend, or sideways). Signal Conditions • Bullish Signal (Buy): Oscillator crosses above the oversold threshold with positive momentum. • Bearish Signal (Sell): Oscillator crosses below the overbought threshold with negative momentum. Statuses The oscillator provides descriptive market states based on level and momentum: • Overbought • Oversold • Buy Signal • Sell Signal • Bullish / Bearish (momentum-driven) • Neutral (no clear trend) ________________________________________ Color System and Visualization The oscillator uses a sophisticated HSV color model adapting hues according to: • Oscillator value magnitude and sign (positive or negative) • Acceleration of oscillator changes • Smooth color gradients to facilitate intuitive understanding of trend strength and momentum shifts Background colors highlight overbought (red tint) and oversold (green tint) zones with transparency. ________________________________________ How to Understand the Professional Dashboard Table The FluidFlow Oscillator offers an integrated table at the bottom center of the chart. This dashboard summarizes critical indicator readings in 8 columns across 3 rows: Column Description SIGNAL Current signal status (e.g., Buy, Sell, Overbought) with color coding OSCILLATOR Current oscillator value (-100 to +100) with color reflecting intensity and direction MOMENTUM Momentum bias indicating strength/direction of oscillator changes (Strong Up, Up, Sideways, Down, Strong Down) TREND Current trend status based on EMAs (Strong Uptrend, Uptrend, Sideways, Downtrend, Strong Downtrend) VOLATILITY Volatility percentage relative to average, indicating market activity level FLOW Flow velocity value describing price momentum magnitude and direction TURBULENCE Turbulence level indicating sudden bursts or spikes in price movement PROGRESS Oscillator's position mapped as a percentage (0% to 100%) showing proximity to extreme levels Rows Explained • Row 1 (Header): Labels for each metric. • Row 2 (Values): Current numerical or descriptive values color-coded along a professional scheme: o Green or lime tones indicate positive or bullish conditions. o Red or orange tones indicate caution, sell signals, or bearish conditions. o Blue tones indicate neutral or stable conditions. • Row 3 (Status Indicators): Emoji-like icons and bars provide a quick visual gauge of each metric's intensity or signal strength: o For example, "🟢🟢🟢" suggests very strong bullish momentum, while "🔴🔴🔴" suggests strong bearish momentum. o Progress bar visually demonstrates oscillator movement toward oversold or overbought extremes. ________________________________________ Practical Interpretation Tips • A Buy signal with green colors and strong momentum usually precedes upward price moves. • An Overbought status with red background and red table colors warns of potential price corrections or reversals. • Watch the Turbulence to gauge market instability; spikes may precede price shocks or volatility bursts. • Confirm signals with the Trend and Momentum columns to avoid false entries. • Use the Progress bar to anticipate oscillations approaching key threshold levels for timing trades. ________________________________________ Alerts The oscillator supports alerts for: • Buy and sell signals based on oscillator crossovers. • Overbought and oversold levels reached. These help traders automate awareness of important market conditions. ________________________________________ Disclaimer The FluidFlow Oscillator and its signals are for educational and informational purposes only. They do not guarantee profits and should not be considered as financial advice. Always conduct your own research and use proper risk management when trading. Past performance is not indicative of future results. ________________________________________ This detailed explanation should help you understand the workings of the FluidFlow Oscillator, its components, signal logic, and how to analyze its professional dashboard for informed trading decisions. Chỉ báocủa aiTrendview-Charting-System44422
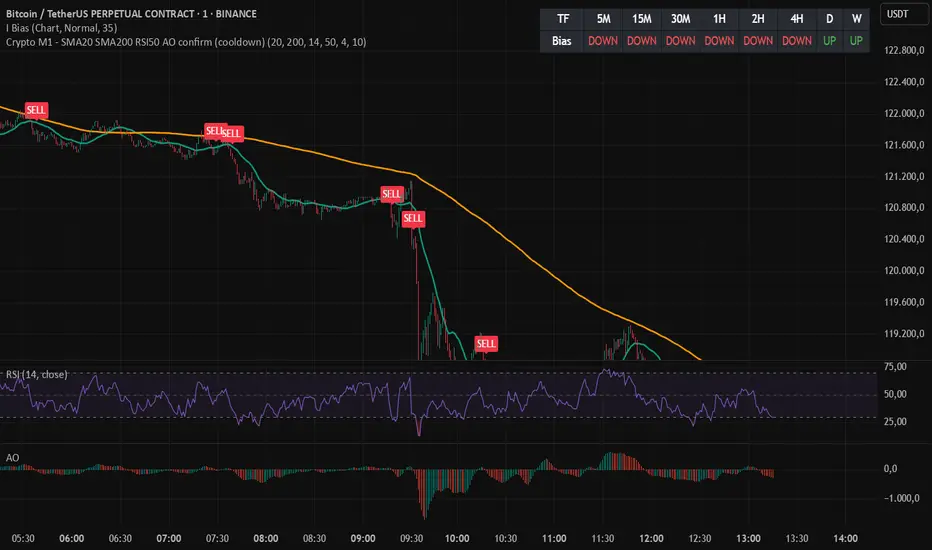
Indicador Millo SMA20-SMA200-AO-RSI M1This indicator is designed for scalping in 1-minute timeframes on crypto pairs, combining trend direction, momentum, and oscillator confirmation. Logic: Trend Filter: Only BUY signals when price is above the SMA200. Only SELL signals when price is below the SMA200. Entry Trigger: BUY: Price crosses above the SMA20. SELL: Price crosses below the SMA20. Confirmation Window: After the price cross, the Awesome Oscillator (AO) must cross the zero line in the same direction within a maximum of N bars (configurable, default = 4). RSI must be > 50 for BUY and < 50 for SELL at the moment AO confirms. Cooldown: A cooldown period (configurable, default = 10 bars) prevents multiple signals of the same type in a short time, reducing noise in sideways markets. Features: Works on any crypto pair and can be used in other markets. Adjustable confirmation window, RSI threshold, and cooldown. Alerts ready for BUY and SELL conditions. Can be converted into a strategy for backtesting with TP/SL. Suggested Use: Pair: BTC/USDT M1 or similar high-liquidity asset. Combine with manual support/resistance or higher timeframe trend analysis. Recommended to confirm entries visually and with additional confluence before trading live.Chỉ báocủa hernangarcia_7822158
SCTI-RSKSCTI-RSK 是一个多功能技术指标合集,整合了多种常用技术指标于一个图表中,方便交易者综合分析市场状况。该指标包含以下五个主要技术指标模块,每个模块都可以单独显示或隐藏: Stoch RSI - 随机相对强弱指数 KDJ - 随机指标 RSI - 相对强弱指数 CCI - 商品通道指数 Williams %R - 威廉指标 主要特点 模块化设计:每个指标都可以单独开启或关闭显示 交叉信号可视化:Stoch RSI和KDJ的金叉/死叉信号有彩色填充标识 多时间框架分析:支持不同长度的参数设置 直观界面:清晰的参数分组和颜色区分 适用场景 趋势判断 超买超卖区域识别 交易信号确认 多指标共振分析 English Description SCTI-RSK is a comprehensive technical indicator that combines multiple popular indicators into a single chart for traders to analyze market conditions holistically. The indicator includes the following five main technical indicator modules, each can be toggled on/off individually: Stoch RSI - Stochastic Relative Strength Index KDJ - Stochastic Oscillator RSI - Relative Strength Index CCI - Commodity Channel Index Williams %R - Williams Percent Range Key Features Modular Design: Each indicator can be shown or hidden independently Visual Crossover Signals: Golden/Death crosses are highlighted with color fills for Stoch RSI and KDJ Multi-Timeframe Analysis: Supports different length parameters Intuitive Interface: Clear parameter grouping and color differentiation Use Cases Trend identification Overbought/Oversold zone recognition Trade signal confirmation Multi-indicator confluence analysis 参数说明 (Parameter Explanation) 指标参数分为6个主要组别: 基础指标设置 - 控制各指标的显示/隐藏 Stoch RSI 设置 - 包括K值、D值、RSI长度等参数 KDJ 设置 - 包括周期、信号线等参数 RSI 设置 - 包括RSI长度、中期长度等参数 CCI 设置 - 包括CCI长度、中期长度等参数 Williams %R 设置 - 包括长度参数 使用建议 (Usage Suggestions) 初次使用时,可以先开启所有指标观察它们的相互关系 根据个人交易风格调整各指标的长度参数 关注多指标同时发出信号时的交易机会 结合价格行为和其他分析工具确认信号 更新日志 (Changelog) v1.0 初始版本,整合五大技术指标Chỉ báocủa Erens_FreedomCập nhật 21
AO/AC Zones (Log Price)William's AO/AC Zones scaled to work with log-price AO/AC indicators. When the log AO and log AC are green = price bar is painted green When the log AO and log AC are different = price bar painted gray When the log AO and log AC are red = price bar painted red Useful for seeing when momentum is beginning to increase or decrease, and direction on the AO/AC could be changing. Can also be used with William's standard entry and exit signals. Works with the log indicators, made for volatile and long-term charts which exhibit logarithmic trends.Chỉ báocủa IntuitCập nhật 26
William's Awesome Oscillator (AO) - Log-scaledA 5-34-5 MACD plotted as a histogram, aka William's Awesome Oscillator (AO), scaled to log price. Useful for finding momentum divergences in volatile and long-term price charts which show logarithmic trends. As you can see compared to the original (not log) AO indicator, it follows the momentum on the log-scaled price chart much more closely.Chỉ báocủa Intuit24
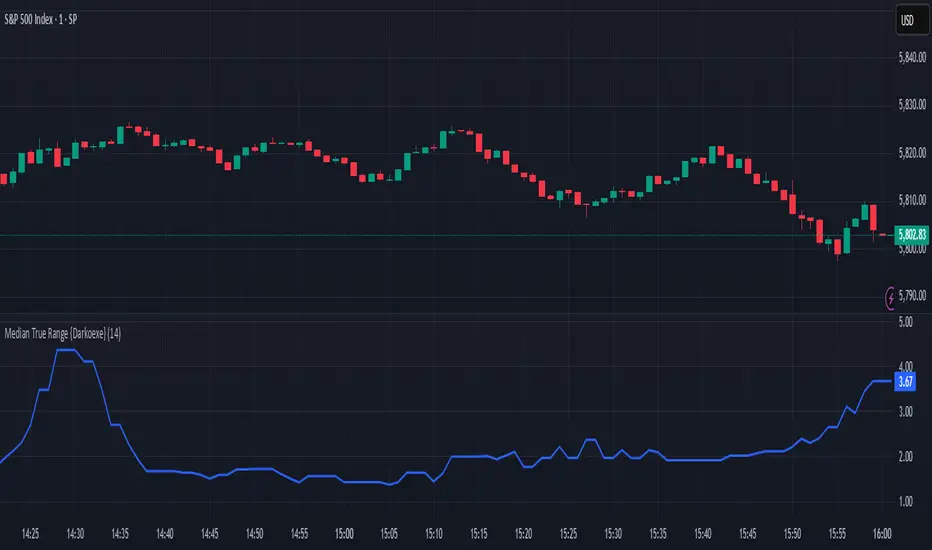
Median True Range {Darkoexe}Simple and sweet, this is the median true range. It reviews the size of the previous period amount of candles, and displays the candle size value that is the median of those previous values. //DarkoexeChỉ báocủa Darkoexe9
AO Smart Scalper – 5M Dynamic SL Edition📈 AO Signals with Fixed and Dynamic SL – Optimized for 5-Minute Charts 📉 This indicator is built for 5-minute timeframe trading, combining powerful momentum signals from the Awesome Oscillator (AO) with both Fixed and Dynamic Stop Loss (SL) levels to enhance trade management and risk control. ✅ Buy/Sell Signals: The indicator generates clear BUY and SELL signals based on the AO crossing above or below the zero line, helping traders capture momentum shifts early. 🛑 Fixed Stop Loss: Each trade signal comes with a Fixed SL, calculated based on the high (for shorts) or low (for longs) of the previous candle, with a customizable percentage offset. This SL is plotted with a red line, providing a clear initial risk level. ⚡ Dynamic Stop Loss: Continuous Presence, Strategic Use: A secondary Dynamic SL line is plotted, which is continuously present on the chart. This dynamic level responds to market conditions and can serve as a trailing stop or key decision point. 💡 Recommended Use: It is recommended to actively start using the Dynamic SL once the trade has moved into profit. This allows protecting obtained profits and minimizing the risk of losses in case of a market reversal. 🛡️ Enhanced Dynamic Stop-Loss Strategy: 🔒 Initial Protection: Utilize the Fixed SL as the initial stop-loss, placed below relevant lows (for longs) or above relevant highs (for shorts), or as provided by the fixed SL indicator. 🛤️ Dynamic Tracking: 🟢 Long Trades: Once in profit, the Dynamic SL will dynamically adjust, moving upwards as higher lows are formed, effectively trailing the price and securing profits. 🔴 Short Trades: Conversely, in short trades, once in profit, the Dynamic SL will move downwards as lower highs are formed, protecting gains. 🔄 Alternatively the dynamic stop loss will follow the dynamic SL line provided by the indicator. 🚪 Exiting Trades: When the price crosses below the Dynamic SL line in a LONG trade, or above it in a SHORT trade, the recommended action is to exit the trade. ↩️ Re-entry Consideration: You may consider re-entering only if the price clearly returns above the Dynamic SL (for longs) or below it (for shorts). ⚠️ IMPORTANT - 5-Minute Strategy Guidance ⏱️ This tool is specifically optimized for the 5-minute timeframe. This approach helps filter out weak setups and maintain discipline in volatile market conditions. ✨ Additional Features: 👁️ Visual and editable SL levels 📊 200-period SMA for trend context 💻 Simple and effective interface for intraday trading setups 🎯 Ideal for traders seeking a clean, rule-based system that combines momentum entry signals with layered stop loss protection. 🔑 Key Changes: It was emphasized that the Dynamic SL is always present, but its active use is recommended once the trade is in profit. It was clarified the use of the Fixed SL, giving the option to use the one provided by the indicator, or to place it according to the price action.Chỉ báocủa Magrone33 1 K
AO/AC Trading Zones Strategy [Skyrexio] Overview AO/AC Trading Zones Strategy leverages the combination of Awesome Oscillator (AO), Acceleration/Deceleration Indicator (AC), Williams Fractals, Williams Alligator and Exponential Moving Average (EMA) to obtain the high probability long setups. Moreover, strategy uses multi trades system, adding funds to long position if it considered that current trend has likely became stronger. Combination of AO and AC is used for creating so-called trading zones to create the signals, while Alligator and Fractal are used in conjunction as an approximation of short-term trend to filter them. At the same time EMA (default EMA's period = 100) is used as high probability long-term trend filter to open long trades only if it considers current price action as an uptrend. More information in "Methodology" and "Justification of Methodology" paragraphs. The strategy opens only long trades. Unique Features No fixed stop-loss and take profit: Instead of fixed stop-loss level strategy utilizes technical condition obtained by Fractals and Alligator to identify when current uptrend is likely to be over. In some special cases strategy uses AO and AC combination to trail profit (more information in "Methodology" and "Justification of Methodology" paragraphs) Configurable Trading Periods: Users can tailor the strategy to specific market windows, adapting to different market conditions. Multilayer trades opening system: strategy uses only 10% of capital in every trade and open up to 5 trades at the same time if script consider current trend as strong one. Short and long term trend trade filters: strategy uses EMA as high probability long-term trend filter and Alligator and Fractal combination as a short-term one. Methodology The strategy opens long trade when the following price met the conditions: 1. Price closed above EMA (by default, period = 100). Crossover is not obligatory. 2. Combination of Alligator and Williams Fractals shall consider current trend as an upward (all details in "Justification of Methodology" paragraph) 3. Both AC and AO shall print two consecutive increasing values. At the price candle close which corresponds to this condition algorithm opens the first long trade with 10% of capital. 4. If combination of Alligator and Williams Fractals shall consider current trend has been changed from up to downtrend, all long trades will be closed, no matter how many trades has been opened. 5. If AO and AC both continue printing the rising values strategy opens the long trade on each candle close with 10% of capital while number of opened trades reaches 5. 6. If AO and AC both has printed 5 rising values in a row algorithm close all trades if candle's low below the low of the 5-th candle with rising AO and AC values in a row. Script also has additional visuals. If second long trade has been opened simultaneously the Alligator's teeth line is plotted with the green color. Also for every trade in a row from 2 to 5 the label "Buy More" is also plotted just below the teeth line. With every next simultaneously opened trade the green color of the space between teeth and price became less transparent. Strategy settings In the inputs window user can setup strategy setting: EMA Length (by default = 100, period of EMA, used for long-term trend filtering EMA calculation). User can choose the optimal parameters during backtesting on certain price chart. Justification of Methodology Let's explore the key concepts of this strategy and understand how they work together. We'll begin with the simplest: the EMA. The Exponential Moving Average (EMA) is a type of moving average that assigns greater weight to recent price data, making it more responsive to current market changes compared to the Simple Moving Average (SMA). This tool is widely used in technical analysis to identify trends and generate buy or sell signals. The EMA is calculated as follows: 1.Calculate the Smoothing Multiplier: Multiplier = 2 / (n + 1), Where n is the number of periods. 2. EMA Calculation EMA = (Current Price) × Multiplier + (Previous EMA) × (1 − Multiplier) In this strategy, the EMA acts as a long-term trend filter. For instance, long trades are considered only when the price closes above the EMA (default: 100-period). This increases the likelihood of entering trades aligned with the prevailing trend. Next, let’s discuss the short-term trend filter, which combines the Williams Alligator and Williams Fractals. Williams Alligator Developed by Bill Williams, the Alligator is a technical indicator that identifies trends and potential market reversals. It consists of three smoothed moving averages: Jaw (Blue Line): The slowest of the three, based on a 13-period smoothed moving average shifted 8 bars ahead. Teeth (Red Line): The medium-speed line, derived from an 8-period smoothed moving average shifted 5 bars forward. Lips (Green Line): The fastest line, calculated using a 5-period smoothed moving average shifted 3 bars forward. When the lines diverge and align in order, the "Alligator" is "awake," signaling a strong trend. When the lines overlap or intertwine, the "Alligator" is "asleep," indicating a range-bound or sideways market. This indicator helps traders determine when to enter or avoid trades. Fractals, another tool by Bill Williams, help identify potential reversal points on a price chart. A fractal forms over at least five consecutive bars, with the middle bar showing either: Up Fractal: Occurs when the middle bar has a higher high than the two preceding and two following bars, suggesting a potential downward reversal. Down Fractal: Happens when the middle bar shows a lower low than the surrounding two bars, hinting at a possible upward reversal. Traders often use fractals alongside other indicators to confirm trends or reversals, enhancing decision-making accuracy. How do these tools work together in this strategy? Let’s consider an example of an uptrend. When the price breaks above an up fractal, it signals a potential bullish trend. This occurs because the up fractal represents a shift in market behavior, where a temporary high was formed due to selling pressure. If the price revisits this level and breaks through, it suggests the market sentiment has turned bullish. The breakout must occur above the Alligator’s teeth line to confirm the trend. A breakout below the teeth is considered invalid, and the downtrend might still persist. Conversely, in a downtrend, the same logic applies with down fractals. In this strategy if the most recent up fractal breakout occurs above the Alligator's teeth and follows the last down fractal breakout below the teeth, the algorithm identifies an uptrend. Long trades can be opened during this phase if a signal aligns. If the price breaks a down fractal below the teeth line during an uptrend, the strategy assumes the uptrend has ended and closes all open long trades. By combining the EMA as a long-term trend filter with the Alligator and fractals as short-term filters, this approach increases the likelihood of opening profitable trades while staying aligned with market dynamics. Now let's talk about the trading zones concept and its signals. To understand this we need to briefly introduce what is AO and AC. The Awesome Oscillator (AO), developed by Bill Williams, is a momentum indicator designed to measure market momentum by contrasting recent price movements with a longer-term historical perspective. It helps traders detect potential trend reversals and assess the strength of ongoing trends. The formula for AO is as follows: AO = SMA5(Median Price) − SMA34(Median Price) where: Median Price = (High + Low) / 2 SMA5 = 5-period Simple Moving Average of the Median Price SMA 34 = 34-period Simple Moving Average of the Median Price The Acceleration/Deceleration (AC) Indicator, introduced by Bill Williams, measures the rate of change in market momentum. It highlights shifts in the driving force of price movements and helps traders spot early signs of trend changes. The AC Indicator is particularly useful for identifying whether the current momentum is accelerating or decelerating, which can indicate potential reversals or continuations. For AC calculation we shall use the AO calculated above is the following formula: AC = AO − SMA5(AO) , where SMA5(AO)is the 5-period Simple Moving Average of the Awesome Oscillator When the AC is above the zero line and rising, it suggests accelerating upward momentum. When the AC is below the zero line and falling, it indicates accelerating downward momentum. When the AC is below zero line and rising it suggests the decelerating the downtrend momentum. When AC is above the zero line and falling, it suggests the decelerating the uptrend momentum. Now let's discuss the trading zones concept and how it can create the signal. Zones are created by the combination of AO and AC. We can divide three zone types: Greed zone: when the AO and AC both are rising Red zone: when the AO and AC both are decreasing Gray zone: when one of AO or AC is rising, the other is falling Gray zone is considered as uncertainty. AC and AO are moving in the opposite direction. Strategy skip such price action to decrease the chance to stuck in the losing trade during potential sideways. Red zone is also not interesting for the algorithm because both indicators consider the trend as bearish, but strategy opens only long trades. It is waiting for the green zone to increase the chance to open trade in the direction of the potential uptrend. When we have 2 candles in a row in the green zone script executes a long trade with 10% of capital. Two green zone candles in a row is considered by algorithm as a bullish trend, but now so strong, that's the reason why trade is going to be closed when the combination of Alligator and Fractals will consider the the trend change from bullish to bearish. If id did not happens, algorithm starts to count the green zone candles in a row. When we have 5 in a row script change the trade closing condition. Such situation is considered is a high probability strong bull market and all trades will be closed if candle's low will be lower than fifth green zone candle's low. This is used to increase probability to secure the profit. If long trades are initiated, the strategy continues utilizing subsequent signals until the total number of trades reaches a maximum of 5. Each trade uses 10% of capital. Why we use trading zones signals? If currently strategy algorithm considers the high probability of the short-term uptrend with the Alligator and Fractals combination pointed out above and the long-term trend is also suggested by the EMA filter as bullish. Rising AC and AO values in the direction of the most likely main trend signaling that we have the high probability of the fastest bullish phase on the market. The main idea is to take part in such rapid moves and add trades if this move continues its acceleration according to indicators. Backtest Results Operating window: Date range of backtests is 2023.01.01 - 2024.12.31. It is chosen to let the strategy to close all opened positions. Commission and Slippage: Includes a standard Binance commission of 0.1% and accounts for possible slippage over 5 ticks. Initial capital: 10000 USDT Percent of capital used in every trade: 10% Maximum Single Position Loss: -9.49% Maximum Single Profit: +24.33% Net Profit: +4374.70 USDT (+43.75%) Total Trades: 278 (39.57% win rate) Profit Factor: 2.203 Maximum Accumulated Loss: 668.16 USDT (-5.43%) Average Profit per Trade: 15.74 USDT (+1.37%) Average Trade Duration: 60 hours How to Use Add the script to favorites for easy access. Apply to the desired timeframe and chart (optimal performance observed on 4h BTC/USDT). Configure settings using the dropdown choice list in the built-in menu. Set up alerts to automate strategy positions through web hook with the text: {{strategy.order.alert_message}} Disclaimer: Educational and informational tool reflecting Skyrex commitment to informed trading. Past performance does not guarantee future results. Test strategies in a simulated environment before live implementation These results are obtained with realistic parameters representing trading conditions observed at major exchanges such as Binance and with realistic trading portfolio usage parameters. Chiến lượccủa Skyrexio419