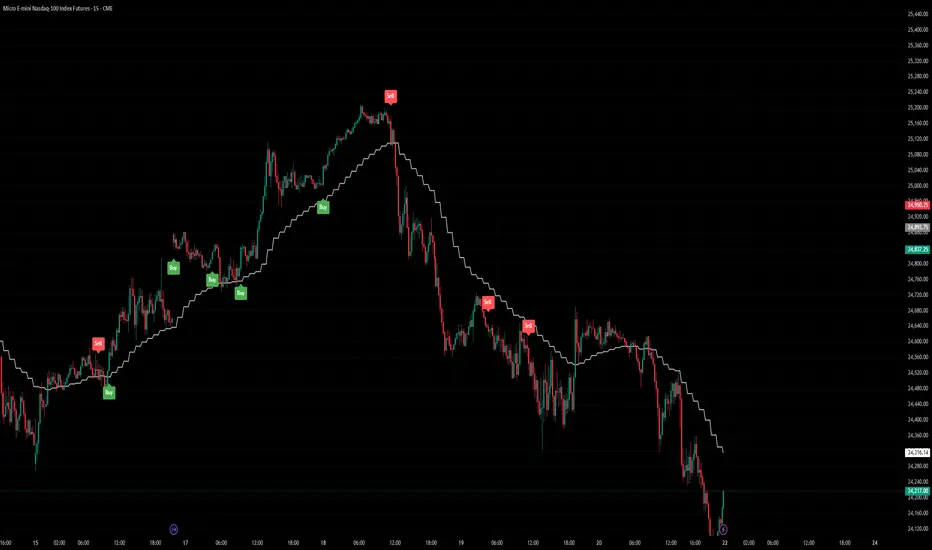
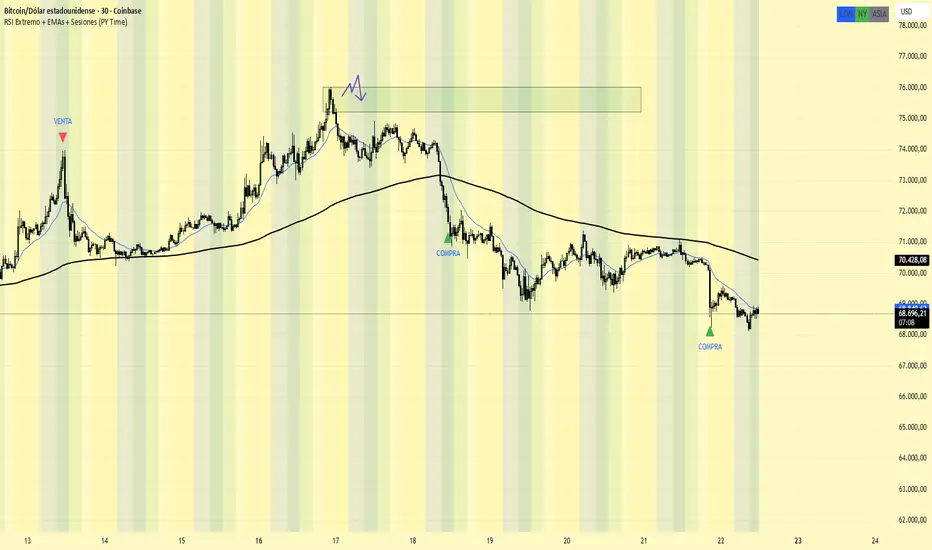
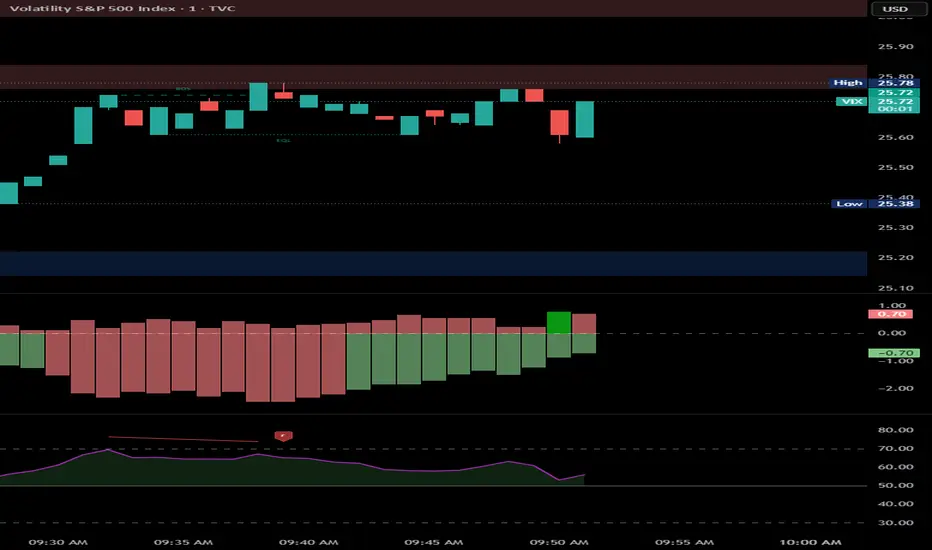
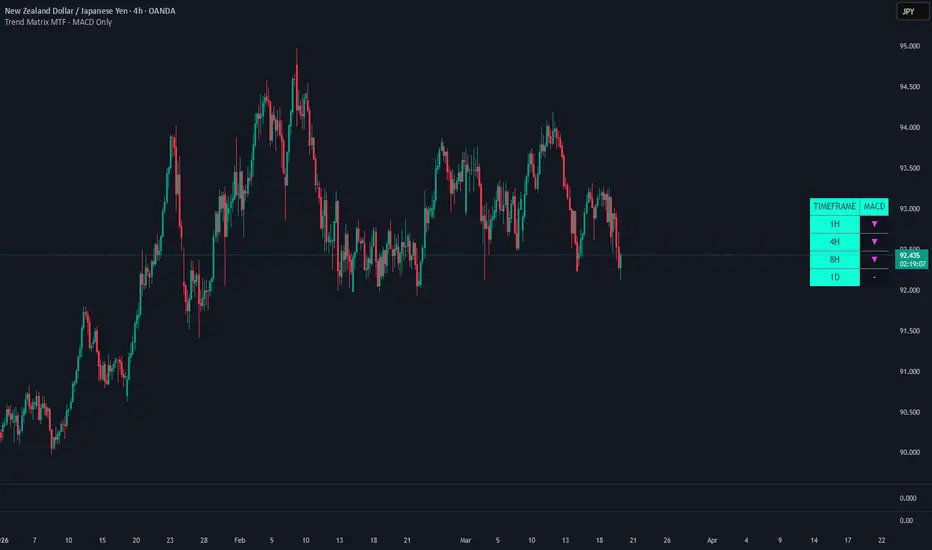
MVSH Fractal Alignment System StrategyThe script is based on the 3-candle fractal pattern using two timeframes: daily and 30 minutes. highly successful on EURUSD and GBPUSDChiến lượccủa LVWD_MVSH14
VCP Historical Score Histogram PM📊 VCP Historical Score Histogram The VCP Historical Score Histogram is a specialized companion tool to the Pro Dashboard, designed to visualize the "silent" contraction of volatility over the history of a stock. While standard price action can look random, the VCP Score reveals the underlying institutional accumulation and the precise moments when a stock becomes "tight" enough to explode. 🔍 Why Use the Histogram? VCP (Volatility Contraction Pattern) trading is all about timing. This indicator maps the multi-metric VCP Scoring Engine (0-100) across every bar on the chart, allowing you to identify Volatility Cyclicity. By observing the score historically, you can: Spot Accumulation: See the score gradually climbing from <30 to >70 as the "weak hands" are shaken out. Verify Tightness: Historically correlate price consolidations with BBW (Bollinger Band Width) percentiles. Detect Energy Buildup: High scores sustained over many weeks indicate a "coiled spring" setup. 🎨 Visual Intelligence The histogram uses a sophisticated color-coding system to help you interpret the setup at a glance: 🔥 Emerald Green (70 - 100): High Conviction Zone. The stock is in a maximum contraction state with bullish trend alignment and high relative strength. 🟡 Gold (50 - 69): Watchlist Zone. Volatility is contracting, but the setup may need one more "t" (tightening) or a volume dry-up. 🔘 Slate Grey (< 50): Standard/Loose Action. The stock is either in a broad base or hasn't yet entered a high-probability VCP state. ⚡ Key Features Peak Labeling: Automatically identifies and labels local score peaks, helping you find historical pivot highs where the setup was at its "tightest." Squeeze Persistence: Features a built-in background highlight for TTM Squeeze states, allowing you to see how many bars the price has remained compressed before a move. Benchmark Integration: Directly compares the symbol's momentum against a benchmark (like NIFTY 500) to ensure you are only trading the leaders of the market. 📉 Best Used With This script is designed to be placed in a separate pane below the price chart. To complete the professional setup, use it alongside the VCP Pro Single Symbol Dashboard to have both deep-dive live metrics and historical trend visibility. Methodology: Ported from Mayya Capital's quantitative VCP strategy research, focusing on Bollinger Band Width contraction, RVOL dry-ups, and 52-week high proximity. "In the stock market, quiet action is often the precursor to loud gains."Chỉ báocủa Forex_Trading_Karnataka44
Trend Energy Filter 🚀 Trend Energy Filter Introducing a new dimension in trend analysis: Trend Energy. In automotive systems (like ECU sensor data), we use hysteresis and noise-gates to prevent "jitter" from triggering false responses. This script applies that same logic to Momentum (Trend Energy): ENERGY: Measures the "Engine Load" of the trend by calculating the distance from a long-term SMA. NOISE FILTER: Uses an ATR-based threshold. The Energy value only updates if the change is significant, effectively filtering out the "market static" that causes false signals. EXHAUSTION: Detects when the "Fuel" is running out by identifying peaks in energy and subsequent cooling. While this type of signal processing is often hidden inside expensive commercial "black box" tools, this script provides it as a transparent, open-source engineering solution. While standard indicators look at price in isolation, the Trend Energy Filter analyzes the "tension" between price and its long-term baseline (SMA). By focusing on the Surface Area of this tension, we gain a visual representation of market conviction that has been largely overlooked by traditional technical analysis. The Innovation of the "Energy Surface" Most traders view moving averages as simple static lines. The Trend Energy Filter reimagines the gap between price and the SMA as a dynamic surface. Volumetric Visualization: Instead of thin lines, the indicator uses a neon-glow "Surface" with vertical gradients. This represents the total "Energy" currently held by the trend. Volatility-Adjusted Noise Filter: Unlike standard oscillators that whipsaw during consolidation, this script utilizes a state-persistent ATR filter. It only updates the "Surface" when market energy moves significantly, effectively silencing the noise of minor price fluctuations. XAUUSD 15min Peak-Based Exhaustion Logic: By tracking the Highest energy peaks over a lookback period, the script identifies when a trend's "batteries" are running low—turning the surface blue when momentum begins to stall. How to Trade with the Energy Surface: 1. Entering the Energy Flow (Momentum Resumption) Watch for the "Surface" to break above its previous peak. When the color shifts from the "Exhaustion Blue" back to a vibrant Bullish Green or Bearish Red, it signals that the market has finished its rest and is ready to expand the surface area again. NAS100 15min Signal: Momentum Increasing alert. 2. Spotting the Blow-Off (Exhaustion Detection) When the "Surface" is high but begins to contract (falling below its recent high), the trend is becoming "over-extended" or "exhausted." This is the ideal time to take profits or tighten trailing stops. Visual: The surface turns blue (#5b9cf6) while still at high levels. NAS100 15 min 3. The Squeeze (Energy Compression) When the Energy Surface is exceptionally low and the Noise Filter prevents it from fluctuating, the market is in a "coiled spring" state. A sudden expansion of the surface from a flat baseline often precedes a massive directional breakout. NAS100 15min 4. Baseline Context Green Surface: Price is above the 200 SMA (Bullish Energy). Red Surface: Price is below the 200 SMA (Bearish Energy). Blue Surface: Trend is pausing or mean-reverting (Exhaustion).Chỉ báocủa TheRealHawk53
NQ 5m StructureThis indicator combines four core SMC/ICT concepts into one clean, minimal overlay — designed for NQ and MNQ futures traders on the 5m chart. Swing Rays Confirms pivot highs and lows using configurable swing length. Each confirmed point prints a short dashed ray extending right — marking unmitigated structural levels without cluttering the chart with infinite lines. Auto Fib Retracement Automatically anchors a Fibonacci retracement to the most recent confirmed swing leg. Draws 0 / 0.382 / 0.5 / 0.618 / 1 levels and updates direction based on whether the last pivot was a high or low. Use the 0.618 zone for OTE entries in line with bias. Dual Timeframe EMA Bias Plots EMA 20 and EMA 50 on both the current timeframe and a configurable HTF (default 15m). The bias label shows four states: ▲ LONG — full conviction long ▼ SHORT — full conviction short ▲ HTF LONG / 5m ▼ — caution, pullback in uptrend ▼ HTF SHORT / 5m ▲ — caution, bounce in downtrend Liquidity Levels Detects equal highs (EQH) and equal lows (EQL) within a configurable threshold — the stacked liquidity pools NQ targets before reversing. Equal levels print solid and bright. Regular swing BSL/SSL print faded and dashed. When a level is swept (wick through, close back) it turns gray with a ✂ tag. Settings: Swing Length (default 7 for NQ/MNQ) Ray Length (default 20) EMA Fast/Slow (default 20/50) HTF Timeframe (default 15m) Fib Extension (default 60 bars) Equal H/L Threshold % (default 0.05%) Liquidity Ray Length (default 30) Recommended Use: Wait for HTF and LTF bias to agree (green or red label) Identify nearest EQH or EQL as the draw on liquidity Wait for price to sweep the level and retrace into the 0.618–0.705 OTE zone Enter on bullish or bearish candle close confirmation at the fib level Instruments: NQ, MNQ, MGC, CL, MCL Timeframe: Best on 5m — use 15m for bias confirmationChỉ báocủa plyboylu23
OpenRoad_NiftyOptions **Open Road V3 — NIFTY Weekly Option Selling Framework** A rules-based, regime-aware indicator for NIFTY 50 weekly option sellers. Built from 3 years of backtested data (Apr 2023–Apr 2026), this framework tells you *what* to sell, *where* to sell it, and *when to sit out* — every Wednesday morning. **How It Works** The indicator runs two engines: *Engine A — Weekly Directional Spreads* Uses a V2 Regime Filter (2-of-3 vote system) to determine market direction, then generates exact credit spread strikes with 200-point wings. In a bear regime, it signals bear call spreads. In a bull regime, bull put spreads. In range-bound markets, iron condors. VIX-based position sizing automatically scales you down in high or low volatility. *Engine C — Monthly Iron Condor* Activates only during calm, range-bound months when VIX is below 16. Places wide iron condors at 1.5× the monthly expected move with 300-point wings. Designed as a carry engine for low-volatility environments. **The V2 Regime Filter** Three independent signals vote on market direction: 1. EMA Slope — Rate of change of EMA20 normalized by ATR. Catches trend acceleration early. 2. Consecutive Closes — Counts days closing above/below EMA20. 4+ consecutive closes = directional conviction. 3. 5-Day Range Position — Where price sits within its recent range. Near the bottom = bearish, near the top = bullish. If 2 of 3 agree → trade that direction only. No agreement → iron condor or skip. **Dashboard (Top-Right)** Live readings updated every bar: - Regime verdict + individual signal values - India VIX level with color coding - Position size % (auto-adjusted by VIX) - Strike multiplier (1.3× wider strikes when VIX < 12) - Weekly expected move in points - Engine A structure and exact strikes - Engine C status and reason if skipped **Chart Visuals** - Background color: red (bear), green (bull), orange (range) - Step-lines showing sell and buy strikes for active spreads - Yellow shaded expected move zone - Wednesday labels with full trade details (structure, strikes, VIX, sizing) - Blue monthly IC labels when Engine C activates **VIX-Based Sizing** | VIX | Size | Strike Mult | |---|---|---| | < 10 | 50% | 1.3× wider | | 10–12 | 75% | 1.3× wider | | 12–20 | 100% | 1× | | 20–25 | 75% | 1× | | 25–35 | 50% | 1× | | > 35 | Skip | — | **Key Design Principles** - Risk-first: every signal includes position sizing and defined max loss - No naked selling — all structures are defined-risk credit spreads - Regime-aware: doesn't blindly sell iron condors into trends - Low-VIX adapted: wider strikes (1.3×) when premiums are thin, validated by backtest - Monthly IC only in confirmed range markets — avoids selling premium into crashes **How to Use** 1. Apply to NIFTY 50 daily chart 2. Set VIX Symbol to `NSE:INDIAVIX` in settings 3. Check dashboard every Wednesday morning 4. Execute the indicated structure at the shown strikes on your broker 5. Hold to Tuesday expiry. Stop at 2× premium loss. **What This Is NOT** This is not a signal generator or auto-trader. It is a decision framework that shows you the regime, the structure, and the strikes. You still need to check option chain liquidity, verify bid-ask spreads, and size according to your capital. **Settings** All parameters are adjustable: EMA length, slope threshold, consecutive close count, range position thresholds, wing widths, VIX thresholds, and strike multipliers. Defaults are the backtested values. Built as part of the Open Road project — documenting the journey of learning institutional NIFTY option selling from first principles. Chỉ báocủa distinctSeahor2028711
Vegas Tunnel REAL MTF SMOOTHThe Vegas Tunnel REAL MTF SMOOTH is a multi-timeframe trend structure based on the classic Vegas Tunnel EMAs (144 / 169), enhanced with real higher-timeframe data and additional smoothing to eliminate step-like movements. 🔹 Concept This indicator combines multiple timeframes into a single chart, allowing traders to clearly identify market structure, trend direction, and potential entry zones. Included tunnels: Chart Timeframe – execution & timing ×5 Timeframe – short-term trend ×15 Timeframe – intraday direction ×60 Timeframe – higher timeframe trend ×240 (4H) – macro bias / institutional structure All tunnels are based on: EMA 144 EMA 169 🔹 Key Features True HTF calculation using request.security → no artificial multiplier logic EMA smoothing applied → removes stair-step behavior from HTF data Clean visual hierarchy → easy distinction between trend layers Stable and non-repainting structure 🔹 How to Use Trend Direction Price above all tunnels → bullish environment Price below all tunnels → bearish environment High-Probability Setups Pullbacks into the Chart or ×5 tunnel While ×15, ×60, and ×240 remain aligned in trend direction Warning Conditions Tunnels flatten or begin to overlap → indicates consolidation / low trend strength 🔹 Role of the 4H Tunnel The 4H tunnel acts as: higher timeframe trend anchor dynamic support/resistance zone institutional bias reference Many strong market moves originate from reactions at this level. 🔹 Settings EMA lengths (default: 144 / 169) Customizable timeframes Adjustable smoothing (recommended: 3–8) 🔹 Notes This indicator does not generate direct buy or sell signals. It is designed for structural analysis and trend-based decision making. Best used in combination with: volume analysis price action momentum indicators 🔹 Summary The Vegas Tunnel REAL MTF SMOOTH provides a clear, multi-timeframe view of market structure and is especially useful for traders focusing on trend continuation, pullbacks, and high-probability setups. Trade smart and stay disciplined.Chỉ báocủa Sachse-1980Cập nhật 19
Gold Trend Signal Indicator📋 Trading Rules (For XAUUSD M10 Chart) 1. Entry Rules Long Entry: Enter a long position immediately when the green LONG label appears (20EMA crosses above 50EMA, uptrend confirmed). Short Entry: Enter a short position immediately when the red SHORT label appears (20EMA crosses below 50EMA, downtrend confirmed). 2. Stop-Loss Rules Long Stop-Loss: Place stop-loss order below the 50EMA line (adjust based on your risk tolerance, e.g., 0.5-1% below the line). Short Stop-Loss: Place stop-loss order above the 50EMA line (adjust based on your risk tolerance, e.g., 0.5-1% above the line). 3. Take-Profit Rules (Optional) Long Take-Profit: Set take-profit at 1.5-2x your risk (e.g., if you risk $100, target $150-$200 profit) or exit when 20EMA crosses back below 50EMA. Short Take-Profit: Set take-profit at 1.5-2x your risk or exit when 20EMA crosses back above 50EMA. 4. Parameter Adjustment (Optional) More Frequent Signals: Change Fast EMA Period to 10, Slow EMA Period to 30. More Reliable (Less Frequent) Signals: Change Fast EMA Period to 50, Slow EMA Period to 100 Clear Visualization: Blue 20EMA, orange 50EMA, green LONG labels, red SHORT labels, and trend background color for instant trend identification. The indicator is for reference only. The market may experience drastic changes at any time due to news events. When genuine trading opportunities arise in the market, I will also send you accurate trading signals for reference. Chỉ báocủa CsmillrSirrry1164
Artemis Oscillator PROArtemis Oscillator PRO is a momentum oscillator built on a custom Directional Range Momentum (DRM) engine — an original algorithm that measures signed range impulse, not price distance. Unlike RSI or Stochastic, DRM scores the direction and force of range expansion relative to its own history, normalized to 0–100. The result is an oscillator that reacts cleanly to structural momentum shifts without the lag inherent in traditional smoothed-ratio oscillators. The indicator integrates five analytical layers — oscillator core, volume pressure, momentum state scoring, divergence detection, and KNN machine learning bias — each operating independently and rendered on a single, clean oscillator panel. 🟦 HOW THE CORE ENGINE WORKS **Directional Range Momentum (DRM)** Each bar, the engine measures the current highest high and lowest low over the lookback period. It then assigns a signed range force: - If the range is expanding to the upside → positive force (full range span) - If the range is expanding to the downside → negative force (negative full span) - If range is stable → raw tick delta (neutral) This signed force is split into two smoothed components: - `sUp` — smoothed directed force (can be positive or negative) - `sAbs` — smoothed absolute force (always positive, represents total activity) The oscillator value is: `(sUp / sAbs) * 50 + 50` This produces a 0–100 scale where 50 is neutral, above 50 means upward range pressure dominates, and below 50 means downward range pressure dominates. Division by the absolute component normalizes the output regardless of asset volatility. **Signal Line** A second independently configurable smoothing pass over the oscillator value. Crossovers between the oscillator and signal line mark momentum regime changes. **Smoothing Methods** Four algorithms available for both oscillator and signal line: - RMA — Wilder's Moving Average (default, most stable, minimal overreaction) - EMA — Exponential, faster response - SMA — Simple, equal weight across all bars - TMA — Double-smoothed SMA, maximum smoothness 🟦 VOLUME PRESSURE **Dual MFI Architecture** Volume Pressure uses two Money Flow Index calculations simultaneously: - Fast MFI: `Period / 1.33` (shorter window, more reactive) - Slow MFI: `Period * 1.33` (longer window, structural bias) These are blended 50/50, then passed through a power-curve compression function (`x^0.75`) that reduces extreme readings while preserving directional accuracy. The result is mapped to 0–100 and rendered as fill areas anchored at the midline: - Above 50: Inflow fill (buying pressure dominates) - Below 50: Outflow fill (selling pressure dominates) The MFI price source is configurable: HLC3 (default), Close, HL2, or OHLC4. 🟦 MOMENTUM STATE SCORING A composite score from 0 to 3 is calculated each bar using three independent binary conditions: | Condition | +1 Point | |---|---| | Oscillator > Signal Line | Momentum direction | | Oscillator > 50 | Oscillator position | | Volume Pressure > 50 | Volume confirmation | **Score interpretation:** - Score 3 → Full overbought state fill (all three conditions bull-aligned) - Score 2 → Partial overbought fill (two conditions) - Score 1 → Partial oversold fill (one condition) - Score 0 → Full oversold state fill (all three conditions bear-aligned) Fills render inside the oscillator panel at adjustable opacity. The scoring is continuous — it updates every bar without look-ahead. 🟦 MOMENTUM EXHAUSTION Exhaustion labels (`✦ OB` / `✦ OS`) fire when the oscillator is inside a zone but weakening consecutively. Specifically: ✦ OB — oscillator is at or above the OB threshold AND has closed lower for N consecutive bars ✦ OS — oscillator is at or below the OS threshold AND has closed higher for N consecutive bars N (Confirmation Bars) is configurable from 1 to 4. Higher values produce fewer but more structurally confirmed signals. This is not a predictive signal — it marks the process of momentum fading, not the reversal itself. 🟦 DIVERGENCE DETECTION Pivots are calculated using `ta.pivothigh` and `ta.pivotlow` with an arm of `Period / 2`. All divergence results appear `Period / 2` bars late — this is standard Pine Script pivot behavior, not a bug. **Four divergence types:** | Type | Price | Oscillator | Signal | |---|---|---|---| | Regular Bull (D▲) | Lower Low | Higher Low | Potential reversal up | | Regular Bear (D▼) | Higher High | Lower High | Potential reversal down | | Hidden Bull (H▲) | Higher Low | Lower Low | Uptrend continuation | | Hidden Bear (H▼) | Lower High | Higher High | Downtrend continuation | Regular divergence uses solid lines. Hidden divergence uses dashed lines. Labels use clean symbol-only style with no background box. **Smart Divergence Filter (AI)** An optional pre-filter that rejects low-quality divergence signals before they render. Three conditions must pass (each configurable independently): 1. Minimum oscillator swing between the two pivot points (default: 5 units) 2. Minimum price swing as a percentage of recent range (default: 0.3%) 3. Volume Pressure confirmation — VP must agree with divergence direction When the filter is OFF, all detected divergences render. When ON, only structurally significant divergences pass. The filter applies identically to both chart rendering and alert conditions — no mismatch between visual and alert signals. 🟦 KNN BIAS PANEL **What KNN Does** K-Nearest Neighbors (KNN) is a non-parametric machine learning algorithm. Each bar, the indicator stores the current market state as a point in 3-dimensional feature space. When making a prediction, it finds the K historically most similar states and votes on the likely outcome. **The Three Features** | Feature | Calculation | Signal | |---|---|---| | O (Oscillator) | `oscVal / 100` | O+ = above 50 (bull zone) | | V (Volume) | `vpMid / 100` | V+ = above 50 (inflow) | | S (Signal gap) | `(oscVal - sigVal + 100) / 200` | S+ = oscillator above trigger | **ATR-Normalized Output Label** The classification target uses ATR-adjusted thresholds rather than a raw `close > close ` comparison. A bar is labeled bullish only if close moved more than `0.1 × ATR(14)` upward, bearish if it moved more than `0.1 × ATR(14)` downward, otherwise the previous label is carried forward. This eliminates noise-driven label flips caused by micro price movements. **Distance Calculation** Euclidean distance in 3D feature space: ``` d = sqrt((kf1_now - kf1_hist)^2 + (kf2_now - kf2_hist)^2 + (kf3_now - kf3_hist)^2) ``` The K nearest historical points vote. If majority voted bullish → BULL bias. Result thresholds: ≥60% bull vote = BULL, ≤40% = BEAR, between = NEUTRAL. **Panel Display** | Row | Left | Right | |---|---|---| | Header | KNN AI | Direction (▲ BULL / ▼ BEAR / ◈ NEUTRAL) | | Row 1 | Confidence | Percentage (0–100%) | | Row 2 | Progress bar (█░) | Bars in training memory | | Row 3 | O± V± S± feature states | K= neighbor count | Panel renders with monospace font, theme-aware backgrounds, and a single accent color derived from the active theme. 🟦 COLOR THEMES Eight complete palettes, each defining five independently tuned colors (bull, bear, signal, VP buy, VP sell): | Theme | Character | Bull Color | Bear Color | |---|---|---|---| | Aurora | Dark mode, high contrast | Cyan | Violet | | Ember | Dark mode, warm | Amber | Steel Blue | | Cyber | Dark mode, neon | Lime Green | Crimson | | Arctic | Dark mode, cool | Sky Blue | Soft Purple | | Solar | Dark mode, warm gold | Yellow Gold | Salmon | | Obsidian | Dark mode, pro trader | Emerald | Scarlet | | Classic | Light mode | Navy Blue | Crimson | | Mono | Light mode, minimal | Near Black | Gray | All five color roles (bull/bear/signal/VP buy/VP sell) change simultaneously when the theme changes. No per-color manual adjustment required. 🟦 ALERT SYSTEM Twelve alert conditions, all using `alert.freq_once_per_bar`: | Alert | Condition | |---|---| | Bullish Cross | Oscillator crosses above signal while below midline | | Bearish Cross | Oscillator crosses below signal while above midline | | Exit Oversold | Oscillator crosses above OS level | | Exit Overbought | Oscillator crosses below OB level | | Regular Bull Divergence | Price LL + oscillator HL (+ Smart Filter if enabled) | | Regular Bear Divergence | Price HH + oscillator LH (+ Smart Filter if enabled) | | Hidden Bull Divergence | Price HL + oscillator LL (+ Smart Filter if enabled) | | Hidden Bear Divergence | Price LH + oscillator HH (+ Smart Filter if enabled) | | VP Inflow | Volume Pressure crosses above 50 | | VP Outflow | Volume Pressure crosses below 50 | | Exhaustion OB | Oscillator weakening N bars while above OB level | | Exhaustion OS | Oscillator strengthening N bars while below OS level | Divergence alerts respect the Smart Divergence Filter — if the filter is ON and a divergence is rejected visually, the alert will also not fire. 🟦 SETTINGS REFERENCE **Oscillator** - Period — DRM lookback window. Also controls divergence pivot arm (Period / 2). Default: 14 - Smoothing — EMA / SMA / RMA / TMA. Default: RMA - Source — Price input for the range engine. Default: Close - Adaptive Color — Oscillator line shifts between bull/bear colors based on position. Default: ON **Signal Line** - Period — Signal smoothing window. Default: 7 - Smoothing — EMA / SMA / RMA / TMA. Default: EMA - Show Cross Dots — Dot on signal line at each crossover. Default: ON **Zones & Fills** - Overbought level — Default: 80 - Oversold level — Default: 20 - Zone fill opacity — Configurable per zone. Default: 20 **Volume Pressure** - Show Volume Pressure — Toggle. Default: ON - MFI Source — HLC3 / Close / HL2 / OHLC4. Default: HLC3 - Opacity — Default: 18 **Momentum State** - Show Momentum State — Toggle. Default: ON - OB Opacity / OS Opacity — Default: 35 each **Divergence** - Regular / Hidden — Independent toggles and opacity controls - Label Size — Tiny / Small / Normal / Large. Default: Tiny - Smart Divergence Filter — ON/OFF. Default: OFF - Min Oscillator Swing — Default: 5.0 - Min Price Swing % — Default: 0.3% - Require VP Confirmation — Default: ON **Momentum Exhaustion** - Show Labels — Toggle. Default: ON - Confirmation Bars — 1 to 4. Default: 4 **KNN Bias** - Show KNN Panel — Toggle. Default: ON - Neighbors (K) — 3 to 10. Default: 5 - Training Window — 50 to 300 bars. Default: 100 - Panel Position — Four corners. Default: Bottom Right - Panel Text Size — Tiny / Small / Normal / Large. Default: Small 🟦 COMPATIBILITY Works on all asset classes and all timeframes in TradingView Pine Script v6. - Crypto: Spot, futures, perpetual contracts - Forex: All pairs - Equities: Stocks, ETFs, indices - Commodities: Metals, energy, agriculture - Timeframes: 1m through Monthly The DRM engine normalizes by its own absolute smoothed component, making it volatility-agnostic across assets and timeframes without manual recalibration. 🟦 TECHNICAL NOTES - Pine Script v6 - max_lines_count = 500`, `max_labels_count = 500` (divergence drawings) - No repainting — all values calculated on bar close. Pivot-based divergence results appear `Period / 2` bars late by design - KNN training updates only after `bar_index > 1` to avoid cold-start artifacts - Volume Pressure fill anchors use `color = na` (not `display.none`) to maintain Pine v6 `fill()` compatibility - OB/OS state fills render outside the 0–100 oscillator range (104–110 and −10 to −4) to avoid visual overlap 🟦 DISCLAIMER This indicator is provided for educational and informational purposes only. It does not constitute financial advice. Past performance does not guarantee future results. Always conduct your own analysis and apply proper risk management. Chỉ báocủa a_jabbaroffCập nhật 2323 1.7 K
Nifty Institutional Trend Rider omHow this manages your "Big Lots" and "Cutting": High Conviction Entry: It only enters CE when the RSI is above 60. This means you aren't just guessing; you are entering when momentum is already strong. The "VWAP" Guard: Big players (FIIs/DIIs) use VWAP. By staying on the same side as VWAP, you avoid being "trapped" by big institutional sell-offs. Automatic "Cutting" (Trailing SL): The red line that appears on your chart when you are in a trade is your Trailing Stop Loss. As Nifty moves in your favor, this line moves up. If Nifty reverses by 0.5% (you can change this in settings), the script will signal to "Cut" the trade immediately. This protects your capital on big lot sizes. Long Term Trend: By using the 15-minute timeframe instead of 5-min, you will catch the moves that last for 2–3 hours (or even until the 3:30 PM close), which is where the real money is made in Nifty options.Chiến lượccủa sojiritesh200316
Sonic R + ComboThis is a very Line in in scripts, you have to select this line and this line is progressing with Fibonach Digits want to just developed more this script to specify the buy and sell pointsChỉ báocủa alamosmithi60788
Absorption Detector 2.0Detects institutional absorption patterns where large orders defend key price levels. Approximates order flow concepts using standard OHLCV data — no Level 2 or DOM data required. What is Absorption? Absorption occurs when one side of the market (buyers or sellers) aggressively attacks a price level, but price refuses to move. This happens because a large institutional order is sitting at that level, absorbing all incoming market orders. It's one of the strongest signals of institutional defense. Two Types of Absorption: BID Absorption (Bullish) — Sellers are aggressively hitting bids, volume is high, but price won't drop. Buyers are absorbing all selling pressure, defending support. Look for long entries after confirmation. ASK Absorption (Bearish) — Buyers are aggressively hitting asks, volume is high, but price won't rise. Sellers are absorbing all buying pressure, defending resistance. Look for short entries after confirmation. Signal Strength: BID / ASK (small) — Basic absorption detected. Score 1-3. BID🛡️ / ASK🛡️ (medium) — Strong absorption. Score 4. Multiple conditions confirmed. BID🛡️🛡️ / ASK🛡️🛡️ (large) — Extreme absorption. Score 5+. Highest conviction signal. x2+ (triangle) — Multiple tests at the same price level. The more times a level is tested and holds, the stronger the defense. Scoring System (0-6): The indicator scores each bar across five dimensions: volume intensity relative to average, body-to-range ratio (tiny body = tug of war), price stalling with high volume over multiple bars, close position combined with delta direction, and reversal candle confirmation. Info Panel: Real-time display of volume ratio, body/range percentage, candle close position, approximate delta direction, stalling detection, bid/ask absorption scores, and current signal status. How to Use: When you see a BID signal at a support level, it suggests buyers are defending. Wait for the next candle to confirm the bounce before entering long. When you see an ASK signal at resistance, sellers are defending. Wait for confirmation before entering short. Signals with the shield emoji and x2+ multiple tests are highest conviction. Features: - Works on any instrument, any timeframe - Approximates institutional absorption without Level 2 data - Three signal strength levels with scoring system - Multiple test detection at the same price level - Real-time info panel with absorption metrics - Bar coloring and background highlights - Built-in alert conditions for all signal types Note: This indicator approximates absorption using volume and price action. For true absorption confirmation, cross-reference with a DOM or Bookmap if available. Best results on instruments with reliable volume data (futures, stocks). CFD users should lower the Volume Spike Multiplier in settings.Chỉ báocủa YUHUNGTsai11182
XAUUSD Strong Reversal Probability by kimmoney making. dfknsgbjowdbv dbpjfnpkdvn dav b apdkv pkvn dgvnwegkvnw evg v;pkwegnpwegChỉ báocủa kimchitradesss1119
SMA 20, 50, 200Sure, if you want a professional English description for your script to keep your TradingView workspace clean and standard, here is a concise and technical version you can use. You can paste this directly into the description parameter of your indicator function: English Description for your Script: Title: MNQ Trend Following SMA Trio (20/50/200) Description: > This indicator is designed specifically for Micro E-mini Nasdaq-100 (MNQ) futures trading. It utilizes three Simple Moving Averages (SMA) to define market structure across multiple time horizons: SMA 20 (Blue): Short-term momentum and entry trigger. SMA 50 (Yellow): Intermediate-term trend and dynamic support/resistance. SMA 200 (Red): Long-term trend filter (The "Golden" line for directional bias). Trading Logic: Bullish Alignment: Price > SMA 20 > SMA 50 > SMA 200. Bearish Alignment: Price < SMA 20 < SMA 50 < SMA 200. Execution: Ideal for trend-following strategies using 30pt SL and 60pt TP with a 20pt Breakeven trigger.Chỉ báocủa uthi3u7
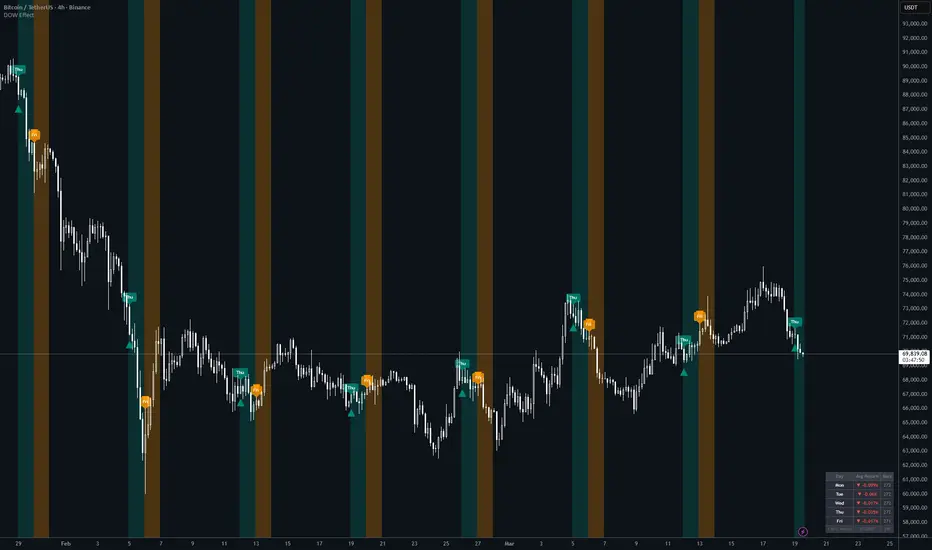
DTT Time based Ranges CVLT @CVLTraders · · Aug 14, 2025 Fibonacci using Like ICT said: Algo runs 20-30% of the range So we can project Turtle Soup Fibo on your TPD ( -0.1, -0.2, -0.3, -0.4, -0.5 STD ) to catch the Turtle Soup Entry while sSMT occurs OR you can use C2 as your Dealing Range and work with it on LTFChỉ báocủa provancha3382221
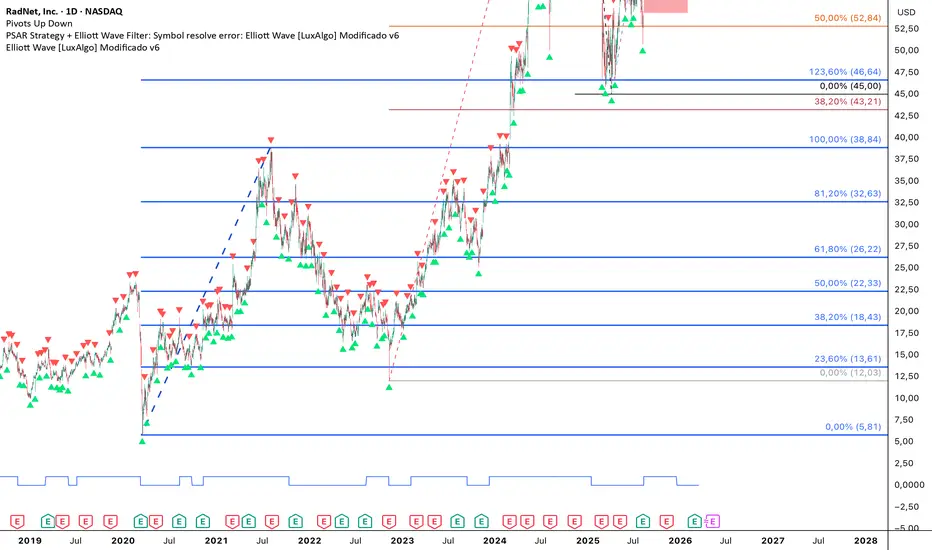
hungf10 Fibonacci Linreg + SR + VolThis is a very Line in in scripts, you have to select this line and this line is progressing with Fibonach Digits want to just developed more this script to specify the buy and sell pointsChỉ báocủa alamosmithi60788
Checklist FelipeFx95 Riesgo, Noticias, Ny, PD4, Chock. Checklist FelipeFx95 Riesgo, Noticias, Ny, PD4, Chock. Chỉ báocủa mtormu10122
VRP IV vs Realised Vol **Indicator name:** VRP — IV vs Realised Vol --- **What it calculates:** **Line 1 — India VIX (IV)** It pulls the daily closing value of India VIX directly from TradingView using `request.security("INDIAVIX", "D", close)`. This is your implied volatility — what the market expects NIFTY to move annually. **Line 2 — 20-day Realised Volatility (RV)** It calculates the actual movement of NIFTY over the past 20 trading days using log returns. The formula is: standard deviation of daily log returns × √252 × 100. This converts daily movement into an annualised percentage — same unit as VIX so you can compare them directly. **Line 3 — VRP** It subtracts RV from IV. The result is plotted as a histogram. --- **What you see on screen:** - **Green bar** — VIX is above 20-day RV. IV is overpricing actual movement. Selling has structural edge. Enter trades. - **Red bar** — VIX is below 20-day RV. IV is underpricing actual movement. No edge. Skip the week. - **Zero line** — the crossover point. Green above, red below. --- **How to read it practically:** | Bar colour | What it means | Action | |---|---|---| | Green and tall | High VRP — IV significantly above RV | Strong edge — full size | | Green and small | Low positive VRP — IV slightly above RV | Weak edge — half size | | Red | Negative VRP — IV below RV | No edge — sit out | --- **One important limitation:** VIX is a 30-day forward looking measure. RV is a 20-day backward looking measure. They are not perfectly matched in time horizon — but this is the most practical comparison available on TradingView without complex calculations. The signal is directionally correct even if not perfectly precise. Chỉ báocủa distinctSeahor2028710
Green and Red Candles following EMAThis indicator showing candles in Green when the trend is bullish and Red when the trend is Bearish. The label also marking the range of each swing. Chỉ báocủa Bonus79Cập nhật 99590
Teril hiken ashi EMA 20 Body Cross + 1:1 RR by innaHiken ashi EMA 20 body close 1:2 profit Hiken ashi EMA 20 body close 1:2 profit Hiken ashi EMA 20 body close 1:2 profit Hiken ashi EMA 20 body close 1:2 profitChỉ báocủa vismayateril27
MTF Momentum Heatmap A visual momentum heatmap that displays 10 bands of price momentum across different lookback periods, from fast (short-term) to slow (long-term). Inspired by professional momentum heatmap indicators. How it works: Each horizontal band represents a different momentum lookback period. The bottom band is the fastest (shortest period), and the top band is the slowest (longest period). Momentum is calculated as the normalized rate of change, smoothed to reduce noise. Color Scale: - Red / Orange / Yellow = Bullish momentum (price rising) - Blue / Cyan / Teal = Bearish momentum (price falling) - Green = Neutral / transition zone How to read it: - All bands same color = strong trend, high conviction - Color changing from bottom up = new trend building (fast momentum leading) - Color changing from top down = trend weakening (slow momentum fading) - Mixed colors = choppy / no clear direction — stay cautious Features: - 10 momentum bands with exponentially increasing lookback periods - Customizable base period, multiplier, and smoothing - Two overlay moving averages (fast & slow) — crossovers signal momentum shifts - Info panel showing fast/mid/slow momentum values and overall bias - Built-in alerts for all-bullish and all-bearish alignment - Works on any instrument, any timeframe Settings: - Base Period: Starting lookback length for the fastest band (default: 5) - Period Multiplier: How much each band increases (default: 1.5x) - Smoothing: Reduces noise in the bands (default: 3) - MA Type: EMA or SMA for smoothing Alerts: - All bands bullish - All bands bearish Chỉ báocủa YUHUNGTsai5
Exhaustion Detector Detects potential trend exhaustion using volume spikes combined with rejection wicks. How it works: The indicator uses a scoring system (0-6) that evaluates each candle across four dimensions: volume intensity relative to average, wick length relative to body size, candle close position, and prior trend context. A score of 4+ triggers a standard signal, 5+ triggers a strong signal. Bullish Exhaustion (bottom): After a downtrend, price shows a long lower wick with high volume and closes near the top of the candle — suggesting sellers are losing control. Bearish Exhaustion (top): After an uptrend, price shows a long upper wick with high volume and closes near the bottom — suggesting buyers are losing control. Volume-Price Divergence (DIV): Extreme volume with a tiny body indicates a tug-of-war between buyers and sellers. Signals: EXH↑ / EXH↓ = Exhaustion detected (score 4) EXH↑↑ / EXH↓↓ = Strong exhaustion (score 5+) DIV = Volume-price divergence Features: Works on any instrument, any timeframe Adjustable volume, wick, and trend parameters Info panel with real-time scoring Built-in alert conditions Chỉ báocủa YUHUNGTsai548
EGX Multi Symbol Accumulation Screener 20 EGX Multi Symbol Accumulation Screener 20 This indicator is designed to help investors in the Egyptian market quickly scan multiple stocks and identify the ones that are getting closer to technically suitable accumulation zones. It displays a group of stocks in one table with key data that long term investors usually need during review, including Current price Weekly RSI Daily RSI Distance between price and the daily EMA200 If the stock is above the daily EMA200 it is labeled Still Bullish and the percentage is shown as positive If the stock is below the daily EMA200 it is labeled Downtrend and the percentage is shown as negative Distance from the weekly SMA20 Distance from the lower Bollinger Band on the weekly timeframe Distance from the 3 month low Distance from the 6 month low Distance from the 52 week low The indicator also shows how many accumulation conditions are currently met for each stock, helping the user quickly focus on the names that deserve deeper review. The purpose of this indicator is not to generate direct buy or sell orders Its role is to provide an organized filtering tool that saves time and helps investors review many stocks more efficiently. This indicator is more suitable for medium term and long term investors It is not intended for short term trading or scalping. Main features Scans multiple stocks at once Highlights stocks getting closer to accumulation zones Shows the stock status relative to the daily EMA200 Still Bullish or Downtrend Displays the EMA200 distance as positive or negative depending on price location Uses visual coloring for faster reading Shows the number of conditions met for each stock Important note This indicator is a support tool for screening and review only It should be used together with chart review, fundamental analysis, and proper capital management before making any investment decisionChỉ báocủa khalidaladdin9