Trendlines NPTTự động kẻ các đường trenline trên biểu đồ.Dựa vào đó anh em có thể vào lệnh dựa theo trenline Chỉ báocủa PhiThanh198526
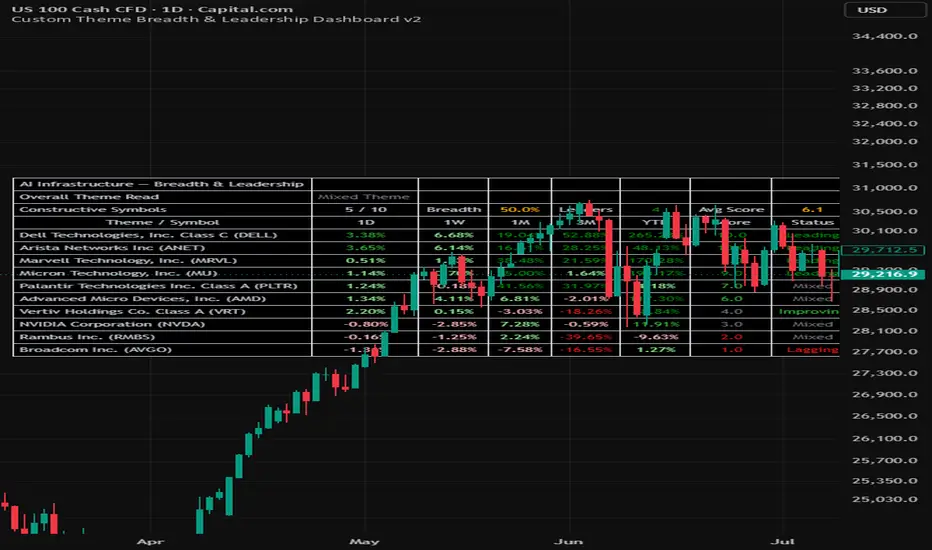
Custom Theme Breadth & Leadership DashboardCustom Theme Breadth & Leadership Dashboard This script is a customizable theme-breadth dashboard designed to help traders monitor whether a selected group of stocks or ETFs is showing broad participation, narrow leadership, mixed behaviour, or short-term weakness. The main purpose of the script is to help traders avoid looking at one symbol in isolation. Many strong market moves happen through themes, sectors, or related groups of stocks. For example, AI infrastructure may include semiconductors, memory, networking, data-centre hardware, power infrastructure and cooling. This dashboard allows users to place related symbols into one basket and quickly see whether strength is broad-based or limited to only a few names. The script is not a buy or sell signal. It is a decision-support tool for theme monitoring, sector rotation, watchlist review and relative leadership analysis. What the dashboard shows At the top of the table, the dashboard shows the overall condition of the selected basket: Overall Theme Read Constructive Symbols Breadth % Leaders Average Score Below the summary section, the table displays each selected symbol with the following columns: 1D: one-day rate of change 1W: five-trading-day rate of change 1M: twenty-one-trading-day rate of change 3M: sixty-three-trading-day rate of change YTD: year-to-date rate of change Score: a 0 to 10 participation score based on positive returns across multiple timeframes Status: a short-term participation label based on recent performance behaviour The score is designed to reward symbols that are positive across multiple timeframes. A symbol receives points for positive 1D, 1W, 1M, 3M and YTD performance, with additional bonus points for stronger 1W and 1M momentum. Status definitions Leading: 1W, 1M and 3M performance are all positive. Improving: 1D and 1W are positive, but 1M is still negative. Weakening: 1D and 1W are negative, but 3M is still positive. Lagging: 1W and 1M are both negative. Mixed: the symbol does not clearly fit into the other categories. Important note on “Weakening” A symbol can still be a strong longer-term leader and appear as “Weakening” if it has recently pulled back. For example, a stock may have very strong 3M or YTD performance but still be classified as Weakening if its 1D and 1W performance are negative. This is intentional. The dashboard is designed to show current participation and short-term behaviour, not only long-term leadership quality. Constructive Symbols Constructive Symbols means the number of enabled symbols currently classified as either Leading or Improving. This is a short-term participation measure. It does not mean that all other symbols are bad companies or poor long-term investments. It simply means they are not currently showing the short-term participation pattern required to be counted as constructive by this dashboard. Breadth % Breadth % shows the percentage of enabled symbols that are currently constructive. For example, if the dashboard shows 2 / 10 and 20%, it means that 2 out of the 10 enabled symbols are currently classified as either Leading or Improving. Leaders Leaders shows how many enabled symbols are classified as Leading. Average Score Average Score shows the average score across all enabled symbols in the selected basket. Overall Theme Read The script converts the breadth and average score into an overall theme interpretation: Broad Strength: many symbols in the basket are constructive and the average score is strong. Narrow Leadership: the average score is strong, but breadth is not broad enough. This can mean only a few leaders are carrying the theme. Mixed Theme: some symbols are working, but participation is uneven. Weak Theme: few symbols are constructive and the group is not showing broad strength. How to use 1. Choose Core Themes, Full Themes or Custom List mode. 2. In Custom List mode, enter the stocks or ETFs that represent the market theme you want to monitor. 3. Enable or disable symbols depending on your watchlist. 4. Use the Overall Theme Read to understand the condition of the basket. 5. Use Constructive Symbols and Breadth % to understand whether participation is broad or narrow. 6. Use the individual symbol rows to identify which names are leading, improving, weakening, lagging or mixed. 7. Use the dashboard together with your own chart analysis, support/resistance levels, volume, earnings dates and risk management. Example use cases A trader studying AI infrastructure could create a custom basket containing semiconductor, memory, networking, server, data-centre power and cooling names. If only one or two names are strong while the rest are weakening, the dashboard may show narrow leadership or a weak theme. If many names are leading or improving together, the dashboard may show broad strength. A trader studying sector rotation could use the Core Themes or Full Themes modes to compare ETFs and identify where participation is improving or deteriorating. Limitations This script does not predict price movement. It does not provide automatic buy or sell signals. It does not replace individual chart analysis. It does not account for earnings dates, company fundamentals, valuation or news. A strong dashboard reading should still be confirmed with price structure, volume, market condition and risk management. The script is designed to help traders quickly evaluate theme participation and leadership across a custom basket of symbols. Sample snapshots Chỉ báocủa Jambo1922Cập nhật 15
BOS + FVG ThanhNguyenChỉ báo BOS + FVG sẽ free cho ae hết tuần rồi mình chuyển qua private, ai muốn dùng chỉ cần đăng ký Backcom nhéChỉ báocủa PhiThanh198520
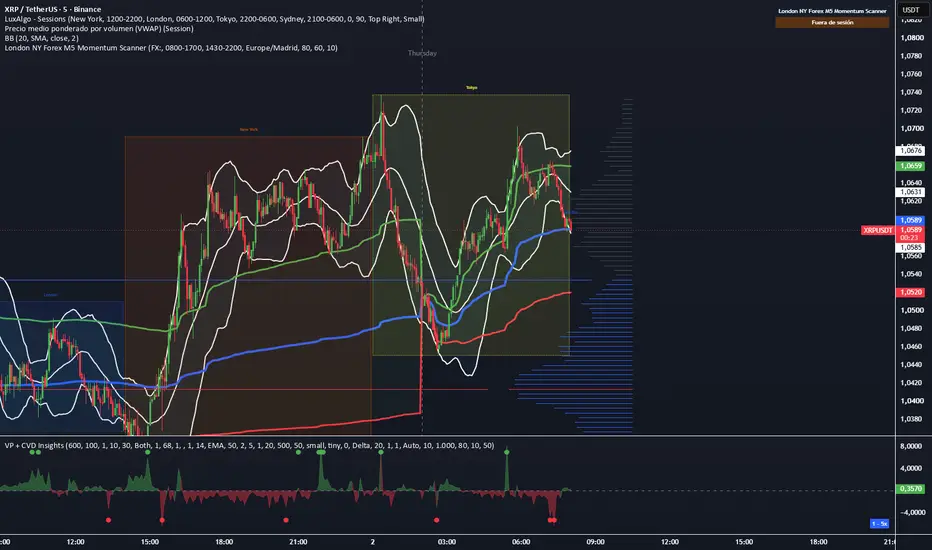
London NY Forex M5 Momentum scanner 15M 1Hescaner de forex con confirmaciones de tendencia por indicadores, y temporalidades mayores tanto en 15m y 1hChỉ báocủa angelesquinas10067
London NY Forex M5 Momentum Scannerescaner que busca los pares con mayor probabilidad de continuacion de tendencia, dando datos del momento en 5mChỉ báocủa angelesquinas10063
JBK Jurik Bougies Sans MechesJBK Jurik Bougies Sans Mèches paramétrables NOA/JBK setupChỉ báocủa JBK-one16
RSI + 2 MAThis indicator displays the RSI line together with 2 moving averages (MA) calculated on the RSI value itself — not MAs on price. The goal is to observe RSI momentum over time rather than reading the raw oscillator alone, helping to filter out noise and identify momentum trends more clearly. Calculation: RSI is calculated based on the source and length chosen by the user (default: close, length 14). MA 1 is applied to the RSI series (default: SMA 9) — reacts quickly to changes in RSI. MA 2 is applied to the RSI series (default: WMA 45) — smoother, representing medium-term momentum trend. Both MAs support 7 types: SMA, EMA, WMA, RMA, VWMA, HMA, TMA, and can be customized independently. How to read the signals: When the RSI line is above both MA lines → background fills green, indicating momentum is leaning bullish. When the RSI line is below both MA lines → background fills red, indicating momentum is leaning bearish. When RSI sits between the 2 MAs (no consensus) → background fills neutral gray. A reference line at 50 is plotted, and can be shown/hidden. Two built-in alertconditions are included: RSI crossing above both MAs, and RSI crossing below both MAs — for setting up automated alerts. Cách đọc tín hiệu: Khi đường RSI nằm trên cả 2 đường MA → nền tô xanh, thể hiện động lượng đang nghiêng về phía tăng. Khi đường RSI nằm dưới cả 2 đường MA → nền tô đỏ, thể hiện động lượng đang nghiêng về phía giảm. Khi RSI nằm giữa 2 MA (không đồng thuận) → nền tô xám trung tính. Đường mốc 50 được vẽ tham chiếu, có thể ẩn/hiện. Có 2 alertcondition dựng sẵn: RSI cắt lên trên cả 2 MA, và RSI cắt xuống dưới cả 2 MA — dùng để thiết lập cảnh báo tự động.Chỉ báocủa tienlq772
High/Low DayMarks high and lows of today and the previous day and removes them when they get taken outChỉ báocủa nyzilakos8
Daily OC_CRISopen close GAP, traccia due linee orizzontali per segnare eventuali zone di resistenza e supportoChỉ báocủa Albecris4
ICT Macro Lines - Today OnlyICT Macro Lines - Today Only is a visual intraday timing tool that marks selected ICT-style macro windows on the current trading day only. The script draws vertical Start, Mid and End markers for predefined New York session windows, including selected NY Macro windows, the NY AM Silver Bullet window, the Dangerous Lunch Macro, the PM Macro and the Power Hour window. The purpose of this indicator is to help intraday traders keep important time-based windows visible directly on the chart without manually drawing the same timing lines every day. This indicator does not generate buy or sell signals. It does not predict direction, measure trend strength, detect entries, or provide automated trade confirmation. It is a chart-organization tool focused only on time structure. How it works: The script uses the selected timezone, set by default to America/New_York, and calculates today’s timestamps for each enabled macro window. For each enabled window, it can draw three vertical markers: S = Start of the window M = Middle of the window E = End of the window The indicator can optionally hide time markers that have already passed during the current day. This keeps the chart cleaner during live intraday analysis. It can also display a compact table showing the enabled macro windows and their Start, Mid and End times. Dangerous Lunch Macro: The Lunch Macro window from 11:50 to 12:10 New York time is intentionally highlighted in red and labeled as Dangerous Lunch Macro. In this implementation, it is treated as a higher-risk ICT-style timing window. The red color is fixed and cannot be changed in the script settings. This red highlight is only a visual warning. It is not a buy signal, sell signal, entry confirmation or trade recommendation. Main features: - Today-only macro markers based on New York time. - Optional NY Macro windows. - Optional NY AM Silver Bullet window. - Optional Dangerous Lunch Macro window. - Optional PM Macro and Power Hour window. - Start / Mid / End vertical line markers. - Optional line labels: S/M/E, time, or full description. - Optional subtle background shading for active macro windows. - Optional macro table with window times. - Fixed red color for the Dangerous Lunch Macro. - Customizable line color for all other macro windows. - Customizable line style, width, text size and table position. - Designed for intraday charts. Suggested use: Use the script on clean intraday charts such as 1-minute, 3-minute, 5-minute or 15-minute charts. The markers are intended to help traders observe price behavior around specific time windows. Any trading decision should be based on the trader’s own trading model, risk management and market context. Originality and usefulness: This script is not a combination of unrelated indicators. Its purpose is to consolidate recurring ICT-style intraday time windows into a clean, configurable, today-only visual layout. Instead of manually drawing macro timing lines each session, the script automatically places the selected windows using New York time and lets the user control visibility, labels, background shading and the summary table. Limitations: - The script is intended for intraday timeframes. - It is a visual timing reference only. - It does not provide trade signals. - It does not determine market bias. - It does not include backtesting or performance claims. - It does not predict price direction. - Time windows are fixed and should be interpreted by the user within their own trading model. This publication is for educational and chart-organization purposes only.Chỉ báocủa T-kedaR12
R3D Active Range MTF LINE ONLYmarca rangos en muchas temporalidades, ideal para tener una vision mas clara de para donde podria ir el precio.Chỉ báocủa ecoloco366Cập nhật 6
bulindaidefengkuang6666666666666666666666666666666666666666666666666666666666666666666666666666666666666666666666666666666666666666666666666666666666666666666666666666666666Chỉ báocủa slqy33465
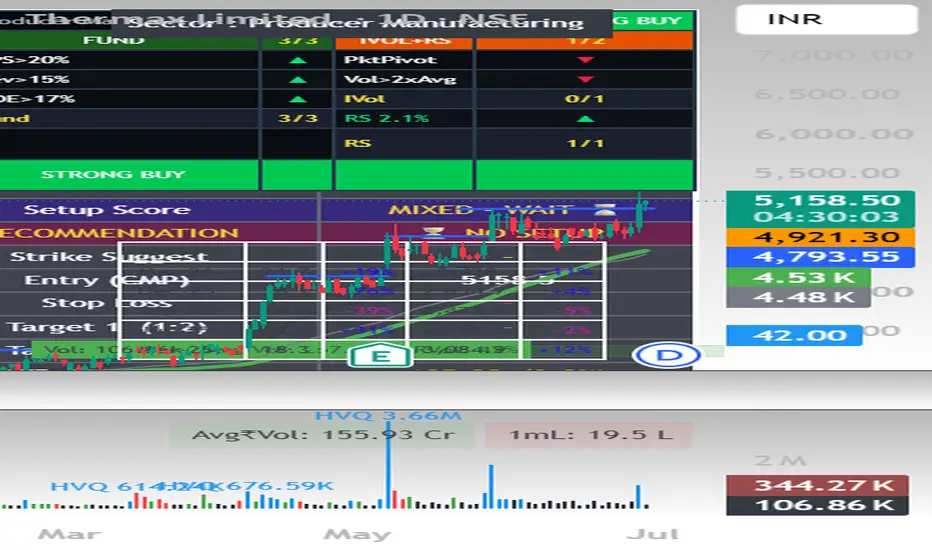
NSE F&O Option ScannerHow the Scoring Works (0–5 points) Each condition adds 1 point: ✅ 8 EMA above 20 EMA (trend direction) ✅ OI Proxy confirms direction (Volume + Price interpretation) ✅ Sector index trading above its 20 EMA ✅ RSI not in extreme zone (not overbought for CE / not oversold for PE) ✅ Volume spike ≥ 1.5× the 20-bar average Score ≥ 4 → High conviction signal → BUY CE or BUY PE label appears on chart Score 3 → Weak setup — wait for confirmation Score < 3 → No trade Dashboard Shows (top-right panel) 🔹 8/20 EMA trend + gap % 🔹 OI Proxy: Long Buildup / Short Buildup / Short Covering / Long Unwinding 🔹 Sector trend vs 20 EMA 🔹 Relative Strength vs sector (20-bar) 🔹 RSI (14) with overbought/oversold alert 🔹 MACD Histogram direction 🔹 Volume — Normal or Spike with multiplier 🔹 Setup Score (0–5) 🔹 Recommendation — 🟢 BUY CALL (CE) / 🔴 BUY PUT (PE) / ⏳ NO SETUP 🔹 Auto Strike Suggestion — ATM + 1 OTM (calculated from CMP) 🔹 Entry (CMP), Stop Loss, Target 1 (1:2), Target 2 (1:3) 🔹 ATR with volatility % 🔹 News reminder How to Use Add to any NSE F&O stock on Daily or 1H timeframe Change the Sector Index input to match the stock — NIFTY_BANK, NIFTY_IT, NIFTY_AUTO, NIFTY_PHARMA, NIFTY_FMCG, NIFTY_METAL etc. Read the dashboard — Score ≥ 4 = high conviction setup Always verify news and catalyst on NSE website or Screener.in before entering Set alerts using the 5 built-in alert conditions Built-in Alerts 🟢 Strong BUY CE — EMA cross + OI + Sector all aligned (score ≥ 4) 🔴 Strong BUY PE — EMA cross + OI + Sector all aligned (score ≥ 4) 📊 EMA Bull Cross — 8 EMA crossed above 20 EMA 📊 EMA Bear Cross — 8 EMA crossed below 20 EMA 📈 Volume Spike in Bull Trend Note on OI Data For real open interest data, switch to the futures chart (e.g. NSE:RELIANCE1!). On equity charts this script uses Volume + Price direction as an OI proxy, which closely mirrors standard OI interpretation (Long Buildup, Short Buildup, Short Covering, Long Unwinding). Settings All parameters are adjustable — EMA lengths, ATR multiplier, Risk:Reward ratio, OI proxy sensitivity, and sector index. Tooltips explain each input. ⚠️ For educational and analysis purposes only. Not financial advice. Always use proper risk managemenChỉ báocủa guru10145747
Technofunda Trade Scoring and RankingTechnofunda Trade Scoring and Ranking GOOD FOR SWING TRADERSChỉ báocủa guru1014575
ZH Market FilterBackground coloring (the core filter) paints the chart by market regime, based on Qullamaggie's MA idea. It compares a fast MA (10) and slow MA (20), and checks whether each is trending up versus 5 bars ago: * Dark green — 10 above 20, both trending up (strongest) * Light green — 10 above 20, only the 10 trending up (early/weakening) * Yellow — 10 above 20, neither trending up (stalling) * Black — anything else (downtrend or chop) Plotted lines: the 10-MA (red) and 20-MA (black), plus three toggleable reference SMAs — 50 (blue), 100 (orange), 200 (purple). Range-bound override lets you mark a consolidation manually. You enter four things: Range Top, Range Bottom, Start Date, and Range Color. From the start date forward, the background paints your chosen color — overriding the MA coloring — because you've called it range-bound. It ends automatically on the first candle that closes above the top or below the bottom, then reverts to the normal MA coloring for good. It's one range per start date (move the date forward to mark a new one), and it triggers on closes, not wick pokes. Metrics table (top-right) shows two readouts, pulled exactly from your ZH indicator: * QQQ — QQQ's daily % change * BRD — breadth, calculated as (new highs − new lows) / new lows × 100 from ATHI.US and ATLO.US Labels are white; values are green when positive, red when negative. A few practical notes: it's Pine v6, the metrics need ATHI.US/ATLO.US data on your plan (they work in your ZH script, so you're set), and if you leave the range prices at 0 it simply won't paint — no more flattened chart. One thing to keep in mind on the range start date: it has to be a date that exists on the chart, not in the future, or nothing paints.Chỉ báocủa htflagz42
Live R:R passa dig ludmilla för här kommer TPn, aja baja ludmilla annars kommer SL. Elller så blir det ingenting. Oavsett vad kan du se live RR från din kassa position blå **** Please let me fkn publish man i cant do it anymoreChỉ báocủa erminsakic10
Advanced Volatility1. Normalized ATR (%) - The Blue Line What it is: The standard Average True Range (ATR) divided by the current closing price. Why it matters: It tells you exactly what percentage the asset moves on an average bar. If the nATR is 2.0%, you know the asset swings roughly 2% per candle. This is incredibly useful for setting dynamic stop losses and take profits that scale mathematically with the asset's price, rather than guessing arbitrary dollar amounts. 2. BB Width (%) - The Orange Line What it is: The distance between the Upper and Lower Bollinger Bands, divided by the Middle Band. Why it matters: This acts as a highly effective "Squeeze" proxy. Volatility is cyclical; it contracts, then it expands. When you see the Orange line drop to extremely low historical levels, it means the Bollinger Bands are pinching tight. This contraction indicates that energy is building up, and a massive breakout/expansion move is imminent. 3. Historical Volatility (%) - The Fuchsia Line What it is: A strict statistical calculation heavily used in options pricing (often referred to as HV or Realized Volatility). It calculates the standard deviation of logarithmic returns over a period, and annualizes it (multiplying by √252 trading days). Why it matters: It gives you the "true" statistical variance of the asset. A rising Fuchsia line means the market is becoming highly chaotic and unpredictable, while a falling line means the market is returning to a stable, directional grind. By layering all three of these metrics on one panel, you can easily spot when a market has compressed to zero (all lines dropping near the Zero Base) right before a massive trend erupts!Chỉ báocủa greymyst12
Liquidity Sweep Intelligence - ML Post-Sweep [Dots3Red]█ LIQUIDITY SWEEP INTELLIGENCE — KNN POST-SWEEP Usually, a liquidity indicator shows where the price is likely to go to take liquidity. This one tells you what tends to happen after it gets there. When price sweeps a swing high or low — triggering the stop orders sitting there — we face the immediate question: does it reverse (a stop hunt, fade the move) or does it continue (a genuine breakout)? The answer depends on context. This script tracks every historical sweep on your chart, records the contextual features at the moment it happened, and uses a KNN (K-Nearest Neighbors) model to find the most similar past sweeps and return their actual measured outcomes. The probability shown is not derived from a formula. It is counted from real historical sweeps on your chart. █ HOW IT WORKS 1. Pool Detection Swing highs and swing lows are detected using two pivot lengths — a primary (default 10 bars each side) and a secondary (default 8 bars each side) — to capture both major and minor liquidity levels. Same-side pivots that form within the Equal-Level Tolerance % of each other are merged into a single stronger pool, marked with the ⊜ symbol. These are equal highs (EQH) or equal lows (EQL) — two peaks or two troughs at nearly the same price — which represent a higher concentration of stop orders than a single pivot. Unswept pools are shown as lines on the chart: dashed for single pivots, solid for equal-level pools. Pools expire after the configured maximum age (default 50 bars) without generating a sweep record. 2. Sweep Detection A sweep is registered when the close price exceeds a pool level by more than the Sweep Buffer (default 1.4 × ATR). This buffer filters out minor wicks that barely touch a level and requires a genuine close beyond it. At the moment of the sweep, the script records: • The direction (high swept or low swept) • Whether the pool was an equal-level cluster (EQH/EQL) • How old the pool was in bars • The current ATR ratio (current volatility relative to the 50-bar baseline) • Whether the sweep occurred inside an ICT killzone window 3. Outcome Measurement After the Outcome Window (default 10 bars), the script measures what price actually did. For a swept high, it calculates how far price retraced downward and how far it continued upward, both expressed in ATR units. For a swept low, the directions are reversed. If the retracement exceeded the Reversal Threshold (default 3.5 × ATR), the sweep is classified as a reversal. Otherwise it is classified as a continuation. The result is stored in the KNN training data. 4. KNN Inference The K-Nearest Neighbors model uses a 5-feature vector for each sweep: • sweep_dir — was a high swept (1) or a low swept (0)? • age_norm — how old was the pool when swept, normalized 0–1 • is_equal — was it an EQH/EQL cluster (1) or single pivot (0)? • atr_ratio_norm — current ATR divided by 50-bar ATR baseline, capped at 3× • in_kz — did the sweep occur inside a killzone window (1) or not (0)? For each active sweep, the model computes the Euclidean distance to every recorded historical sweep in the training window, finds the K nearest matches (default 15), and returns three values averaged across those neighbors: • Reversal probability — what percentage of matched sweeps reversed • Average reversal distance — how far the reversal moved in ATR units • Average continuation distance — how far the continuation moved in ATR units The KNN runs every third bar per event for performance. Output is displayed only after the minimum training threshold (default 20 samples) has been reached. 5. Killzone Context Four ICT killzone windows are tracked in New York time and used as a contextual feature in the KNN vector: • Asia KZ — 20:00 to 00:00 • London Open KZ — 02:00 to 05:00 • NY Open KZ — 07:00 to 10:00 • London Close KZ — 10:00 to 12:00 Sweeps that occur inside a killzone are marked with ⚡ in the label. The active killzone is also shown in the dashboard. █ READING THE LABEL Each active sweep displays a label at the right edge of the chart: ▲ HIGH SWEPT ⊜ ⚡ Rev 68% | +1.4 ATR | N=47 ▲ HIGH SWEPT — a swing high was swept (sell-side stops triggered) ⊜ — the pool was an equal-high cluster (stronger stop concentration) ⚡ — the sweep occurred inside a killzone window Rev 68% — 68% of the 47 matched historical sweeps reversed +1.4 ATR — the average reversal distance among those that reversed N=47 — 47 historical sweeps matched this context Label color follows sweep direction: orange-red for a swept high (bearish sweep), cyan for a swept low (bullish sweep). While training data is still being collected, the label shows: Training… (8/20 needed) █ LIQUIDITY VOID ZONE When a sweep candle has a long wick, there is a gap between the wick extreme and where price actually closed. This zone — where price moved through too fast for normal order flow — is drawn as a semi-transparent dashed box. It represents an imbalance that price frequently returns to fill. The void is colored by sweep direction. █ DASHBOARD The top-right table shows: • Session KZ — which killzone is currently active, if any • ATR Ratio — current ATR relative to the 50-bar baseline (amber above 1.5×) • KNN Training — progress bar showing recorded sweep outcomes vs maximum • Overall Rev % — total reversal rate across all recorded sweeps on this chart • Avg Rev Dist — average reversal move in ATR across all reversals • Avg Cont Dist — average continuation move in ATR across all continuations • Active Pools — number of unswept pools tracked, with EQH/EQL count • Pending Sweeps — sweeps waiting for their outcome window to complete • Resolved — count of confirmed reversals and continuations • KNN Features — reminder of the five features used in the model █ SETTINGS Pool Detection • Primary Pivot Length (10) — bars each side to confirm a major swing • Secondary Pivot Length (8) — bars each side for minor swings; 0 disables • Max Tracked Pools (60) — cap on active pools; oldest removed when exceeded • Max Pool Age (50 bars) — pools older than this are expired without recording • Equal-Level Tolerance % (3.0) — proximity threshold for EQH/EQL merging Sweep Settings • Sweep Buffer (1.4 × ATR) — minimum close beyond pool to register a sweep • Outcome Window (10 bars) — measurement window after each sweep • Reversal Threshold (3.5 × ATR) — minimum retracement to classify as reversal • Show Liquidity Void Zones — toggle the wick imbalance boxes • Max Historical Sweeps Shown — cap on how many past events are displayed KNN Engine • K Neighbors (15) — historical sweeps to average; higher = smoother, slower to adapt • Max Training Samples (400) — rolling window; oldest samples dropped when exceeded • Min Samples Before Display (20) — KNN output hidden until this threshold is reached • ATR Baseline Period (50) — period for the baseline ATR used in the volatility feature █ TIMEFRAME Works on any intraday timeframe. Most useful at 5-minute through 1-hour where enough sweeps accumulate to build meaningful training data within a single session. On daily charts, the training window fills slowly but the signals tend to be higher quality. The KNN model relearns continuously as new sweeps are recorded and old ones fall outside the rolling window. It adapts to the instrument and timeframe it is applied to. █ NOTES The reversal probability reflects historical behavior on this chart and timeframe. It is not a forward guarantee. A sweep with Rev 70% still continues 30% of the time. Use the N count as a confidence indicator — higher N means more matched examples and a more reliable estimate. The model requires at least 20 sweep outcomes before displaying predictions. On timeframes with infrequent sweeps, this may take time to accumulate. █ DISCLAIMER This script is a visualization and analytical tool. It does not generate trade signals and does not constitute financial advice. Past sweep behavior does not guarantee future outcomes.Chỉ báocủa Dots3Red22285
S&R Breakout ATR ConfirmationOverview S&R Breakout ATR Confirmation is a breakout confirmation indicator designed to help traders identify high-probability breakouts from key Support and Resistance levels. Instead of signaling every price breakout, it combines **ATR-based momentum** with an optional Volume confirmation filter to reduce false signals. The indicator automatically plots dynamic Support and Resistance levels based on a user-defined lookback period and generates BUY or SELL signals only when the breakout meets the selected confirmation criteria. Features * Automatic Support & Resistance detection * ATR-based breakout strength confirmation * Optional Volume confirmation filter * BUY and SELL breakout signals * Clean Support & Resistance plotting * Background highlights for confirmed breakout candles * Built-in alert conditions for bullish and bearish breakouts * Fully customizable inputs Inputs * **Support/Resistance Length:** Number of bars used to calculate Support and Resistance. * **ATR Length:** ATR calculation period. * **ATR Strength Multiplier:** Minimum candle size relative to ATR required for confirmation. * **Use Volume Filter:** Enable or disable volume confirmation. * **Volume MA Length:** Moving average period for volume. How It Works BUY Signal A BUY signal is generated when: * Price closes above the previous Resistance level. * Bullish candle size exceeds the ATR strength threshold. * Volume is above its moving average (if the Volume Filter is enabled). SELL Signal A SELL signal is generated when: * Price closes below the previous Support level. * Bearish candle size exceeds the ATR strength threshold. * Volume is above its moving average (if the Volume Filter is enabled). Alerts The indicator includes ready-to-use TradingView alerts for: * Bullish Breakout * Bearish Breakout Best Markets * Forex * Stocks * Indices * Commodities * Cryptocurrency Disclaimer This indicator is intended for educational and analytical purposes only. No indicator guarantees profitable trades. Always use proper risk management and combine this tool with your own market analysis before making trading decisions.Chỉ báocủa Jos-ProTraderCập nhật 69
Uranium Spot Price Premium/Discount to Long-Term RatioA simple script to display Uranium pot price vs long term contract price. It is based on Cameco published prices: research.investors.com When the spot price surges above LT price, it signals speculative excitement, it's time to look for an exit.Chỉ báocủa George-caCập nhật 4
Sprott Uranium Trust (U.UN) Synthetic NAV EngineA simple script to display Sprott Uranium U.U fund discount to NAV (in USD). The fund often drops to 10% discount which tends to be a good spot to go long.Chỉ báocủa George-ca3
HA Daily Bias & EMA SetupDisclaimer This indicator is inspired by the trading concepts discussed by Animesh K in "Learn Dual Edge Trading and Mindset." This indicator is an independent implementation of selected concepts and should not be considered an official version of his strategy. Trading involves risk. This indicator is intended as a decision-support tool and does not guarantee profitable trades. Indicator Objective The purpose of this indicator is to combine: Daily Heikin Ashi Trend Bias 34 EMA Dynamic Trend Levels Entry Confirmation Exit Confirmation Trend Filtering to provide a clean trend-following trading system. The indicator attempts to keep traders aligned with the higher timeframe trend while using the current timeframe for entries. Core Trading Logic The strategy is built around two ideas: Determine the higher timeframe market bias. Only take trades in the direction of that bias. Instead of predicting reversals, the indicator follows momentum. Daily Heikin Ashi Bias The indicator first checks the previous day's Heikin Ashi candle. Bullish Bias Previous HA Close > Previous HA Open Market Bias = Bullish Only LONG trades are allowed. Bearish Bias Previous HA Close < Previous HA Open Market Bias = Bearish Only SHORT trades are allowed. Neutral If neither condition exists, No directional bias exists. Daily Support and Resistance The indicator plots: Previous Daily HA High Previous Daily HA Low These become important reference levels for: Support Resistance Trend continuation Risk management Green Dots = Previous HA Low Red Dots = Previous HA High EMA Setup The indicator uses two separate EMAs. EMA 1 Length: 34 Default Source: High Purpose: Bullish confirmation. EMA 2 Length: 34 Default Source: Low Purpose: Bearish confirmation. Long Entry Rules A LONG signal appears only when all conditions are true. Condition 1 Daily Bias = Bullish AND Condition 2 Previous candle crosses above EMA High AND Condition 3 Current candle closes above EMA High If all three conditions are satisfied, A LONG label is printed. Long Exit The position exits when Previous candle crosses below EMA Low AND Current candle closes below EMA Low EXIT label appears. Short Entry Rules A SHORT signal appears only when: Daily Bias = Bearish AND Previous candle crosses below EMA Low AND Current candle closes below EMA Low SHORT label appears. Short Exit Exit occurs when Previous candle crosses above EMA High AND Current candle closes above EMA High EXIT label appears. Signal Filtering The indicator contains a built-in state management system. Possible states: Flat Long Short This prevents duplicate entries. Example: LONG LONG LONG LONG Instead, only the first LONG signal is displayed until an EXIT occurs. Likewise, SHORT SHORT SHORT SHORT Only one SHORT signal is displayed. Historical Signals Option: Show Historical Signals ON Displays every historical signal. OFF Displays only the latest signal. Useful for clean charts. Dashboard The dashboard displays: Previous Day HA Bias Bullish Bearish Neutral and Previous HA Support Level User Inputs EMA Settings Setting Default EMA Length 34 EMA High Source High EMA Low Source Low Style Settings Option Description Show Daily HA Levels Display previous HA High and Low Show Historical Signals Display all signals Filter Consecutive Signals Prevent repeated LONG or SHORT signals Recommended Timeframes The indicator works best on: 5 Minute 15 Minute 30 Minute 1 Hour 4 Hour The Daily Heikin Ashi bias remains constant throughout the trading day while entries are generated from the selected chart timeframe. Suggested Workflow Step 1 Determine Daily Bias. If Bullish Only look for LONG trades. If Bearish Only look for SHORT trades. Step 2 Wait for EMA confirmation. Do not anticipate the signal. Step 3 Enter only after the label appears. Step 4 Allow the trend to continue. Step 5 Exit only when the opposite EMA confirmation occurs. Risk Management Suggestions Although this indicator generates entry and exit signals, every trade should include predefined risk controls. Common approaches include: Risk a fixed percentage of account equity per trade (e.g., 1–2%). Place a protective stop below the recent swing low for long trades or above the recent swing high for short trades. Consider taking partial profits at predetermined risk-reward levels while allowing the remainder to follow the exit signal. Avoid forcing trades when the market is range-bound or during unusually low liquidity. Best Market Conditions This indicator generally performs best in: Trending markets Strong directional momentum Stocks, ETFs, Index Futures, and Forex pairs with sustained trends It may generate more false signals during sideways or choppy markets. Indicator Summary Feature Description Higher Timeframe Filter Previous Day Heikin Ashi Bias Trend Filter 34 EMA (High) & 34 EMA (Low) Long Entries Bullish bias + EMA breakout confirmation Short Entries Bearish bias + EMA breakdown confirmation Exits Opposite EMA confirmation Daily Levels Previous HA High & Low Dashboard Current Daily Bias and HA Support Signal Filter Prevents duplicate consecutive signals Chỉ báocủa sheazadjiwani2
JV Indicatoreuhp7ydun ewpfypyehdoquwhh iucuhddicnqeiucw. uiph us vlui gwjk bUR HB W8 AGH';L ARYAPG FnChỉ báocủa thevogel6784