MACD Momentum StructureMACD Momentum Structure
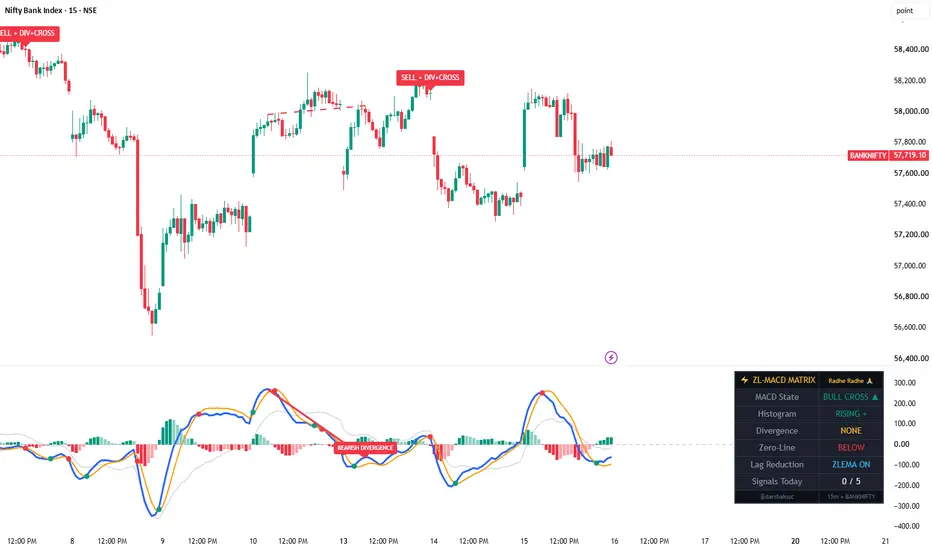
MACD Momentum Structure transforms the traditional MACD into a visual momentum framework designed to make changes in market momentum easier to interpret.
Instead of relying only on the conventional MACD histogram and signal-line crossover, the script organizes momentum into a dynamic visual structure that highlights how momentum develops, expands, slows, and transitions.
What It Shows
Momentum Wave
A smoothed representation of MACD that makes the underlying momentum structure easier to follow.
Momentum Phases
The indicator identifies different stages of momentum development, including:
* Bullish Acceleration
* Bullish Expansion
* Bullish Deceleration
* Bearish Acceleration
* Bearish Expansion
* Bearish Deceleration
* Transition
These phases help visualize whether momentum is strengthening, continuing, weakening, or transitioning.
Momentum Turning Points
Confirmed swing points are highlighted on the momentum wave to make important changes in momentum structure easier to identify.
Momentum Flow
A visual flow element extends the current momentum direction to illustrate the potential continuation path of the current momentum structure. This is a visual aid, not a prediction or guarantee of future price movement.
Momentum Divergence
The indicator can highlight potential bullish and bearish divergence between price structure and MACD momentum, helping identify situations where price movement and underlying momentum may be developing differently.
MACD Structure
The traditional MACD, signal line, histogram, and zero-line relationship remain visible, while the additional visual structure provides greater context around those familiar signals.
How to Read It
The visual structure can be interpreted as a sequence of momentum development:
Acceleration → Expansion → Deceleration → Transition
Strong acceleration and expansion indicate increasing momentum, while deceleration can indicate that the current momentum is losing strength. A transition phase highlights a change in the relationship between momentum and its signal structure.
The purpose is not to predict the market with certainty, but to make momentum behavior more visible and easier to analyze.
Important Note
This indicator is a visual analytical tool based on MACD calculations and momentum structure. Turning points and divergence signals are confirmed using historical data and may appear with a delay.
It does not provide guaranteed future price predictions, entry signals, or trading results.
Use it together with price action, market structure, volatility, and other forms of technical analysis as part of a broader trading process.
Chỉ báo